Enhanced Array Aperture using Higher Order Statistics for DoA Estimation
Payal Gupta
Centre of Applied Research in Electronics, Indian Institute of Technology, New Delhi 110016, India
Monika Agrawal
Centre of Applied Research in Electronics, Indian Institute of Technology, New Delhi 110016, India
Abstract
Recently, the higher order statistics (HOS) and sparsity based array are most talked about techniques to estimate the Direction of Arrival (DoA). They not only provide enhanced Degree of Freedom (DoF) to handle underdetermined cases but also improve the estimation accuracy of the system. To achieve high accuracy and more number of DoF with limited number of sensors, here we have proposed a method based on the fourth order statistics. The aperture of virtual array becomesO(16N4) usingN physical sensors. Proposed method can be extended to the HOS which
increases the DoF by many folds. Numeric simulation validates these claims that the proposed method increases the resolution capacity as well as maximize the DoF among all the earlier proposed method.
Keywords: DoA esimation, Array signal processing, Sparse array, Higher order statistics.
1. Introduction
DoA estimation is a classical research problem has been actively researched since many decades [1]. It has wide range of applications in the field of communica-tions, radar, radio astronomy, sonar, navigation, track-ing of various objects, rescue and other emergency as-sistance devices etc. [1]-[3]. Traditionally, subspace based method such as MuSiC, ESPRIT, Root MuSiC etc. based on the second order statistics, can resolve onlyN−1 sources usingNsensors [1]-[3]. To identify more number of sources than sensors, specialized array structure i.e. minimum redundancy array (MRA) [10], minimum hole array (MHA) [11], nested arrays [12], coprime arrays [13], CaDiS [14] etc. have been sug-gested. Cross correlation lags are being used to provide an enhanced virtual array aperture. Total DoF provided by these structures depend upon the available continu-ous correlation lags. MRA and MHA [10]-[11] do not have any closed form expression for array geometry, it is being designed by searching the best sensor place-ment for the given number of correlation lags. Other sparse structure follow some design rules and provide
Email addresses:[email protected](Payal Gupta),
[email protected](Monika Agrawal)
some relation between number of sensors and number of continuous lags are collected [19][21]. All these es-timated continuous correlation lags are arranged in one vector, aliasing single snapshot observation of enhanced virtual array.
Various methods using spatial smoothing [12]-[13], compressive sensing [14]-[16], vandermonde decom-position [20], covariance augmentation [17]-[18], [29]-[30] etc. have been used to estimate the DoA. Larger the number of continuous correlation lags, more is the num-ber of sources that can be discriminated. Many efforts are being made to design arrays having large contiguous correlation lags.
Further HOS can also be used not only to enhance DoF but also to provide better immunity to noise [5]-[6]. A 2qth level nested array structure is demonstrated [12] which resolveO(N2q) sources usingNsensors. Nesting
subarrays based structure [24]-[25] have been designed to increase the array aperture using HOS by many folds. In this paper we will show that for real valued signals the number of continuous correlation lags for any given array structure can be increased by many folds. These continuous correlation lags increase the available DoF and hence increases the number of sources which can be separated for given number of sensors. We have demon-strated the concept with fourth order statistics (FOS) but
Preprint submitted to Digital signal processing August 29, 2017
similarly the results can be extended for HOS to provide much more number of correlation lags. This conceptu-alized idea has been authenticate by rigorous numerical simulations.
This paper is organized as follow. In section II, we formulate the problem. In section III, we briefly review of the proposed algorithm. In section IV, discuss the example to understand the proposed algorithm. In sec-tion V, we present the numerical simulasec-tion results to prove the proposed algorithm by examining the MSE performance with SNR and the number of sources. The conclusions are in the section VI.
2. Problem Formulation
Let us assume that an array of N sensors, receives D narrow band, uncorrelated far field sources from the directionθ1, ..., θD w.r.t the normal of the array. The
array output at thenth sensor and at thekth snapshot can be expressed as
the wavelength of the received signal,Kis the number of snapshots,sl(k)∈Rdenotes thekth snapshot oflth
source signal. Sources assumed to be real.vn(k) denotes
Gaussian random noise atnth sensor, which is uncorre-lated with the sourcesl(k)∀l.
Lety(k)=y
1(k), ...,yN(k)T, where superscript (.)T
denotes matrix transpose operation. Using a(θl) =
[1,a1(θl), ...,aN(θl)]T,y(k) can be written as,
responding to thekth snapshot. Our aim is to estimate the DoA from the observed signal using the output of the array.
3. Proposed Algorithm
Let us define a vectorz(k)∈C2N×1by concatenating
the array output with its conjugate, i.e.
zi(k)=yi(k) 1≤i≤N (4) As signal are assumed real, i.e,
s∗l(k)=sl(k)
2N can be seen as signal observed at virtual sen-sor present at (−xi) location, which is physically not
present. Hence, the complete vectorz(k) can be seen as the signal observed at an array of 2Nsensors located
at{−xN, ....,−x1,x1, ...,xN}. This array of 2Nsensors,
consisting ofNphysical andNvirtual is termed as semi virtual array and defined as,
Definition 1(Semi Virtual array). LetSbe a set of N
sensors locations whose elements denotes as (x1, ....,xN)
. Then a semi virtual array is formed by placing another Nvirtual sensors at [−x1,−x2. . .] i,eSvis given as,
z(k) can be written as mathematically
where, ˜a(θl) ∈ C2N×1 denotes the semi virtual
steer-ing vector andA˜ =[˜a(θ1), ...,˜a(θD)]2N×Dis termed as
semi virtual array manifold matrix,˜v(k)=[v(k)v∗(k)].
It can be easily seen that with this virtual array mani-fold resolvability of the array becomes almost double. Thereby HOS can further enhance the DoF increasing the number of resolvable sources.
The fourth order cumulant ofz(k) is defined as
cp,q,r,m,cum zp(k),zq(k),zr(k),zm(k)
Theorem 1:For the uncorrelated sources the vector-ized model of (14) can be expressed as
cvec=B(θ)p (15)
where,B(θ)=[b(θ1)...b(θD)] ∈C16N
4×D
,p∈CD×1
represent the 4th order cumulant of the D sources.
Proof :From the (13)
Due to unorrelatedness between source and noise signal,
the above equation can write as
cp,q,r,m=cum The second term of (16) will be vanish due to fourth order cumulant of Gaussian noise is zero. Assuming sources are uncorrelated, it follows that
cum[sl1(k),sl2(k),sl3(k),sl4(k)]=
fourth order cumulant of thelth source. Using (7), (16) becomes
The vectorization form of (14) can be written as
cvec=
One element of vectorcvecis given as,
= which can be seen as the signal observed at a sensor lo-cationwp+wq+wr+wm. Hence totalcveccorresponds
to the signal observed at an array whose sensors are lo-cated atwp+wq+wr+wm. This gives a notion virtual
array defined as,
Definition 2(Virtual Array) Consider a setSvbe a set
of 2N sensors at (w1....w2N). The virtual ArrayL
con-sists of sensors located atwp+wq+wr+wm, defined
as,
L=wp+wq+wr+wm, p,q,r,m∈ {1, ....,2N}
Here this virtual Array can have total 16N4number of
sensors further it should be noted that all the sensors are not distinct because the combinations ofwp,wq,wr,wm
may not be unique, therefore virtual Array will have
< 16N4 distinct elements. This virtual array is
sym-metric about the origin i.e this virtual array has same number of positive and negative elements. The aper-ture of the virtual Array is from 4w1 to 4w2N also
4w1 = −4w2N. LetMdenotes the maximum
continu-ous number in positive side of the virtual array and−M toMcontinuous sensors in this virtual array, i.e. total effective array aperture is 2M+1. This 2M+1 length continuous length virtual array provides 2M+1 DoF. The frequency of the each entry of lag is being defined as weight function. This help in studying the variance of estimated lags.
Definition 3:(weight function) The weight function f(n), counts the periodicity ofninL, defined as
Fn=
(
(wp,wq,wr,wm)
wp,wq,wr,wm∈Sv
wp+wq+wr+wm=n
)
f(n)=|Fn|
where,|k|is the cardinality of the setk.
HereFncorresponds to the number of entries incvec
cor-responding to the nth virtual sensor location. These en-tries corresponding to the same lags are combined to improve the estimate correlation leg. For a good array weight function should be rectangular [12]-[14] so that each estimated lag has equal variance
The constructed single snapshot of observation is used to estimate the DoA of the sources. Single snap-shot will give ill conditioned covariance matrix there-fore spatial smoothing based approach for the estima-tion of DoA has been suggested [12] to the use of sub-space method. Compressive sensing[14]-[16], covari-ance matrix augmentation [17]-[18],[29]-[30], vander-monde decomposition [20] and Maximum likelihood based approaches[26]-[27] etc. can also be used to es-timate the DoA from single snapshots. The details of each of these algorithm are well documented can be taken from references [12]-[30] and are not discussed her to avoid repeatability.
4. Example and Discussion
In this section we showed the enhancement of corre-lation lags achieved by proposed idea. Table I illustrates the comparison of different existing structures with pro-posed method and existing methods. It can be easily seen that with proposed methods the number of contin-uous lags becomes almost double. Further if we extend this idea with HOS much more number of lags can be obtained.
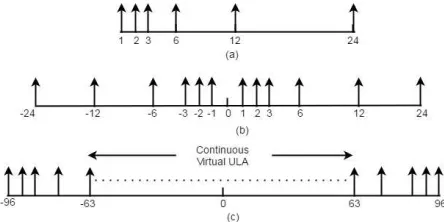
Let us take an example to elaborate the proposed method. Consider the sparse array structure [23] with N = 6 physical sensors, shown in fig. 1(a). In Fig. 1(b), shows the proposed semi virtual array using (12) and a virtual array shown in fig. 1(c). It can be ob-serve that [24] gives 89 unique lags in which 71 lags are consecutive lags in range [−35 35] but proposed method provides 176 unique lags, among them 127 lags are con-secutive in range [−63 63]. Table II has enumerated the no of continous lags achieved by HOS.
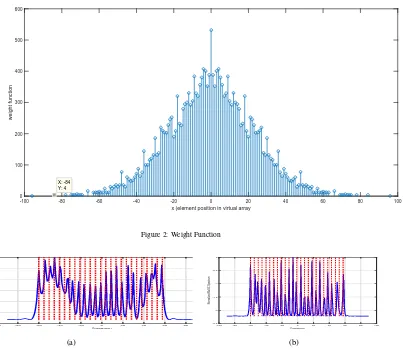
Fig. 2 shows the weight function corresponding to proposed array. The importance of weight function is to improve the estimate correlation leg, from the fig. 2 approximate all correlation lags frequency is more than 50 so the variance of estimated correlation lag is less. The first hole pair in the coarray occurs at 64.
Figure 1: (a).NULA array with N=6 sensors (b) Proposed semi virtual NULA array (c) Proposed virtual ULA
5. Simulation results
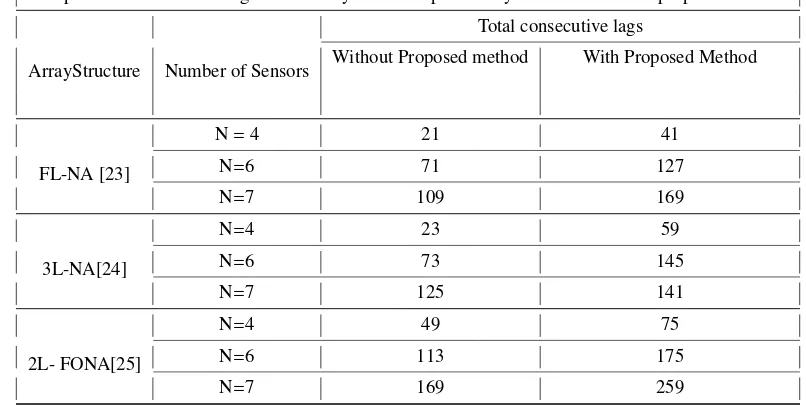
Table 1: COMPARISON OF NUMBER of LAGS ACHIVED BY DIFFERENT SPARSE ARRAY STRUCTURE AND WITH PROPOSED METHOD
Comparison of number of lags achieved by different sparse array structure and with proposed method
ArrayStructure Number of Sensors
Total consecutive lags
Without Proposed method With Proposed Method
FL-NA [23]
N=4 21 41
N=6 71 127
N=7 109 169
3L-NA[24]
N=4 23 59
N=6 73 145
N=7 125 141
2L- FONA[25]
N=4 49 75
N=6 113 175
N=7 169 259
Table 2: Comparison of number of lags achieved by HOS
Order Number of sensor
Continuous Lags
Array Structure
FLNA Proposed method
4th N=6 71 127
6th N=8 433 703
8th N=8 673 1087
Afterwards we conducted Monte-Carlo experiments to analyze the performance in terms of MSE in DOA es-timates as function of input signal-to-noise ratio (SNR) and the number of sources. The subspace based method MuSiC and compressive sensing are used to estimate the DoAs. Other methods [17]-[27] also give similar re-sults but are not shown here to avoid repeatability. We assumed signal sources power is same and sources are modeled as real and random Gaussian processes.
5.1. Music Spectra
In this subsection, we compare the MuSiC spectrum obtained from the FLNA and the proposed approach ap-ply on FLNA. Two FLNA consisting of 6 sensors with locationS={1 2 3 6 12 24}and 4 sensors with the lo-cation ofS = {1 2 4 6}is consider in throughout the
simulations. The maximum continuous lags is obtained
L={−63 −62...0...62 63}obtained by FLNA with
proposed method forN =6 sensors. D = 25 far-field narrowband sources located uniformly between−60◦to
60◦impinge on the FLNA for input of SNR is 0 dB, and
the number of snapshotsK =20,000, the MuSiC spec-tra are compared in fig. 3 and fig. 4. The MuSiC specspec-tra for FLNA depicted in fig. 3a and for proposed approach in fig. 3b. It can be clearly seen that, FLNA has failed to identify all the sources while proposed method are approximate resolve all 25 sources with much better ac-curacy.
Fig. 4 also shows the MuSiC spectrum of FLNA and proposed method for N = 4 physical sen-sors. The maximum continuous lags is obtained
L = {−20 −19...0...19 20} obtained by proposed
method. All the 8 far-field narrowband sources from the directions{−55 −39 −23 −7 9 25 41 57}, are es-timated at 0 dB input SNR and with 20,000 snap-shots. As we can see from the plotted spectra, pro-posed method MuSiC spectra obtained much sharped peaks than earlier suggested algorithm. To understand the behavior of the algorithm in much better form we illustrate the performance of proposed methods through Monte Carlo simulations.
5.2. MSE vs SNR
Now, we compared the DoA estimation performance of different array configuration with proposed method through Monte Carlo simulations.
-100 -80 -60 -40 -20 0 20 40 60 80 100
x (element position in virtual array
0 100 200 300 400 500 600
weight function
X: -84 Y: 4
Figure 2: Weight Function
-100 -80 -60 -40 -20 0 20 40 60 80 100
θ(degree)
-3 -2.5 -2 -1.5 -1 -0.5 0
Normalized MuSiC Spectrum
(a)
-100 -80 -60 -40 -20 0 20 40 60 80 100
θ(degree)
-2.5 -2 -1.5 -1 -0.5 0
Normalized MuSiC Spectrum
(b)
Figure 3: MuSiC Spectrum comparison between two approaches. There are 6 sensors and D=25 sources located uniformly between−60◦to 60◦. The number of snapshots is K=20,000 and signal-to-noise ratio (SNR) is 0 dB. (a) FLNA in [25]; (b) Proposed approach.
(a) (b)
Figure 4: MuSiC Spectrum comparison between two approaches for Number of sensors 4 and Number of sources 8. The number of snapshots is K
=20,000 and signal-to-noise ratio (SNR) is 0 dB. (a) FLNA in [25]; (b) Proposed approach.
We assumed the signal power (σ2) of sources is same in simulation. The SNR is defined as
S NR=10 logσ
2
σ2
n
=20 log σ
where,σ2
n is the variance of noise. The average mean
square error(MSE) of the estimated DoAs, given as
MS E= 1
where, ˆθis the estimated DoAs for theith Monte Carlo trial,i= 1, ...I. Here, we use 100 Monte Carlo trial for all simulations.
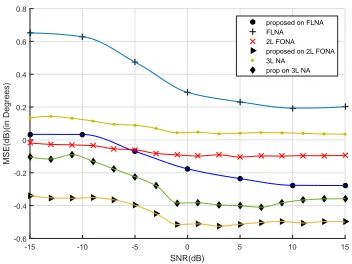
We consider D = 3 sources with the angles {−60,−5,50} and D = 8 sources with the angles {−60,−43,−26,−9,8,25,42,59,}and compare with the three array configuration for N = 6 physical sen-sors with the location of {1 2 3 6 12 24} for FLNA, {0 1 2 3 21 28} for 2L-FONA and {1 2 3 4 8 30} for 3LNA. The DOA is estimated using the subspace based MuSiC algorithm. Fig. 8 shows the average MSE of all DoAs for individual array configuration as a function of SNR, for 2000 snapshots. The corresponding plots for D=3 andD=8 are given by fig. 5 and fig. 6 forN=6 sensors. Clearly, all array configuration with proposed method gives much better MSE. There is huge perfor-mance gain of almost 15−20 dB.
Figure 8 shows the mean square error of estimat-ing DoA by usestimat-ing compressive sensestimat-ing method LASSO with the 0.25 penalty parameter.
-20 -15 -10 -5 0 5 10 15 20
Figure 5: Mean Square Error (MSE) vs. SNR for 100 Monte Carlo experiments with N = 6 physical sensors with the loca-tion of{1 2 3 6 12 24}for FLNA,{0 1 2 3 21 28}for 2L-FONA and
{1 2 3 4 8 30}for 3LNA and D = 3 sources from the direction
{−60,−5,50}using MuSic algorithm. The number of snapshots is K=2000.
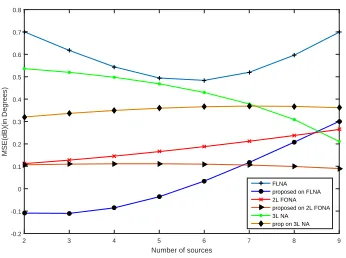
5.3. MSE versus Number of sources
In this section we study the impact of variation of number of sources. ConsiderN = 4 physical sensors with the location{1 2 4 6}for FLNA,{0 1 9 12}for 2L-FONA and{1 2 3 10}for 3LNA at 2000 snapshots. We vary sources fromD=2 toD=9 in the range−60◦:
60◦with the separation{91,54,33,26,22,20,17,15}
re-spectively. Fig. 8 illustrates the effect of number of sources of FLNA, 2L-FONA and 3LNA array structure with our proposed algorithm at 20 dB SNR and MSE increases with sources increases. It can be clearly seen that the proposed algorithm has less error compared to the existing methods [23]-[25].
Figure 6: Mean square error (MSE) by MuSiC vs. SNR for 100 Monte Carlo experiments withN=6 physical sensors with the lo-cation of{1 2 3 6 12 24}for FLNA,{0 1 2 3 21 28}for 2L-FONA and{1 2 3 4 8 30}for 3LNA andD = 8 sources from the direc-tion{−60,−43,−26,−9,8,25,42,59,}. The number of snapshots is K=2000.
Figure 7: Mean square error (MSE) by Compressive sensing vs. SNR for 1000 Monte Carlo experiments with 6sensors with the location of{1 2 3 6 12 24}and D = 8 sourcesfrom the direction
{−60,−43,−26,−9,8,25,42,59,}. The number of snapshots is K=
5000.
6. Conclusion
In this paper we have exploited the property of real signals to show the separability of the give array
2 3 4 5 6 7 8 9
Figure 8: Mean square error (MSE) by MuSiC vs. Number of sources for 100 Monte Carlo experiments with 4 sensors at 20 db SNR. The number of snapshots isK=2000.
ture can be doubled. It not only increases the DoF thereby increases the number of signals for which DoA can be estimated but also decrease the MSE in the es-timation. We have shown the concept using forth order statistics. But much more improvement can be obtained using further higher order statistics. Numeric simula-tion proves the efficacy of the proposed algorithm.
7. References
[1] H. Krim and M. Viberg,”Two decades of array signal processing research: the parametric approach,” IEEE Signal Process. Mag., vol. 13, pp. 6794, Jul. 1996.
[2] H. L. V. Trees, Detection, Estimation, and Modulation Theory. Part IV., Optimum Array Processing, Wiley- Interscience, 2002. [3] T. E. Tuncer and B. Friedlander, Classical and Modern
Direction-of-Arrival Estimation, Academic Press, 2009.
[4] M. C. Dogan and J. M. Mendel, ”Applications of cumulants to array processing Part I: Aperture extension and array calibration,” IEEE Trans. Signal Process., vol. 43, no. 5, pp. 1200–1216, May 1995.
[5] B. Porat and B. Friedlander, ”Direction finding algorithms based on higher order statistics,” IEEE Trans. Signal Process., vol. 39, no. 9, pp. 2016–2024, Sep. 1991
[6] J. M. Mendel, ”Tutorial on higher-order statistics (spectra) in sig-nal processing and system theory: Theoretical results and some applications,” Proc. IEEE, vol. 79, no. 3, pp. 278–305, Mar. 1991. [7] P. Chevalier and A. Ferreol, ”On the virtual array concept for the fourth-order direction finding problem,” IEEE Trans. Signal Pro-cess., vol. 47, pp. 2592–2595, Sep. 1999.
[8] P. Chevalier, L. Albera, A. Ferreol, and P. Comon, ”On the vir-tual array concept for higher order array processing,” IEEE Trans. Signal Process., vol. 53, no. 4, pp. 1254–1271, Apr. 2005. [9] R. T. Hoctor and S. A. Kassam, ”The unifying role of the coarray
in aperture synthesis for coherent and incoherent imaging,” Proc. IEEE, vol. 78, no. 4, pp. 735–752, April 1990.
[10] A. Moffet, ”Minimum-redundancy linear arrays,” IEEE Trans. Antennas Propag., vol. 16, no. 2, pp. 172–175, Mar. 1968. [11] G. S. Bloom and S. W. Golomb, ”Applications of numbered
undirected graphs,” Proc. IEEE, vol. 65, no. 4, pp. 562–570, April 1977.
[12] P. Pal and P. P. Vaidyanathan, ”Nested arrays: A novel approach to array processing with enhanced degrees of freedom,” IEEE Trans. Signal Process., pp. 4167–4181, Aug. 2010.
[13] P. Pal and P.P. Vaidyanathan, ”Coprime sampling and the mu-sic algorithm,” in Digital Signal Processing Workshop and IEEE Signal Processing Education Workshop (DSP/SPE), 2011 IEEE, pp. 289–294, Jan 2011.
[14] S. Qin, Y. D. Zhang, and M. G. Amin, ”Generalized coprime array configurations for direction-of-arrival estimation,” IEEE Trans. Signal Process., vol. 63, no. 6, pp. 1377–1390, March 2015.
[15] G. Tang, B. Bhaskar, P. Shah, B. Recht ”Compressed sensing off
the grid,” IEEE Trans. Inf. Theory, pp. 7465-7490, 2013. [16] C. Zhou, Y. Gu, Y.D. Zhang, Z. Shi, T. Jin, X. Wu ”Compressive
sensing based coprime array direction-of-arrival estimation,” IET Commun. 2017.
[17] X. Wu, W.P. Zhu, J. Yan, ”A toeplitz covariance matrix re-construction approach for direction-of-arrival estimation,” IEEE Trans. Veh. Technol., pp.99, 2017.
[18] X. Wu, W.-P. Zhu, J. Yan ”Direction-of-arrival estimation based on Toeplitz covariance matrix reconstruction,” IEEE Interna-tional Conference on Acoustics, Speech and Signal Processing (ICASSP), 2016.
[19] Y. D. Zhang, M. G. Amin, B. Himed, ”Sparsity-based DOA es-timation using co-prime arrays”, Proc. IEEE ICASSP, pp. 3967-3971, 2013-May.
[20] Shen, Y.; Zhou, C.; Gu, Y.; Lin, H.; Shi, Z., ”Vandermonde de-composition of coprime coarray covariance matrix for DOA es-timation,” In Proceedings of the 18th IEEE International Work-shop on Signal Processing Advances in Wireless Communica-tions (SPAWC), Sapporo, Japan, 3–6 July 2017.
[21] S. U. Pillai, B. H. Kwon, ”Forward/backward spatial smooth-ing techniques for coherent signal identification,” IEEE Trans. Acoust. Speech Signal Process., vol. 37, no. 1, pp. 8-15, Jan. 1989.
[22] P. Chevalier, A. Ferreol, and L. Albera, ”High-resolution direc-tion finding from higher order statistics: The -MUSIC algorithm,” IEEE Trans. Signal Process., vol. 54, no. 8, pp. 2986–2997, Aug. 2006.
[23] P. Pal and P. P. Vaidyanathan, ”Multiple level nested array: An efficient geometry for 2qth order cumulant based array process-ing,” IEEE Trans. Signal Process., vol. 60, no. 3, pp. 1253–1269, March 2012.
[24] Q. Shen, W. Liu, W. Cui, and S. Wu, ”Extension of co-prime ar-rays based on the fourth-order difference coarray concept,” IEEE Signal Process. Lett., vol. 23, no. 5, pp. 615–619, May 2016. [25] Ammar Ahmed, Yimin D. Zhang, Braham Himed, ”Effective
nested array design for fourth-order cumulant-based DOA esti-mation,” Radar Conference (RadarConf) 2017 IEEE, pp. 0998-1002, 2017.
[26] P. Stoica and K. Sharman, ”Maximum likelihood methods for direction-of-arrival estimation,” IEEE Transactions on Acoustics, Speech and Signal Processing, vol. 38, no. 7, pp. 1132–1143, July 1990.
[27] P. Stoica and A. Nehorai, ”MUSIC, maximum likelihood, and Cramer-Rao bound,” IEEE Trans. Acoust., Speech Signal Pro-cess., vol. 37, no. 5, pp. 720–741, May 1989.
[28] Guo, M.; Tao, C.; Wang, B., ”An improved doa estimation ap-proach using coarray interpolation and matrix denoising,” Sen-sors 2017, 17, 1140
[30] S. Pillai, Y. Bar-Ness, and F. Haber, ”A new approach to array geometry for improved spatial spectrum estimation,” Proceedings of the IEEE, vol. 7, no. 10, pp.1522–1524, 1985.
Payal Gupta was born in Delhi, India on March
18,1989. She received the B.Tech degree in Electron-ics and communication engineering from Uttar Pradesh Technical University, Lucknow, in 2010, and the M.tech degree in signal processing from Delhi University, In-dia, in 2014.
She is currently pursuing the Ph.D degree in the field of signal processing at Indian Institute of Technology, Delhi, India. Her research interests are in sensor array signal processing, direction of arrival and sparse array design.
Monika Agrawal can be found at url:
http://care.iitd.ac.in/People/Faculty/ M_Aggarwal.htm