HIGH RESOLUTION LANDCOVER MODELLING WITH PLÉIADES IMAGERY
AND DEM DATA IN SUPPORT OF FINE SCALE LANDSCAPE THERMAL
MODELLING
M. Thompson a, L. Moyo a, C. Eloff b, T. Prinsloo c, P. Bouwer c, N. Brink d
a GeoTerra Image, South Africa – [email protected] b Airbus, South Africa – [email protected]
c Pinkmatter Solutions, South Africa – [email protected] d DENEL Dynamics, South Africa – [email protected]
KEY WORDS: Land-cover, urban mapping, Pleiades, Tri-Stereo, Simulated thermal
ABSTRACT:
In the evaluation of air-borne thermal infrared imaging sensors, the use of simulated spectral infrared scenery is a cost-effective way to provide input to the sensor. The benefit of simulated scenes includes control over parameters governing the spectral and related thermal behaviour of the terrain as well as atmospheric conditions. Such scenes need to have a high degree of radiometric and geometric accuracy, as well as high resolution to account for small objects having different spectral and associated thermal properties. In support of this, innovative use of tri-stereo, ultra-high resolution Pléiades satellite imagery is being used to generated high detail, small scale quantitative terrain surface data to compliment comparable optical data in order to produce detailed urban and rural landscape datasets representative of different landscape features, within which spectrally defined characteristics can be subsequently matched to thermal signatures. Pléiades tri-stereo mode, acquired from the same orbit during the same pass, is particularly favourable for reaching the required metric accuracy because images are radiometrically and geometrically very homogeneous, which allows a very good radiometric matching for relief computation. The tri-stereo approach reduces noise and allows significantly enhanced relief description in landscapes where simple stereo imaging cannot see features, such as in dense urban areas or valley bottoms in steep, mountainous areas.
This paper describes the datasets that have been generated for DENEL over the Hartebeespoort Dam region, west of Pretoria, South Africa. The final terrain datasets are generated by integrated modelling of both height and spectral surface characteristics within an object-based modelling environment. This approach provides an operational framework for rapid and highly accurate mapping of building and vegetation structure of wide areas, as is required in support of the evaluation of thermal imaging sensors.
1. MANUSCRIPT
1.1 Backgroud DENEL Information Requirement
High resolution ground information is being used by DENEL Dynamics for feature identification by airborne-based cameras operating in the thermal infrared wavelength region, as an aid to navigation by autonomous aerial vehicles. Feature identification algorithms are being developed and tested in a simulation environment where the imagery or scene is presented to a modelled infrared camera, and this requires accurate classification of the pixel footprint. High resolution 0.5 meter, four spectral band1 Pléiades satellite image data is being used to generate both high detail terrain data and landscape characterisation data, within which conventional land-cover / land-use information categories can be used to represent thermally distinct surfaces. The advantage of using satellite imagery is the ability to simulate a thermal radiance scene for any time of the day without having to perform high cost field measurements.
1.2 Pléiades Tri-Stereo Image Data Capture
1Visible Blue, Green, Red and Near Infrared spectral
bands.
The tri-stereo terrain data generation approach differs from conventional stereo data generation through the application of two oblique and one near-nadir viewing of the terrain, as opposed to just two oblique views; which provides the ideal solution for accurate 3D modelling. This is especially relevant in areas of high relief variation, including dense, high-rise urban landscapes, where the tri-stereo image coverage (2 x oblique and 1 x nadir) image combination significantly minimises the problem of data 'loss error' areas in the final Digital Surface Model (DSM). This can result in a reduction of ± 75% of “hidden area objects”, which can arise with conventional 2 x oblique image coverages, as a result of object lean and view obscuring effects (see Figure 1).
The International Archives of the Photogrammetry, Remote Sensing and Spatial Information Sciences, Volume XLII-3/W2, 2017 37th International Symposium on Remote Sensing of Environment, 8–12 May 2017, Tshwane, South Africa
This contribution has been peer-reviewed.
Figure 1: Stereo (left) and Tri-Stereo (right) terrain data extraction
Pléiades tri-stereo mode, acquired from the same orbit during the same pass, is particularly favourable for reaching the required metric accuracy because images are radiometrically and geometrically very homogeneous, which allows a very good radiometric matching for relief computation. The final terrain datasets consisted of a 1 metre resolution DSM, and a derived (equivalent resolution) Digital Terrain Model (DTM), with vertical (LE90) absolute and relative accuracies of ≤ 1.5 and 1 meters respectively; and horizontal (CE90) absolute and relative accuracies of ≤ 1.5 and 1.5 meters respectively.
A significant advantage to the overall objectives of the project was that the tri-stereo data acquisition was able to acquire both the 2 x oblique and 1 x nadir imagery on the
same day, so that there was a direct link between the
modelled topography and the derived land-cover/use dataset, mapped from the nadir image.
1.3 Modelling Tri-Stereo Generated Terrain Data
The area around the Hartebeespoort Dam had several challenges for the terrain data modelling. The landscape is very heterogeneous, including areas of thick vegetation, housing, roads, veld and large bodies of water; whilst the terrain is equally variable with the Magaliesberg mountain range transecting the area and casting long and deep shadows from the steep escarpment. The large size and orientation of the study area (385 km2) also required two separate tri-stereo taken over the eastern and western parts of the study area respectively (acquisition 1 of 120 km2, and acquisition 2 of 265 km2). Although acquired on different days, the date-difference between each was however negligible in terms of landscape change (i.e. acquisition 1 on 2016-07-14 and acquisition 2 on 2016-07-20, delta of 6 days). This resulted in large data volumes to be processed with associated challenges, since each acquisition contained three images at different angles, each with a slightly different time stamp. stereo-pair introduced problems with ripples on the (Hartebeespoort Dam) water surface which must be accounted for. Significant changes in local landscape characteristics (i.e. montain, urban, cultivated, woodland, etc.) required modification of processes and techniques for optimal outputs.
The terrain data processing procedure was designed to take these factors into account, in order to provide a highly accurate elevation model and orthorectified imagery at 0.5m
2 National GeoSpatial Information (Department of Rural
Development and Land Reform)
3 The epipolar geometry is the intrinsic projective geometry between two views. It is independent of scene structure, and only depends on the cameras' internal parameters and relative pose.
GSD4 (Ground Sampling Distance). The processing can be split into four distinct cycles: (1) DEM Extraction Cycle, (2) Reference PAN Cycle, (3) Orthorectification Cycle, and the (4) Product Generation Cycle.
During the DEM Extraction Cycle (1), DSMs and DTMs are generated from the two tri-stereo acquisitions.
DEM generation starts with the NGI aerial photography and the 30 meter SRTM elevation models as reference. The geometric model is refined, using the PAN images from each tri-stereo acquisition. PAN images are used because of their finer GSD compared to the MS data. The most nadir of each tri-stereo acquisition is used to generate a water mask, using a semi-autonomous classification approach. Epipolar pairs are then extracted from the PAN images for which the geometric models have been calculated. From these pairs the DSM can be extracted.
The DSM is then refined both automatically and manually, to take the various terrain types and properties, such as water-bodies and shadows, into account. The DSM is then terrain-filtered, again with a combination of automated and manual processes to generate a DTM. This process removes all above-ground structures from the detailed DSM. Hereafter, the DSM and DTM can be mosaiced and down-sampled to produce products at various GSDs, in this case the required 1 meter resolution format.
In the Reference PAN Cycle (2), the newly generated mosaiced DTM and the most-nadir PAN band of each tri-stereo acquisition are used to generate Reference PAN images.
The intention of the PAN Cycle (2) process is to generate a 0.5 meter GSD image with high geometric precision to use as reference for future orthorectification steps. The most-nadir PAN image for each tri-stereo acquisition is orthorectified, still using the NGI ortho-photography data as ground-control, but now incorporating the mosaiced DTM previously generated.
Each image in the tri-stereo acquisition is then orthorectified using the Reference PAN and the Mosaiced DTM to generate the Orthorectified (Ortho) images as part of the Orthorectification Cycle (3). However, this time, instead of the NGI data as reference, the Reference PAN is used to orthorectify all the images in the entire set. As the temporal difference between all three tri-stereo images are very small (i.e. a couple of seconds), the new reference image has the advantage of having very similar geometric and radiometric properties. As a result, all generated orthorectified images co-register very well.
Finally, during the Product Generation Cycle (4), the orthorectified images are PAN-sharpened, top-of-atmosphere corrected and mosaiced into the final deliverables.
1.4 Generation of the Base Land-cover Data.
4The 0.5 m datasets were subsequently re-sampled to 1 m
resolution to match the standard data formats for Airbus WorldDEM1 data.
The International Archives of the Photogrammetry, Remote Sensing and Spatial Information Sciences, Volume XLII-3/W2, 2017 37th International Symposium on Remote Sensing of Environment, 8–12 May 2017, Tshwane, South Africa
This contribution has been peer-reviewed.
The objective of the land-cover / land-use classification process was to generate a sufficiently detailed characterization of the Hartebeespoort Dam study area that enabled the identification of thermally equivalent thematic information classes. To put his into context, in a conventional urban land-cover / land-use classification, an urban area is typically grouped into categories based on structure density and use. Whereas in this project potentially different thermal units such as roof material and colour, or road tarmac colouration or (white) road markings were all potential information classes requiring individual spatial identification and delineation.
All classification procedures were based on object rather than individual pixel-based modelling to enable, as far as possible, extraction of true landscape object (or object-component) extents. Segmentation boundaries were generated only from the ortho-imagery, since this generated a sharper and better aligned object boundary, since in many cases the terrain data exhibited an object edge height gradient rather than a sharp (i.e. roof gutter-line) delineation. For this reason all classification and modelling statistics were developed using zonal assessments within each segment, and not per pixel.
The first classification step involved separating height-determinable landscape objects from ground-based objects, using the DTM data and a pre-determined 2 meter threshold height, allowing the identification of all tall (woody) vegetation and man-made structures. Once a satisfactory separation of ground and height-based objects had been achieved, a more detailed object-based classification of spectral and height content was used to hierarchically separate vegetation from non-vegetated surfaces, and all subsequent sub-class levels of detail (see Figure 2).
Figure 2: Separation of tall woody vegetation and roofs using 2m DTM height threshold
In several instances, the height and spectral data alone were insufficient to generate the required level of sub-class detail, so additional, ancillary spatial data masks, such as buffered road centre lines, where used to further separate interim classes which would otherwise have similar height and spectral characteristics. For example, separating (painted) white road markings from light coloured concrete kerb stones and pavements on the road edge.
Separation of roof colours, (once roof objects had been delineated), relied primarily on the use of analyst-assisted, conventional supervised classification techniques, based on derived green, red and blue indices. Surprisingly the incorporation of the NIR spectral band did not enhance, but in many cases confused the roof colour classification process, especially where green roofs were concerned. The reason for this has not been determined but maybe due to the content and characteristics of the paint pigments, since
similar effects have been noted when attempting equivalent classification procedures with comparable RGB-NIR aerial photography.
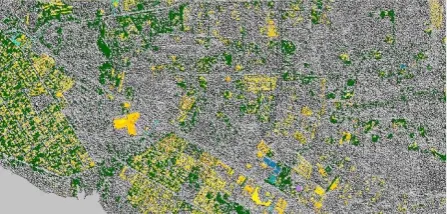
Shadowed areas, occurring on the southern edges of both tall (woody) vegetation and man-made structures were removed by ensuring that multiple object segments were used to define the total shadow area, and then re-defining each segment on the basis of the associated zonal height statistics, such that ‘high’ shadows were incorporated in to the closest adjacent above-ground class, and ‘low’ shadows into the closest adjacent on-ground class (see Figure 3).
Figure 3: Comparison of land-cover, with shadows, to original PAN-merged imagery
Conversion of the Base Land-cover / Land-Use Data into Thermal Units
The infrared camera views a thermal scene which typically comprises natural terrain with man-made objects such as buildings, roads, dams, etc. When identification of specific features is required, this ‘visual’ scene, a.k.a the high detail land-cover / land-use data, needs to be converted into a thermal representative image.
The thermal conversion process is performed in a simulation environment which utilises the 0.5 meter (unclassified) PAN image of the area, the classified land-cover/land-use dataset, which is used as a surrogate for identifying the material type in each image pixel (not classification object), and a re-sampled 5 meter DEM. In addition, meteorological data (including upper air atmospheric data) and a thermodynamic material database are used. The latter consists of parameters such as heat capacity, thermal conductivity, density and emissivity for each class in the land-cover / land-use dataset and is used to calculate the expected temperature of each class object. Since the simulation environment runs in 3D space, individual class objects can be added individually to the imagery.
The process of conversion involves the following steps. Firstly the PAN image and classified land-cover / land-use dataset are converted to bitmap format. For each land-cover / land-use class a thermodynamic model is executed (using the meteorological data and thermodynamic database) to calculate the temperature of that class, for any given time of the day. The class temperatures are then assigned back to each pixel and converted to thermal radiance which is what the camera ‘sees’. The radiance map is draped over the topography. Finally, camera effects (i.e. motion, noise, blur) as would be experienced onboard an autonomous aerial vehicles, are added which results in an image which can be used to evaluate the feature extraction algorithm used in the navigation process.
The International Archives of the Photogrammetry, Remote Sensing and Spatial Information Sciences, Volume XLII-3/W2, 2017 37th International Symposium on Remote Sensing of Environment, 8–12 May 2017, Tshwane, South Africa
This contribution has been peer-reviewed.
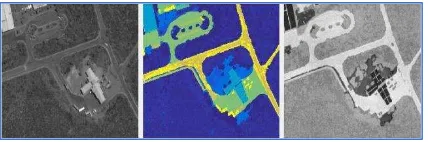
Figure 4 shows an example of a panchromatic and classified image, and the resulting thermal radiance (infrared) image.
Figure 4: Example of a panchromatic and classified image, and the resulting thermal radiance (infrared) image.
The International Archives of the Photogrammetry, Remote Sensing and Spatial Information Sciences, Volume XLII-3/W2, 2017 37th International Symposium on Remote Sensing of Environment, 8–12 May 2017, Tshwane, South Africa
This contribution has been peer-reviewed.