PUBLIC FIRM'S BACKGROUND ON THE
PERFORMANCE-GOVERNANCE RELATION: EVIDENCE FROM INDONESIA
Kusdhianto Setiawan
Faculty of Economics and Business, Universitas Gadjah Mada
([email protected])Eddy Junarsin1
Faculty of Economics and Business, Universitas Gadjah Mada
([email protected])Sri Handaru Yuliati
Faculty of Economics and Business, Universitas Gadjah Mada
([email protected])ABSTRACT
This study purports to test two governance issues in Indonesian listed firms. To explore corpo-rate governance mechanisms in Indonesia, we ought to understand that listed firms on the Indonesian capital market came from two initial business backgrounds: (1) private firms, which had been private businesses before going public; and (2) Badan Usaha Milik Negara (state-owned enterprises), which were (state-owned by the Indonesian government and managed by government-appointed management. Although both types of the firms have gone public, their differences might remain intact, such as differences in size, lines of business, market share, and the efficiency of corporate governance. Using 442 raw sample from all firms listed on the Indonesian Stock Exchange during 2003-2012, we find that governance characteristics and performance relation does differ between previously SOE firms and previously private firms. However, we do not find evidence of distinct financial performance between previously SOE firms and previously private firms.
Keywords: SOE firms, private firms, corporate governance, firm performance, firm background
INTRODUCTION
Corporate1 governance addresses and deals with issues such as how the suppliers of funds act to get returns on their investments, assure that managers do not waste the firm's resources which they supply, and control the managers (Schleifer and Vishny, 1997). Many a time, pro-fessional managers have an intention and an opportunity to waste money which is not in line with value maximization. Corporate governance is an important large practice in a firm. There are
1
Corresponding author. We are grateful for the research grant provided by the Faculty of Economics and Business, Universitas Gadjah Mada.
good and bad mechanisms on which researchers have been conducting research.
Poor corporate governance is one of the cul-prits during the Asian financial crisis in 1997. Businessesowned and managed by a family were lacking in control by external entities, whereas management was less transparent due to inade-quate accounting and disclosure standards. In managing the firm, the controlling family owner-shave been able to pursue their private interests easily, often at the expense of minority shareholders and their firm's long-term sustain-ability (Nam and Nam, 2004). Without enhanc-ing corporate governance, economic growth is unlikely to improve, and countries with poor governance are more vulnerable to other crises in the future.
Much research on corporate governance has increased in the wake of the financial crisis, whereby corporate governance is blamed on the circumstances. Asia is a very diverse region with respect to economic development and institu-tional regimes. Income per capita varies from about $1,000 in India to $4,000 in Indonesia and more than $30,000 in Hong Kong and Singapore (Claessens et al., 2002). However, there are similarities across the economies, such as the concentration of family ownership and the prevalence of relationship-based transactions.
Changesin regulations in Asian countries after the financial crisis have been in place. Some of the changes purport to strengthen minority shareholders' rights. This reform corre-sponds with the Western model, which strives to increase managerial transparency and create stronger corporate governance by imposing accounting and auditing standards. Nevertheless, practitioners and academics alike are still doubt-ful as to whether the model will work well in the context of Asian economies.
Some researchers have provided evidence that shareholders are not the only entities who exert an important influence on corporate gov-ernance, but other stakeholders such as employ-ees, creditors, etc. also play some roles. Nam and Nam (2004) conducted a survey on four countries highly impacted by the financial crisis in the end of 1990s: Indonesia, Korea, Malaysia, and Thailand. Their results indicate that there is a gap between regulatory framework and formal
corporate governance practices. On assessing the corporate governance quality, it is found that the market seems to differ largely on the basis of substances, i.e., the lack of quality of corporate governance for firms run by controlling families and poor corporate governance in countries in which legal and judicial systems for investor protection are weak. Their findings also indicate that although the four countries are still far away from the Western governance practices, the market however does discriminate among firms according to the higher standards, implying that firms might eventually move toward meeting those standards.
So much attention has recently been paid to corporate governance in Asia. Some researchers, such as, Claessens et al. (2002),have endeavored to observe the pivotal effects of laws on corpo-rate governance, capital market development, and economic growth. Their study shows that in a weaker legal environment, firms not only ob-tain less financing, but also invest less in intan-gible assets. Subsequently, the investment and financing patterns affect the economic growth of a country.
According to the study of Claessens and Fan (2002), corporate governance in Asia offer some important issue to address, such as: (1) agency problem, which exists due to the large deviation between control and cash flow rights; (2) low transparency in Asian companies; (3) diversifi-cation structure, which relates to transactions in internal markets or within the same organization; (4) the cause of ownership structure and how the ownership structure affects not only firm per-formance and value, but also firm policies; (5) alternative actions to enhance governance mechanisms; (6) internal governance of family firms; and (7) the interaction between public governance and corporate governance.
pri-vate firms after they become publicly listed companies.
The remainder of this study is organized as follows. Section two discusses literature review and develops hypotheses. Section three elabo-rates on data and research methods. Results are shown and discussed in Section four. Eventually, Section five concludes and provides a summary.
LITERATURE REVIEW
Shareholders use both internal and external governance mechanisms to reduce agency costs. External mechanisms are intertwined with ex-ternal environments such as capital markets, the market for corporate control, and the market for jobs. Meanwhile, internal mechanisms align shareholders’ interests with those of manage-ment by decisions such as designing proper compensation packages, empowering the board of commissioners, and utilizing leverage.
For the U.S. context, a myriad of studies have documented the general traits of corporate governance structure. First, it has a dominant or powerful executive. Second, it has a relatively friendly board of directors highly influenced by the executives. Third, shareholders are widely dispersed, accordingly they are usually weak unless there are a few blockholders. Fourth, some executives have a long tenure and may serve until retirement, so the potential replace-ment is not well prepared. Fifth, the external market for corporate control works very well. Sixth, management has advantages pertaining to crucial information. Seventh, the market for managerial jobs is active, implying that U.S. executives are more likely to move from one company to another (Ang and Constand, 1997)
Discussion and heated debates on corporate governance have inspired financial academics to conduct research on governance mechanisms and their relations to shareholder wealth. Board size, board independence, governance indexes, and other governance mechanisms have been observed studied by academics, practitioners, and policymakers. Our study follows Faleye (2006) and Lehn et al., (2007), among others, who link firm performance to corporate govern-ance indicators. For instgovern-ance, those studies
con-clude that firm performance is negatively linked to the Gompers, Ishii, and Metrick (GIM) index. A higher GIM index indicates a lower corporate governance quality. Hence, the higher the gov-ernance index, the worse would be the firm value.
Of the 24 provisions employed in the GIM index, classified board is considered one of the most influential components as studies have proved that a classified board is negatively re-lated to firm value. Meanwhile, Faleye (2006) reports that a smaller board and that with higher percentage of outside directors is better than a larger board with a lower proportion of outside directors. With regard to insider ownership, Bebchuk and Cohen (2005) and Faleye (2006) document that managerial ownership has a posi-tive relation with firm value up to a certain level, but beyond that level the relation between managerial ownership and firm value becomes negative. Jiraporn et al., (2006), from a different angle, tested the link among governance, diver-sification, and firm value. Their findings confirm the notion that the governance index is negatively related to firm value. They also pro-vide results that firms with low governance mechanisms (or high GIM index) are more in-clined to diversify across industries, which has been evidenced to reduce value.
have lower managerial ownership, have older directors, and have directors with a higher educational level of directors than do private firms. SOE firms also appoint more independent directors from academia, and their Chairpersons are less likely to be the CEOs. Moreover, Tong and Junarsin's (2013) study documents that hiring independent directors who have account-ing skills is beneficial to an SOE firm’s per-formance whereas for a private firm, its financial performance is unaffected even when it hires independent directors with accounting skills.
The nature of SOE structure has yielded complicated governance issues with regard to board structure and independence. Indonesia basically adopts a two-tier board structure com-prised of a board of executive directors (in the U.S. this is equivalent to a board of manage-ment) and a board of commissioners (this is known as a board of directors in the U.S.). Commissioners might not be significantly in-volved in the selection of directors/managers, and therefore may not possess the authority to supervise them effectively. Besides, the Indone-sian government and/or majority shareholders (which are usually government agencies) still exert a disproportionate influence on the ap-pointment of independent commissioners, the President Commissioner, the CEO, and senior executives. Practitioners as well as academics have raised their voices and concerns that regu-lation must prevail for enabling the appointment of truly independent commissioners to represent minority shareholders.
In Indonesia, minority shareholders are a highly fragmented group of individuals. Retail investors, as in many capital markets throughout the world, are often lacking in investment knowledge and also in the awareness of share-holder rights. It is relatively troublesome for individual investors in Indonesia to enforce their legal rights against a fraudulent public firm. Without sufficient financial resources and the understanding of investment and legal knowl-edge, those retail investors might not be able to take appropriate actions when their rights are breached by major shareholders. Under these circumstances, the existence and roles of
inde-pendent commissioners should be magnified.
Predicated upon the discussion above, we make several conjectures in this study:
H1: Previously private firms outperform previ-ously SOE firms after they go public
H2: Previously private firms have different corporate governance characteristics than previously SOE firms after they go public
RESEARCH METHODS
Data are collected from annual reports. This study's observation period is from 2003 to 2012. The period after 2003 is chosen as it was the period after the passage of the Sarbanes-Oxley Act (SOX) where firms all over the world also became aware of and adopted stricter govern-ance regulations. We are able to collect 442 raw sample from all firms listed on the Indonesian Stock Exchange during 2003-2012. Hence, we have 4,240 raw firm-year observations.
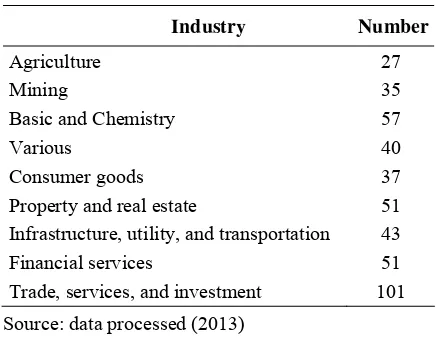
Of the 442 firms, 27 are agricultural compa-nies, 25 mining, 57 basic and chemistry, 40 vari-ous, 37 consumer goods, 51 property and real estate, 43 infrastructure, utility, and transporta-tion, 51 financial services, and 101 trade, ser-vices, and investment. The summary of our sample firms' distribution is shown in Table 1. Pertaining the backgrounds of firms, 424 had been private companies previously whereas 18 were previously SOEs.
Table 1. Sample Firms' Distribution
Industry Number
Agriculture 27 Mining 35
Basic and Chemistry 57
Various 40
Consumer goods 37
Property and real estate 51
Infrastructure, utility, and transportation 43
Financial services 51
Trade, services, and investment 101
Source: data processed (2013)
the same as that used in Wernerfelt and Mont-gomery (1988), Wei, Xie, and Zhang (2005), Fan, Wong, and Zhang (2007), Yermack (1996), and Lang and Stulz (1994).
Subsequently, we also employ independent as well as control variables that have been found relevant to the corporate governance of Indone-sian public firms. These variables include firm size, board size, board meeting frequency, the proportion of independent commissioners on the board, managerial ownership, the proportion of independent commissioners who are from aca-demia, the proportion of independent commis-sioners who have political or military back-ground, the average age of directors and com-missioners, and compensation of directors and commissioners.
Large boards have been found less effective in monitoring (Jensen, 1993; Core et al, 1997; Yermack, 1996). Sun and Zhang (2000) study documents that board size is negatively related to firm performance in China. If a larger board size leads to less effective monitoring, we would expect Tobin's Q to be the negatively related to board size.
Firm size also affects the efficiency of corporate governance. In Indonesia, large com-panies usually have more available resources to employ more competent CEOs and Chairs, and could offer desirable compensation packages to attract top-caliber executives. Furthermore, large firms offer higher social status and influence that might generate various intangible benefits to executives. Cichello (2005) reports that firm size is a key factor in determining the pay-perform-ance sensitivity. Dalton et al., (1999) also find a positive relation between firm size and firm per-formance. Therefore, we expect that large firms in general have better performance than do small firms.
Board meeting frequency has been identified as an important dimension of board mechanisms. However, whether high board meeting frequency is favorable to firm performance remains unde-termined due to mixed evidence. Lipton and Lorsch (1992) suggest that the most widely shared problem faced by directors is the lack of time to carry out their duties. Similarly, Conger
et al., (1998) suggest that board meeting is an important resource to improve the effectiveness of the board. An implication of those findings is that directors that meet more frequently are more likely to perform their duties in line with shareholders’ interests. However, based on a sample of Fortune 500 firms, Vafeas (1999) documents that the annual number of board meetings is inversely related to firm value, although he further finds that operating perform-ance improves following the years of abnormal board activity. Public firms in Indonesia are still at the development stage; hence, for those com-missioners without accumulated experiences in running or supervising a company, we expect conjecture that board meeting frequency is posi-tively related to firm performance.
Managerial ownership is another factor deemed important in corporate governance re-search. Chen and Yu (2012) find that ownership structure and corporate governance in emerging markets might lead to a different relationship between managerial ownership and corporate diversification as compared to that documented in developed markets. Palia and Lichtenberg (1999) report that managerial ownership changes are positively related to changes in productivity where stock markets reward firms with increases in firm value when these firms enhance their productivity. However, Denis and Sarin (1999) find that ownership is weakly related to the changes in firm-specific determinants of owner-ship and board structure. Research on this area generally finds that there is mixed evidence of the significant relation between ownership structure and firm performance. As stock options and other stock-related compensation vehicles are increasingly adopted in Indonesia, we hypo-thesize a positive relation between managerial ownership and firm value.
compensa-tion, and that this plays a part in the underin-vestment problem and the underperformance of firms managed by an older CEO. Older directors and commissioners are usually more experienced and more likely to have gained enormous business skills and wisdom. Therefore, we expect that the older the average age of the board members, the better the firm performance will be.
The next key variable examined is compen-sation. There is a consensus in the extant litera-ture that agency costs need to be minimized in order to enhance shareholder wealth. One of the most effective bonding mechanisms to cope with management’s self-profiting behavior is to set attractive and properly targeted compensation packages. The pay-for-performance concept has been discussed and practiced in the modern cor-porate finance world. According to the con-tracting hypothesis (e.g., Ke et al., 1999), in the corporate world with diffuse ownership, tying executive compensation to firm performance could partly alleviate the agency problems. It is highly expected that by enjoying great incentives linked to performance, executives will give their best effort to strengthen performance and efficiency. However, the reality is that this pol-icy also has its downside. Pay-for-performance design is primarily implemented through stock-based compensation, both direct stock awards and stock options. Although this is a well proven policy in many cases, it has often provided executives with an opportunity to be oriented towards a short-term goal, which is to boost up current performance. For instance, Core et al. (1999) find that firms with a weaker governance structure have greater agency problems, and that CEOs of firms with greater agency problems extract greater compensation. Similarly, Dow and Raposo (2005) reveal that performance-based compensation packages actually could create an incentive to undertake an aggressive and overoptimistic corporate strategy. A study by Burns and Kedia (2006) investigated S&P 1,500 firms that restated their financial reports for the period of 1995-2002. Their study shows that the propensity to restate financial statements (due to misreporting) is positively related to the sensitivity of CEO options to stock price. Inter-estingly, Burns and Kedia (2006) do not find
significant results for other compensation types, such as salary and bonus.
The traditional perspective on the board of commissioners is in favor of independent com-missioners since more independent commission-ers on the board are expected to be able to monitor the management more effectively. Ac-cording to the selecting procedures for pendent commissioners in Indonesia, the inde-pendent commissioners are actually “outside directors.” Peng (2004) shows that outside directors do have a positive effect on firm per-formance during institutional transitions. Klein (1998) finds no significant relation between firm performance and the percentage of insiders on the board as a whole. Huang et al., (2006) also do not find a significant relation between the proportion of independent directors and firm performance for Chinese public firms. Fama and Jensen (1983) argue that outside directors have an incentive to act as conscientious monitors for the management because they want to protect their reputation. Similarly, Weisbach (1988) finds that boards dominated by outsiders are more likely to replace the CEOs than insider-dominated boards. Hence, we conjecture that more independent commissioners on the board serve the firm better than the case where there are fewer independent commissioners.
better understand the detailed financial situation of the firm, and help monitor and advise the management. We expect more independent commissioners from academia, especially with accounting skills, will strengthen the firm performance.
Subsequently, we also examine whether commissioners with political or military back-ground benefit a firm. Tong and Junarsin (2013) find that private firms are more likely to gain benefits from the prevalence of commissioners having political or military background. This is mainly due to the fact that political networks are an invaluable intangible asset. So, we conjecture a positive relation between the proportion of commissioners with political or military back-ground and firm performance in Indonesia.
Our models are formulated as follows:
and with interactions:
FB GovernanceVariables it
t ei,t (2)
where:
FP = firm performance, BS = board size,
BM = number of board meetings, INDEP = proportion of independent
com-missioners on the board, MO = managerial ownership,
ACAD = proportion of commissioners with academic background,
POL = proportion of commissioners with military or political background, AGE = average age of directors and
com-missioners,
COMP = average compensation of directors and commissioners,
FB = a dummy variable for firm's back-ground, taking the value of 1 if private and 0 otherwise,
Size = firm size,
α = subject-specific intercept,
δ = year fixed effect, i = firm i,
t = year t.
Variable definitions are summarized in
Table 2.
Table 2. Variable Definitions
This table lists all variables used in regression analysis.
Variable Definition
Q The sum of book value of debt and market value of equity, then divided by book value of assets
FB Dummy for a listed firm that had been a private firm from inception
Size Total assets
BS Number of commissioners
BM Number of board's annual meetings
Indep Proportion of independent commissioners on the board
MO Managerial ownership (%)
Acad Number of commissioners and directors who have an academia background
Pol Number of commissioners and directors who have political or military backgrounds
Age Average age of directors and commissioners
Comp Total compensation of directors and commissioners
RESULTS
1. Univariate Analysis
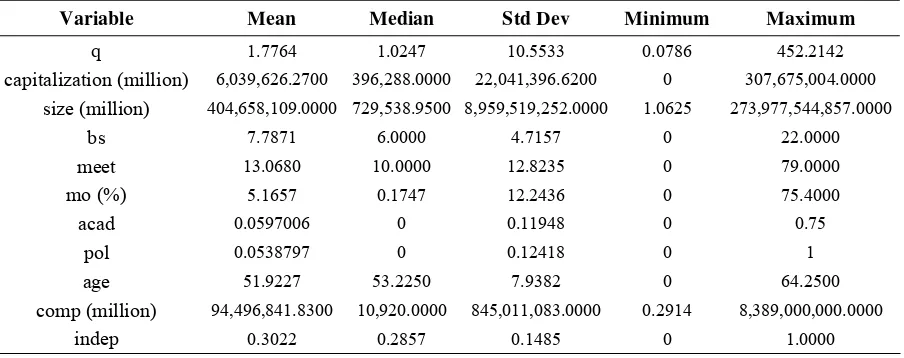
We firstly analyze and show the descriptive statistics of our sample firms. As exhibited in Table 3, Tobin's Q has a mean (median) value of 1.78 and 1.03, respectively. Sample firms have a mean capitalization value of Rp6.04 trillion with median of Rp396.29 billion. In terms of size, our sample firms have Rp404.66 trillion average total assets with median of Rp729.54 billion. On average, sample firms employ eight board mem-bers and meet 13 times annually. Mean propor-tion of independent commissioners on the board is 30.22% with median of 28.57%. Meanwhile, managerial ownership is on average 5.17% with median of 0.17%.
With respect to commissioners' backgrounds, 5.97% of commissioners came from an academia background while 5.39% of them have political or military background. Commissioners are aged 52 on average with median of 53. Total compensation of management and commission-ers are Rp94.50 trillion with median of Rp10.92 billion.
Subsequently, we check for data normality by plainly regressing Q on board size, the num-ber of board meetings, the proportion of inde-pendent commissioners on the board, managerial ownership, the proportion of commissioners with academic background, the proportion of commissioners with military or political back-ground, average age of directors and commis-sioners, average compensation of directors and commissioners, firm background dummy, and
firm size. Residual analysis in an unreported test detects a symptom of non-normality, shown by the Kolmogorov-Smirnov D-stat of 0.1304 which is significant at 5% level. Although we have sufficiently large number of observations, we endeavor to reduce this symptom by trans-forming some variables (i.e., Q, compensation, and firm size) into a logarithmic form. After this transformation, we re-regress log Q on board size, the number of board meetings, the propor-tion of independent commissioners on the board, managerial ownership, the proportion of com-missioners with academic background, the pro-portion of commissioners with military or po-litical background, average age of directors and commissioners, log average compensation of directors and commissioners, firm background dummy, and log firm size. This regression results in the Kolmogorov-Smirnov D-stat of 0.0983 which is now insignificant, indicating that our data have been relatively normal.
This study also checks for multicollinearity problem. In Table 4, we report a regression of log Q on board size, board meetings, board in-dependence, managerial ownership, academic background dummy, military or political back-ground dummy, age, log compensation, firm background dummy, and log firm size. We cal-culate each variable's variance inflation ratio (VIF), which has been widely utilized as a measure for detecting multicollinearity. As shown in Table 4, none of the VIFs is greater than 10, meaning that multicollinearity should not be a concern in our study.
Table 3. Descriptive Statistics
Variable Mean Median Std Dev Minimum Maximum
q 1.7764 1.0247 10.5533 0.0786 452.2142
capitalization (million) 6,039,626.2700 396,288.0000 22,041,396.6200 0 307,675,004.0000
size (million) 404,658,109.0000 729,538.9500 8,959,519,252.0000 1.0625 273,977,544,857.0000
bs 7.7871 6.0000 4.7157 0 22.0000
meet 13.0680 10.0000 12.8235 0 79.0000
mo (%) 5.1657 0.1747 12.2436 0 75.4000
acad 0.0597006 0 0.11948 0 0.75
pol 0.0538797 0 0.12418 0 1
age 51.9227 53.2250 7.9382 0 64.2500
comp (million) 94,496,841.8300 10,920.0000 845,011,083.0000 0.2914 8,389,000,000.0000
indep 0.3022 0.2857 0.1485 0 1.0000
Table 4. Check for Multicollinearity
Dependent Var.: Q
Independent Var. Parameter VIF
Intercept 0.5697 0.000
(0.34)
bs -0.0277 2.604
(-0.65)
meet 0.0027 1.312
(0.55)
indep 1.1472 2.062
(1.33)
mo 0.0003 1.251
(0.03)
acad -0.1376 1.220
(-0.31)
pol 1.9259*** 1.638
(2.87)
age -0.0171 1.447
(-0.66)
lcomp 0.0113 1.352
(0.29)
private 0.4132* 1.926
(1.77)
lassets -0.0336 1.453
(-1.53) N 57
Adj. R2 0.1977
F 2.38** Source: data processed (2013)
2 Multivariate Analysis
We begin our multivariate analysis with a correlation matrix. Table 5 depicts the
correla-tions among variables. As shown, log Q is posi-tively and significantly correlated with manage-rial ownership, and negatively and significantly correlated with the proportion of commissioners with academic background, average of age of commissioners, and firm background dummy.
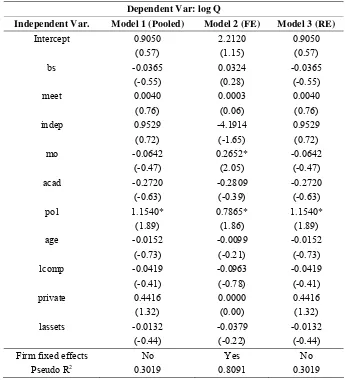
We then run a regression of log Q on our independent variables (i.e., board size, the num-ber of board meetings, the proportion of inde-pendent commissioners on the board, managerial ownership, the proportion of commissioners with academic background, the proportion of commissioners with military or political back-ground, average age of directors and commis-sioners, log average compensation of directors and commissioners, private dummy, and log firm size). All of our regressions utilize the White heteroskedastic-robust standard errors.
Table 6 documents that we do not find many significant relations between firm performance and governance variables in general. We do find, however, that the proportion of commissioners having political or military background is posi-tively and significantly related to firm perform-ance. This indicates that employing commission-ers with political or military background really benefits a firm, most likely due to the advantages of possessing connections or networks with high-ranking government officials and other top businesspeople. The coefficient on MO is also significantly positive, but only in the fixed effects model, implying that a higher percentage
Table 5. Correlations among Variables
lq bs meet indep mo acad pol age lcomp private lassets
lq 1.0000 0.0657 0.0509 0.0009 0.1933 -0.1288 -0.0175 -0.1414 -0.0273 -0.0705 0.0000
bs 1.0000 -0.1287 -0.4580 0.0926 -0.0921 -0.2510 -0.0951 0.2896 -0.2413 0.4069
meet 1.0000 0.1351 -0.0955 0.1719 0.0931 0.0621 -0.0621 -0.3119 0.1571
indep 1.0000 -0.1142 0.2228 0.2612 0.0974 0.0002 0.1312 -0.0806
mo 1.0000 -0.1335 -0.0649 0.0940 -0.1042 0.0965 -0.2442
acad 1.0000 0.0380 0.1111 0.0122 -0.1492 0.1402
pol 1.0000 0.1231 -0.0220 -0.0419 -0.1160
age 1.0000 -0.0094 -0.0961 0.0552
lcomp 1.0000 -0.0696 0.2610
private 1.0000 -0.2145
lassets 1.0000
of managerial ownership tends to improve firm performance.
Meanwhile, our variable of interest, i.e., pri-vate dummy, does not show a significant link to firm performance. There is no evidence that a firm's background, whether it had been a private firm since inception or it was an SOE, could affect its financial performance upon IPO. Hence, we are not able to reject the first null hypothesis that firm performance is independent of firm background.
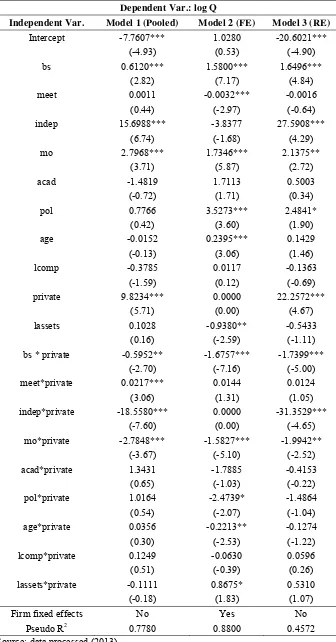
To grasp more comprehensive understanding of the association between firm performance and governance variables, we regress log Q on all previously employed independent variables, but this time we include the interactions between private dummy and all other predictor variables.
Table 7 reports some compelling results. Board size is found to have a positive and
significant relation with firm performance of previously SOE firms. However, this positive relation disappears and even becomes signifi-cantly negative for previously private firms. Accordingly, more commissioners hired benefit previously SOE firms but not previously private firms.
Our findings indicate that firm performance is negatively related to the number of board meetings for previously SOE firms, but this re-lation is only significant in the fixed effects model. On the other hand, firm performance of previously private firms has a positive link with firm performance, although it is only significant in the pooled model. Board meetings are indeed more needed by previously private firms, but could be counterproductive for previously SOE firms.
Table 6. Private Dummy Regressions
Dependent Var: log Q
Independent Var. Model 1 (Pooled) Model 2 (FE) Model 3 (RE)
Intercept 0.9050 2.2120 0.9050
(0.57) (1.15) (0.57)
bs -0.0365 0.0324 -0.0365
(-0.55) (0.28) (-0.55)
meet 0.0040 0.0003 0.0040
(0.76) (0.06) (0.76)
indep 0.9529 -4.1914 0.9529
(0.72) (-1.65) (0.72)
mo -0.0642 0.2652* -0.0642
(-0.47) (2.05) (-0.47)
acad -0.2720 -0.2809 -0.2720
(-0.63) (-0.39) (-0.63)
pol 1.1540* 0.7865* 1.1540*
(1.89) (1.86) (1.89)
age -0.0152 -0.0099 -0.0152
(-0.73) (-0.21) (-0.73)
lcomp -0.0419 -0.0963 -0.0419
(-0.41) (-0.78) (-0.41)
private 0.4416 0.0000 0.4416
(1.32) (0.00) (1.32)
lassets -0.0132 -0.0379 -0.0132
(-0.44) (-0.22) (-0.44)
Firm fixed effects No Yes No
Pseudo R2 0.3019 0.8091 0.3019
Table 7. Regressions with Interaction Variables
Dependent Var.: log Q
Independent Var. Model 1 (Pooled) Model 2 (FE) Model 3 (RE)
Intercept -7.7607*** 1.0280 -20.6021***
(-4.93) (0.53) (-4.90)
bs 0.6120*** 1.5800*** 1.6496***
(2.82) (7.17) (4.84)
meet 0.0011 -0.0032*** -0.0016
(0.44) (-2.97) (-0.64)
indep 15.6988*** -3.8377 27.5908***
(6.74) (-1.68) (4.29)
mo 2.7968*** 1.7346*** 2.1375**
(3.71) (5.87) (2.72)
acad -1.4819 1.7113 0.5003
(-0.72) (1.71) (0.34)
pol 0.7766 3.5273*** 2.4841*
(0.42) (3.60) (1.90)
age -0.0152 0.2395*** 0.1429
(-0.13) (3.06) (1.46)
lcomp -0.3785 0.0117 -0.1363
(-1.59) (0.12) (-0.69)
private 9.8234*** 0.0000 22.2572***
(5.71) (0.00) (4.67)
lassets 0.1028 -0.9380** -0.5433
(0.16) (-2.59) (-1.11)
bs * private -0.5952** -1.6757*** -1.7399***
(-2.70) (-7.16) (-5.00)
meet*private 0.0217*** 0.0144 0.0124
(3.06) (1.31) (1.05)
indep*private -18.5580*** 0.0000 -31.3529***
(-7.60) (0.00) (-4.65)
mo*private -2.7848*** -1.5827*** -1.9942**
(-3.67) (-5.10) (-2.52)
acad*private 1.3431 -1.7885 -0.4153
(0.65) (-1.03) (-0.22)
pol*private 1.0164 -2.4739* -1.4864
(0.54) (-2.07) (-1.04)
age*private 0.0356 -0.2213** -0.1274
(0.30) (-2.53) (-1.22)
lcomp*private 0.1249 -0.0630 0.0596
(0.51) (-0.39) (0.26)
lassets*private -0.1111 0.8675* 0.5310
(-0.18) (1.83) (1.07)
Firm fixed effects No Yes No
Pseudo R2 0.7780 0.8800 0.4572
Source: data processed (2013)
Subsequently, board independence is posi-tively and significantly related to firm perform-ance of previously SOE firms. However, this relation turns out to be negative for previously private firms. Thus, a higher proportion of inde-pendent variables on the board of commissioners benefits previously SOE firms, but is less useful for previously private firms. This is probably because previously SOE firms had been influ-enced by and run on the basis of a government-style business model, which is inefficient and collusion-prone, thus requiring a more inde-pendent board upon their IPOs. On the other hand, previously private firms had been enjoying a professional management style even before going public such that adding more independent commissioners would not help much.
The link between firm performance and managerial ownership is positive and significant for both previously SOE firms and previously private firms. Nevertheless, this relation is much less positive for previously private firms. Meanwhile, firm performance of previously SOE firms is positively linked to the proportion of commissioners with political or military background. This relation is less positive for previously private firms, as evidenced by a negative coefficient on the interaction between POL and PRIVATE (but not negative enough to turn the positive coefficient on POL variable). Therefore, this result substantiates the finding in Table 6 that hiring commissioners with political or military background is beneficial to a firm.
Another finding indicates that older board members contribute positively to previously SOE firms. In addition, they also lead to higher firm performance of previously private firms but at a much lower magnitude. Overall, our find-ings as reported in Table 7 corroborate our con-jecture that there are differences in corporate governance characteristics between previously SOE firms and previously private firms.
CONCLUSION
This study purports to test two governance issues in Indonesian listed firms. To explore corporate governance mechanisms in Indonesia, we ought to understand that listed firms on the
Indonesian capital market came from two initial business backgrounds: (1) private firms, which had been private businesses before going public; and (2) badan usaha milik negara (state-owned enterprises, henceforth SOEs), which were owned by the Indonesian government and man-aged by government-appointed management. Although both types of the firms have gone public, their differences might remain intact, such as differences in size, lines of business, market share, and the efficiency of corporate governance.
We find that the relation between govern-ance characteristics and firm performgovern-ance do differ for previously private firms as compared with that for previously SOE firms. Board size is positively and significantly related to firm per-formance of previously SOE firms. However, this positive relation disappears and even be-comes significantly negative for previously pri-vate firms.
Our findings indicate that firm performance is negatively related to the number of board meetings for previously SOE firms, but this relation is only significant in the fixed effects model. On the other hand, firm performance of previously private firms has a positive link with firm performance, although it is only significant in the pooled model. Next, board independence is positively and significantly related to firm performance of previously SOE firms. However, this relation turns out to be negative for previ-ously private firms. Thus, a higher proportion of independent variables on the board of commis-sioners benefits previously SOE firms, but is less useful for previously private firms. This is probably because previously SOE firms had been influenced by and run on the basis of a government-style business model, which is inef-ficient and collusion-prone, thus requiring a more independent board upon their IPOs. On the other hand, previously private firms had been enjoying a professional management style even before going public such that adding more inde-pendent commissioners would not help much.
private firms. Nevertheless, this relation is much less positive for previously private firms. Mean-while, firm performance of previously SOE firms is positively linked to the proportion of commissioners with political or military back-ground. This relation is less positive for previ-ously private firms, as evidenced by a negative coefficient on the interaction between POL and PRIVATE (but not negative enough to turn the positive coefficient on POL variable). Therefore, this result substantiates the finding in Table 6 that hiring commissioners with political or mili-tary background is beneficial to a firm.
Another finding indicates that older board members contribute positively to previously SOE firms. In addition, they also lead to higher firm performance of previously private firms but at a much lower magnitude. Overall, our find-ings as reported in Table 7 corroborate our con-jecture that there are differences in corporate governance characteristics between previously SOE firms and previously private firms.
REFERENCES
Ang, James S., Constand, and Richard L., 1997. “Compensation and performance: the case of Japanese managers and directors.” Jour-nal of MultinatioJour-nal Financial Manage-ment, 7, 275-304.
Bebchuk, L. A. and Cohen, A., 2005. “The costs of entrenched boards”. Journal of Financial Economics, 78, 409-433.
Burns, Natasha., Kedia, and Simi, 2006. “The impact of performance-based compensation on misreporting.” Journal of Financial Eco-nomics, 79, 35-67.
Chen, Chiung-Jung., and Yu, Chwo-Ming Joseph, 2012. “Managerial ownership, di-versification, and firm performance: Evi-dence from an emerging market”. Interna-tional Business Review, 21, 518-534.
Cichello, M., 2005. “The impact of firm size on pay-performance sensitivities”. Journal of Corporate Finance, 11, 609-627.
Claessens, Stijn., Simeon, Djankov., Fan, Joseph P.H., Lang, and Larry H.P., 2002. “When does corporate diversification matter to
pro-ductivity and performance? Evidence from East Asia”. Pacific-Basin Finance Journal,
11,365-392.
Conger, J., Finegold, D., and Lawler, E., 1998. “Appraising boardroom performance”.
Harvard Business Review, 76, 136-148. Core, J., Holthausen, R., and Larcker, D., 1999.
“Corporate governance, chief executive officers compensation, and firm perform-ance”. Journal of Financial Economics, 51, 371-406.
Dalton, Dan R., Daily, Catherine M., Johnson, Jonathan L., and Ellstrand, 1999. “Number of Directors and Financial Performance: A Meta-Analysis”. The Academy of Manage-ment Journal, 42, 674-686.
Denis, D., and Sarin, A., 1999. “Ownership and board structures in publicly traded corpora-tions”. Journal of Financial Economics, 52, 187-224.
Faleye, O., 2007. “Classified boards, firm value, and managerial entrenchment”. Journal of Financial Economics, 83, 501-529.
Fan, J. P., Wong, T. J., and Zhang, T., 2007. “Politically-connected CEOs, corporate governance and post-IPO performance of China’s partially privatized firms”. Journal of Financial Economics, 84, 330-357. Jiraporn, Pornsit., Kim, Young Sang., Davidson,
Wallace N., and Singh, Manohar, 2006. “Corporate governance, shareholder rights and firm diversification: An empirical analysis.” Journal of Banking & Finance, 30, 947-963.
Ke, Bin., Petroni, Kathy., and Safieddine, Assem, 1999. “Ownership concentration and sensitivity of executive pay to ac-counting performance measures: Evidence from publicly and privately-held insurance companies”. Journal of Accounting and Economics, 28,185-209.
Klein, April., 1998. “Firm Performance and Board Committee Structure”. Journal of Law and Economics, 41, 275-304. The University of Chicago Press.
“Tobin's q, Corporate Diversification, and Firm Performance”. Journal of Political Economy, 102, 1248-1280, The University of Chicago Press.
Lehn, K., Patro, S., and Zhao, M, 2007. “Governance indexes and valuation: Which causes which?” Journal of Corporate Fi-nance, 13, 907-928.
Lipton, M., and Lorsch, J. W., 1992. “A Modest Proposal for Improved Corporate Govern-ance”. The Business Lawyer, 48,59-77. Nam, S. W., and Nam, I. C., 2004. “Corporate
Governance in Asia: Recent Evidence from Indonesia, Republic of Korea, Malaysia, and Thailand”, Working paper: Asian De-velopment Bank Institute.
Palia, Darius., and Lichtenberg, Frank., 1999. “Managerial ownership and firm perform-ance: A re-examination using productivity measurement”. Journal of Corporate Fi-nance, 5, 323-339.
Peng, Mike W., 2004. “Outside Directors and Firm Performance During Institutional Transitions”. Strategic Management Jour-nal, 25, 453-471. Fisher College of Busi-ness, The Ohio State University, Columbus, Ohio, U.S.A.
Serfling, Matthew A., 2012. CEO Age, Underin-vestment, and Agency Costs. Eller College of Management: University of Arizona Tucson.
Shleifer, A., and Vishny, R., 1997. “A survey of Corporate Governance”. Journal of Fi-nance, 52, 737-783.
Tong, S., and Junarsin, E., 2013. “A comparison of Chinese state-owned enterprise firm’s boards and private firm’s boards”, Working paper, Central University of Finance and Economics and Universitas Gadjah Mada.
Vafeas, N., 1999. “Board meeting frequency and firm performance”. Journal of Financial Economics, 53, 113-142.
Vafeas, Nikos., 1999. “Board meeting frequency and firm performance”. Journal of Finan-cial Economics, 53, 113-142.
Wang, M., and Shao, G., 2007. “The empirical analysis on blockholder ownership”. Jour-nal of Financial Research (Chinese), 2, 133-145.
Wei, Z., Xie, F., and Zhang, S., 2005. “Owner-ship structure and firm value in China’s privatized firms: 1991-2001”. Journal of Financial and Quantitative Analysis, 40, 87-108.
Wernerfelt, Birger., and Montogomery, Cyinthia A., 1988. “Tobin's q and the Importance of Focus in Firm”. American Economic Asso-ciation, 78, 246-250. American Economic Association.
Yermack, D., 1996. “Higher market valuation of companies with a small board of directors”.