*Corresponding author:
E-mail: [email protected]
Available online at htp://medpet.journal.ipb.ac.id/
Botanical Composition, Grass Production, and Carrying Capacity of Pasture in Timor
Tengah Selatan District
V. E. Se’ua, P. D. M. H. Kartib,*, & L. Abdullahb
aStudy Program of Nutrition and Feed Science, Faculty of Animal Science, Graduate School,
Bogor Agricultural University
bDepartment of Nutrition and Feed Technology, Faculty of Animal Science, Bogor Agricultural University
Jalan Agatis, Kampus IPB Darmaga Bogor 16680, Indonesia (Received 28-05-2015; Reviewed 29-06-2015; Accepted 24-08-2015)
ABSTRACT
This study was conducted to analyze the botanical composition, grass production, carrying capac-ity, and potential production of nutrients in pasture located in Timor Tengah Selatan Regency. The experiment was conducted from February to July 2013, using ield survey method. The botanical com -position, grass production and carrying capacity on real condition were analyzed descriptively, while the grass production and carrying capacity based of cuting arrangement were analyzed by using ran -domized block factorial design with 3 altitude locations (Sub District of Mollo Utara with altitude of 1007 m above sea level; Sub District of Noebeba, 500 m ASL, and Sub District of Amanuban Selatan, 65 m ASL) x 2 cuting intervals (1 and 2 month) and 5 replications. The results showed that the grass type dominated the pasture in the Sub District of Mollo Utara, while legum type was more dominant in the pasture in the Sub Districts of Noebeba and Amanuban Selatan. The potential production of dry mat -ter grass in Timor Tengah Selatan Regency based on real condition was 150 to 390 kg/ha/yr, this could accommodate 0.24 to 0.63 AU/ha/yr. The arrangement of cuting interval by 1 month in Mollo Utara and 2 months in Noebeba and Amanuban Selatan could increase (P<0.05) grass production and carry -ing capacity. The potential productions of grass nutrients were higher in Sub District of Mollo Utara, while potential production of grass dry mater was higher in Sub Districts of Noebeba and Amanuban Selatan. It was concluded that grass dry mater potential production and carrying capacity in Timor Tengah Selatan Regency were low. The arrangement of cuting interval could increase grass dry mater potential production, carrying capacity, nutrition production, and quality of nutrition.
Key words: carrying capacity, grass, pasture, Timor Tengah Selatan
ABSTRAK
Penelitian ini bertujuan untuk menganalisis komposisi botani, produksi rumput, kapasitas tampung dan produksi nutrisi rumput pada padang penggembalaan di Kabupaten Timor Tengah Selatan. Penelitian dilaksanakan bulan Februari sampai Juli 2013, menggunakan metode survei lapang. Variabel komposisi botani, potensi produksi bahan kering rumput, dan kapasitas tampung pada kondisi riil, serta potensi produksi nutrisi rumput dianalisis secara deskriptif, sedangkan produksi rumput dan kapasitas tampung berdasarkan pengaturan pemotongan dianalisis menggunakan rancan-gan acak kelompok pola faktorial, yaitu 3 lokasi denrancan-gan ketinggian berbeda x 2 interval pemotong-an dengpemotong-an 5 ulpemotong-angpemotong-an. Hasil menunjukkpemotong-an bahwa rumput mendominasi padpemotong-ang penggembalapemotong-an di Kecamatan Mollo Utara, sedangkan leguminosa mendominasi padang penggembalaan di Kecamatan Noebeba dan Amanuban Selatan. Produksi rumput pada kondisi riil di Kabupaten Timor Tengah Selatan sebanyak 150-390 kg/ha/thn dapat menampung 0,24-0,63 ST/ha/thn. Pengaturan pemotongan dengan interval pemotongan 1 bulan di Kecamatan Mollo Utara, 2 bulan di Kecamatan Noebeba dan Amanuban Selatan dapat meningkatkan (P<0,05) produksi rumput dan kapasitas tampung. Potensi produksi nutrisi rumput tertinggi terdapat di Kecamatan Mollo Utara, sedangkan potensi produksi bahan kering rumput tertinggi di Kecamatan Noebeba dan Amanuban Selatan. Disimpulkan bahwa produksi rumput dan kapasitas tampung di Timur tengah Selatan adalah rendah. Kondisi pengaturan pemotongan dapat meningkatkan produksi, kapasitas tampung, dan kualitas nutrisi rumput.
INTRODUCTION
The activities of catle, horses and goats farming
have been widely applied by the community that are
scatered in several regions in Indonesian, especially
communities in Timor Tengah Selatan District, East Nusa Tenggara Province. Timor Tengah Selatan District is one of the districts in East Nusa Tenggara Province
that has many populations of Bali catle, horse, and goat. The populations of Bali catle, horse, and goat in East
Nusa Tenggara Province were 185,021, 698, and 42,610 heads, respectively, with 832,288 ha pasture area (BPS,
2014). The district has population growth of Bali catle
by 4.0%-5.6%.
Timor Tengah Selatan has tropic climate and gener-ally changes every year. The dry season (seven months)
is longer than rainy season (ive months). Geographical
location of Timor Tengah Selatan District is closer to Australia continent than to Asia leading to a lower rainfall. The number of rainy days is high in December and the highest rainfall is occurred in January, while the lowest rainfall is occurred in September. Timor Tengah Selatan District has rainfall of 1,532.15 mm with rainy days as much as 91 d (BPS, 2014). Timor Tengah
Selatan District consists of some areas with diferent
topographies including the Sub Districts of Mollo Utara, Noebeba, and Amanuban Selatan. Sub district of Mollo Utara is in the Mutis Mountains, Sub District of Noebeba area is on the outskirts of the Oebaki and Noesaha Rivers, while Sub District of Amanuban Selatan is near the Oetune beach. Those three
sub-districts have wide area of pastures, therefore the catle
population in this region can be increased easily. This potential is related to the availability of land for forage production and carrying capacity of pastures.
An extensive system in pasture is applied during
ruminant animals are grass family (Gramineae) and
legume (Leguminoceae). The problem of domestic forage
is its low productivity and nutrient content and limited development (Salendu & Elly, 2012), whereas the opti-mization of forage potential is important for continuous
supply of the forage (Tola et al., 2007). For this purpose,
this study was conducted to analyze the botanical
composition, grass dry mater production potential, car -rying capacity as well as the nutrition production and quality of nutrition in the supplying of domestic forage in Timor Tengah Selatan to support the sustainability development of ruminant livestock.
MATERIALS AND METHODS
This research was conducted in February to July 2013 in the Sub Districts of Mollo Utara, Noebeba and Amanuban Selatan in Timor Tengah Selatan District. The location of the research was determined
purpo-sively (purposive sampling). This area has diferent
altitudes and topographies but the vegetation is homog-enous and has the potential to supply domestic forage for animal feed.
Sampling method used in the study was Cluster Random Sampling by using the equation (Som, 1996):
n= N / (1 + Ne2)
where: N= total farmers, e= error (10%), n= total sample.
Numbers of respondents were 94 farmer families from nine villages in three sub-districts from whom
the information regarding farmer, number of catle, and forage supply paterns were obtained by using
questionnaires.
Data Collection
Data collection consisted of primary and
second-ary data. Primsecond-ary data were obtained from the ield observations and interviews. The ield observation
was conducted in pasture, while the interviews were conducted by using a questionnaire for 94 respondents from Sub Districts of Mollo Utara, Noebeba, and Amanuban Selatan. Secondary data were literature data from Livestock Agencies and Central Bureau of Statistics of Timor Tengah Selatan District.
Production of herbarium and forage identiication. Pro-duction of forage herbarium used Stone method (Stone,
1983). Forage identiication (Quatrocchi, 2006) was used
to identify the physical characteristics and compare them
with relevant literature to ind the scientiic name of for -age.
Data Analysis
Botanical composition analysis. Botanical composition analysis was conducted on pasture by observing the
spe-cies in each plots with size 1 x 1 m2 as many as 10 plots
in each location. The forage species contained in the plots was observed and recorded which consisted of three
ranks. All ranks were not fully illed, so that the number of ranks was diferent, therefore each rank was multi -plied by 8.04 : 2.41 : 1.0 constant to calculate the
percent-age of botanical composition of each species (Mannetje &
Haydock, 1963).
Potential production of grass dry mater and carrying capacity analysis based on real conditions. The frame was thrown 30 times per pasture. The forages in the frame were cut as high as 5 cm from the land surface and weighed. The procedures to count forage production
(ton/m2) and carrying capacity used the method of Halls
et al. (1964):
1. Weighing of grass dry mater production of 1 m2
area.
2. Proper Use Factor (PUF 70%) based on the level of grazing and soil erosion rates.
3. Calculation of the grass dry mater production avail
-able (kg/m2)= grass dry mater production of 1 m2 x
PUF (70%).
graz-ing durgraz-ing the 30 d (s). Voisin constants approach of using formula (y-1) s)= r = 3.3, meaning in 1 ha
of land can accommodate 3.3 heads of mature catle
consuming 40 kg/d at the level of heavy grazing. 5. Calculation of the livestock consumption needs (kg/
AU)= (6.29 kg x 30 d) / 1000.
6. Calculation of the land area needs per month (ha/
AU)= consumption needs / grass dry mater produc -tion available.
7. Calculation of the land area needs per year (ha/AU/ yr)= land area needs per month x Voisin constant. 8. Calculation of the carrying capacity (AU/ha/yr)=
Standard unit of mature catle / land area needs per
year.
Potential production of grass dry mater and carrying capacity analysis based on cuting arrangement. Obser-vations were carried out on pasture by making 10 plots
with a size of 1 x 1 m2 in each sub district and fenced to
prevent livestock from grazing. Furthermore cuting all
types of grass as high as 5 cm above ground level and weighing grass that was in the plot. Calculation was
con-ducted on the grass dry mater production potential and carrying capacity based on cuting interval by Halls et al. (1964):
1. Weighing of grass dry mater production of 1 m2
area.
2. Proper Use Factor (PUF 70%) based on the level of grazing and soil erosion rates.
3. Calculation of grass dry mater production avail -able in the dry season and the rainy season (kg/ha)=
grass dry mater production of 1 m2 (kg/ha) x PUF
(70%) x 1000.
4. Calculation of requirement of livestock
consump-tion (kg/AU)= 6.29 kg x number of days cuting
interval.
5. Calculation of carrying capacities (AU/ha/yr)=
Grass dry mater production available / livestock
consumption needs
The experimental design used in the analysis of forage production potential and carrying capacity by
the cuting arrangement was a 3 x 2 factorial random
-ized block design with 5 replications. The irst factor
was the altitude of the location, namely: Sub District of Mollo Utara with altitude of 1,007 m above sea level; Sub District of Noebeba with altitude of 500 m above sea level, and Sub District of Amanuban Selatan with altitude of 65 m above sea level. The second factor was
the cuting interval, namely: 1 month and 2 month. The
data were analyzed by analysis of variance ANOVA,
and when a signiicant efect of treatment was found,
Duncan’s Multiple Range Test was used to determine
the signiicant diference among means values (Steel &
Torrie, 1993).
Analysis of the grass nutrition production and qual-ity of nutrition. The grass samples were taken from the three sub districts and analyzed by proximate analysis
(AOAC, 2005) and Van Soest (Tillman et al., 1983). The
results obtained were analyzed descriptively.
RESULTS AND DISCUSSION
General Condition of the Research Area
Timor Tengah Selatan District has an area of about
3,955.36 km2 and consists of 32 sub districts and 228
vil-lages. Approximately 90.83% of these sub districts are mountainous areas (BPS, 2014). Sub District of Mollo Utara is a region in the Mutis Mountains with altitude of 1,007 m above sea level. The average air temperature
was 20-24oC with a rainfall of 2,713.4 mm and 129 days
of rain. Sub District of Noebeba is near the Oebaki and Noesaha Rivers with a height of 500 m above sea level,
the average air temperature is 31-34oC with a rainfall of
665 mm and 55 days of rain, while Amanuban Selatan Sub Distric is near the Oetune beach with a height of 65 m above sea level. The average air temperature is
34-39oC with a rainfall of 665 mm and 55 days of rain.
Based on the data obtained, the education of the
respon-dents was very diverse namely, elementary, junior high,
and high school. Most of the respondents work as farm-ers (98.9%). The average income of the respondents was 500,000 rupiahs per month and it depends on the sale of agriculture or livestock products.
Timor Tengah Selatan District had the highest
population of Bali catle (61.7%) compared with horses and goats. Catle identiication used ear tag and spe
-Catle houses were not far from home and close to farm
land, so that the animals can utilize the agricultural products. Farmers utilized domestic grass that grew
around the ields and gardens as animal feed. The type of feed utilization in the region was very diferent as inluenced by the level of feed availability (Rusdin et al., 2009).
Botanical Composition
The botanical composition of forage in Timor Tengah Selatan District is presented in Table 2. The percentage of botanical composition in the Sub District of Mollo Utara consisted of 73.27±10.25% of grass and
pasture was not constant; it was inluenced by climate,
The quality of the pasture closely related to the botanical composition of the pasture (Junaidi & Sawen, 2010).
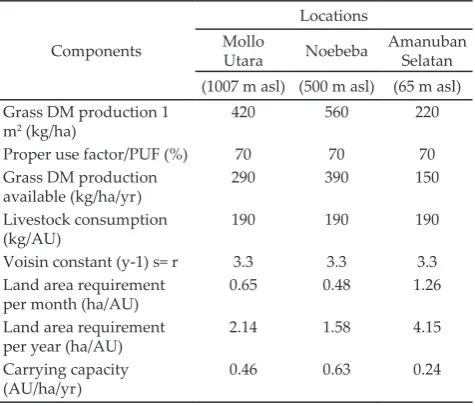
Potential Production of Grass Dry Mater and Carrying Capacity Analysis Based on Real Conditions
Based on Table 3, Sub District of Noebeba had the
highest availability of grass dry mater production (390
kg/ha). Determination of Proper Use Factor (PUF) value
was based on the observations of wrench in each plot by observing the level of grazing, slope, type of soil, type of climate, and soil conditions. Based on the data
obtained, the highest grass dry mater production was
available in the Sub District of Noebeba as much as 390
kg/ha/yrthat could accommodate as many as 0.63 AU/
ha/yr. Grass dry mater production available in the Sub
District of Mollo Utara was 290 kg/ha/yr that could accommodate as many as 0.46 AU/ha/yr, while grass
dry mater production available in the Sub District of
Amanuban Selatan was very low i.e., 150 kg/ha/yr that
was only able to accommodate as many as 0.24 catle/ ha/yr. The number of catle population in the three
sub-districts (Table 1) was higher as compared to the grass
dry mater production available (Table 3) resulting in an
overgrazing. According to Susetyo (1980), the capacities of rangelands in Timor ranged from 0.70-4.60 AU/ha/ yr. The decrease in the quality and quantity of forage in Timor was due to the fewer number of rainy days, and the damage of the pasture caused by stamping of livestock (Jones & Lefeuvre, 2006). In addition, the slope topography of the site caused nutrient leaching during
rainy season (Njurumana et al., 2008).
Potential Production of Grass Dry Mater and Carrying Capacity Analysis Based on Cuting Arrangement
The available production of grass dry mater and carrying capacity based on cuting arrangement in
Timor Tengah Selatan District are presented in Table 4,
5, 6, and 7. There was no signiicant interaction (P>0.05) between the location and cuting intervals for grass dry mater production available during rainy season. Location and cuting interval signiicantly afected grass dry mater production available during rainy season
(P<0.05). Mollo Utara Sub District produced a
sig-niicantly higher (P<0.05) grass dry mater than Noebeba and Amanuban Selatan Sub Districts. This diference was caused by the diferences in altitude, temperature,
rainfall, land type, forage type, and livestock numbers (Herawati & Miranti, 2012) as well as the level of pas-ture, variation of soil moispas-ture, grassland management,
and stocking rate (Nunez et al., 2007). Grass cuting
conducted in February-March with a rainfall amounted to 946.9 mm (BPS, 2014) caused an unbalance and decreased production of forage quantity and quality
(Lambert, 2007; Hariadi, 2008). Grass dry mater produc
-tion available with the cuting intervals of a month was
lower as compared to that available with the 2-month
Note: *) BPS (2014), **) Calculation of animal units= Population of livestock x standard of mature animal unit (catle and horse= 1, goat= 0.16). Type
Populations of mature livestock
Mollo Utara Noebeba Amanuban Selatan
Mature*) Animal unit**) Mature*) Animal unit**) Mature*) Animal unit**)
Catle 10,658 10,658.00 5,866 5,866.00 14,659 14,659.00
Horse 78 78.00 0 0.00 11 11.00
Goat 783 125.28 1,281 204.96 3,241 518.56
Total 11,519 10,861.28 7,147 6,070.96 17,911 15,188.56
Table 1. The populations of livestock in the Sub Districts of Mollo Utara, Noebeba, and Amanuban Selatan (head)
Note: asl= above sea level.
Location Botanical composition (%)
Grass Legume Weeds
Mollo Utara (1,007 m asl)
73.27±10.25 7.10±3.71 19.63±6.67
Noebeba (500 m asl) 64.51± 6.08 20.23±4.28 15.26±3.33 Amanuban Selatan
(65 m asl)
63.98± 6.33 23.46±2.77 12.56±2.73 Table 2. Botanical composition of forage in Timor Tengah
Se-latan District
Note: DM= dry mater; asl= above sea level. Components
Locations Mollo
Utara Noebeba
Amanuban Selatan (1007 m asl) (500 m asl) (65 m asl) Grass DM production 1
m2 (kg/ha)
420 560 220
Proper use factor/PUF (%) 70 70 70
Grass DM production available (kg/ha/yr)
290 390 150
Livestock consumption (kg/AU)
190 190 190
Voisin constant (y-1) s= r 3.3 3.3 3.3
Land area requirement per month (ha/AU)
0.65 0.48 1.26
Land area requirement per year (ha/AU)
2.14 1.58 4.15
Carrying capacity (AU/ha/yr)
0.46 0.63 0.24
cuting interval. This diference was due to the longer
period required by the grass to rest and regrowth.
There was no signiicant interaction (P>0.05) between the location and cuting intervals for carrying capacity during rainy season. Location and cuting inter
-val signiicantly afected carrying capacity (P<0.05). This diference was due to the diferences in the altitude and cuting intervals, so that the carrying capacity in Mollo
Utara Sub District was 1.29±0.21 AU, and in Noebeba Sub District was 1.31±0.38 AU, and in Amanuban Selatan Sub District was 0.83±0.24 AU. According to Damry (2009), the ideal carrying capacity was 2.50 AU/
ha/yr, and when the cuting interval seting was a month
the carrying capacity was 1.34±0.30 AU that was higher
than 0.95±0.25 AU when the cuting interval seting was
2 months. According to Setyanti et al. (2013), the
carry-ing capacity is afected by the type of grass, rainfall, the
type of soil, and the ability of the grass to regrThere was
no signiicant interaction efect (P>0.05) between the lo
-cation and cuting intervals on grass dry mater produc
-tion available during dry season. Loca-tion and cuting interval signiicantly afected grass dry mater produc -tion available (P<0.05). Amanuban Selatan and Mollo
Utara Sub Districts had signiicantly higher (P<0.05) grass dry mater production available as compared to Noebeba Sub District. This diference was caused by the
Note: *Means in the same column with diferent superscripts difer signiicantly (P<0.05). **Means in the same raw with diferent superscripts difer signiicantly (P<0.05). asl= above sea level.
Cuting intervals Mollo Utara Locations Average*
(1,007 m asl)
Noebeba (500 m asl)
Amanuban Selatan (65 m asl)
1 Month 270.75± 52.54 298.50±90.19 187.80±48.16 252.35±57.60b
2 Month 492.56± 89.58 391.32±99.30 249.47±65.49 356.78±94.88a
Average** 350.16±112.30a 344.91±65.63a 218.64±43.61b
Table 4. The average of grass dry mater production available (kg/ha/yr) during rainy season
Note: *Means in the same column with diferent superscripts difer signiicantly (P<0.05). **Means in the same raw with diferent superscripts difer signiicantly (P<0.05). asl= above sea level.
Cuting intervals
Locations
Average* Mollo Utara
(1,007 m asl)
Noebeba (500 m asl)
Amanuban Selatan (65 m asl)
1 Month 1.43±0.28 1.58±0.48 1.00±0.26 1.34±0.30a
2 Month 1.14±0.24 1.04±0.26 0.66±0.17 0.95±0.25b
Average** 1.29±0.21a 1.31±0.38a 0.83±0.24b
Table 5. The average of carrying capacity (AU/ha/yr) during rainy season
Note: *Means in the same column with diferent superscripts difer signiicantly (P<0.05). **Means in the same raw with diferent superscripts difer signiicantly (P<0.05). asl= above sea level.
Cuting intervals Mollo Utara Locations Average*
(1,007 m asl)
Noebeba (500 m asl)
Amanuban Selatan (65 m asl)
1 Month 222.95±68.47 181.01±49.09 165.90± 68.46 189.95±29.56b
2 Month 304.67±53.28 215.86±43.28 374.05±114.69 298.19±79.29a
Average** 263.81±57.78a 198.44±24.64b 269.98±147.18a
Table 6. The average of grass dry mater production available (kg/ha/yr) during dry season
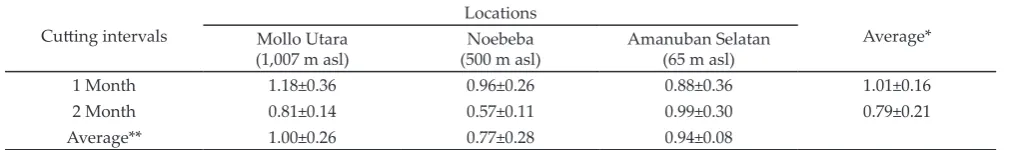
Note: asl= above sea level.
Cuting intervals
Locations
Average* Mollo Utara
(1,007 m asl)
Noebeba (500 m asl)
Amanuban Selatan (65 m asl)
1 Month 1.18±0.36 0.96±0.26 0.88±0.36 1.01±0.16
2 Month 0.81±0.14 0.57±0.11 0.99±0.30 0.79±0.21
Average** 1.00±0.26 0.77±0.28 0.94±0.08
diferences in climate, rainfall, land type, forage type,
livestock numbers, and pastures pressure (Dhalika et al.,
2006; Pebriansyah et al., 2012). Grass cuting conducted
in June-July with rainfall amounted to 969.1 mm (BPS, 2014) caused an unbalance of production and reduced forage quantity and quality (Lambert, 2007; Hariadi,
2008). Grass dry-mater production available with the cuting intervals of a month was lower than that with 2-months interval. This diference was due to the longer
period required by the grass to rest and regrowth.
There was no signiicant interaction efect (P>0.05) between the location and cuting intervals on carrying capacity during dry season. Location and cuting inter
-val did not signiicantly afect carrying capacity during dry season (P>0.05). Carrying capacity in Mollo Utara
Sub District was 1.00±0.26 AU that was higher than that in Amanuban Selatan and Noebeba Sub Districts i.e., 0.94±0.26 AU and 0.77±0.28 AU, respectively. According to Damry (2009), the ideal carrying capacity was 2.50
AU/ha/yr. When the cuting interval seting was
one-month, the carrying capacity was 1.01±0.16 AU that
was higher than 0.79±0.21 AU when the cuting interval seting was 2-month. This diference was afected by the
type of grass, rainfall, soil type, and the ability of the
grass to regrowth (Setyanti et al., 2013).
Grass Nutrition Production and Quality of Nutrition
Nutrient content of grasses cut during the rainy season in Timor Tengah Selatan are presented in Table 8. The highest content of crude protein was found in the
District of Mollo Utara. The diference found in nutri
-ent cont-ent of the grass were inluenced by the genetic variation of species (Hanai et al., 2005; Orr, 2008), dif-ferences of species, varieties, growth phase, land fertil-ity, climatic conditions, and part of the plant (Damry, 2009) as well as the composition of botanical and system
of grazing that are applied. According to Alian et al. (2012), condition of the location, age of harvesting, and
nutrient content of the species afect the quality and
quantity of forage production. Based on the
observa-tion, there were diferent species of forages in three sub
districts. Forage species in Mollo Utara Sub District was
dominated by P. conjugatum Berg, C. aciculatus (Rez.)
Trin, and Cyperus sp. Forage species in Noebeba Sub
District was dominated by H. contortus (L.) Beauv. Ex R.
& S, E. leschenaultiana (Decne.) Ohwi, while forage spe-cies in Amanuban Selatan Sub District was dominated
by E. leschenaultiana (Decne.) Ohwi and H. contortus
(L.) Beauv. ex R. & S. The high diversity of species of grass in the pasture in the Sub District of Mollo Utara
was probably related to a beter soil fertility and species
diversity of grass and forage in this sub-district as com-pared to Noebeba and Amanuban Selatan Sub districts (Junaidi & Sawen, 2010).
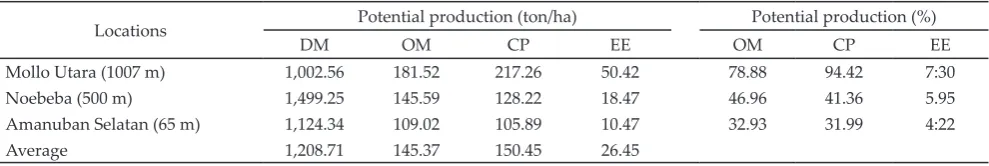
Potential production of dry mater (DM), organic mater (OM), crude protein (CP), and ether extract (EE) during the rainy season with cuting interval of a month
in Timor Tengah Selatan are presented in Table 9.
The average potential production in Timor Tengah Selatan was 1,208.71 ton of DM, 145.37 ton of OM, 150.45 ton of CP, and 26.45 ton of EE (Table 9). The highest pro-duction potential was found in Mollo Utara Sub District that located in hill with high rainfall and low tempera-ture (Mullik & Permana, 2009). In Amanuban Selatan
Sub District, many factors afecting the production
potential were location, wide harvesting age, land
con-dition, rainfall, and nutrition content of forage (Alian
et al., 2012). The low production potential in Amanuban
Selatan Sub District is related to the location near the Oetune beach that has a high temperature with a very low rainfall. Low rainfall causes the decrease in the rate of photosynthesis so that productivity decreases.
The process of photosynthesis will run well when
the availability of nutrients, sunlight, water, and CO2
were fulilled for plants (Setyanti et al., 2013). Forage
Table 9. Grass potential production of dry mater (DM), organic mater (OM), crude protein (CP), ether extract (EE) during rainy season with one-month cuting interval
Locations Potential production (ton/ha) Potential production (%)
DM OM CP EE OM CP EE
Mollo Utara (1007 m) 1,002.56 181.52 217.26 50.42 78.88 94.42 7:30
Noebeba (500 m) 1,499.25 145.59 128.22 18.47 46.96 41.36 5.95
Amanuban Selatan (65 m) 1,124.34 109.02 105.89 10.47 32.93 31.99 4:22
Average 1,208.71 145.37 150.45 26.45
Note: The results of laboratory analysis of Nutrition and Feed Technology-Bogor Agricultural University (2013), asl= above sea level.
Acid detergent iber 51.34 62.50 71.14
Hemicellulosa 29.02 24.71 13.75
Cellulose 36.21 47.91 48.60
Lignin 10.58 11.11 18.16
Table 8. Nutrient content of grass during rainy season with
production potential because of photosynthesis depends dominant in the pasture in the Sub Districts of Noebeba and Amanuban Selatan. Based on the real condition,
grass dry mater potential production and carrying capacity were lower. One-month cuting interval in the Sub District of Mollo Utara and 2 months cuting inter -val in Noebeba and Amanuban Selatan Districts could
increase grass dry mater potential production, carrying
capacity, nutrition production, and quality of nutrition.
REFERENCES
Alian, Y., F. I. Hermansyah, E. Handayanta, Lutojo, & W. P. S. Suprayogi. 2012. Analysis the carrying capacity of ru-minant livestock in the dry season at dry land agricultural area Semin District Gunungkidul Regency. J. Tropical Ani-mal Husbandry. 1:33-42.
Angassa, A., A. Tolera, & A. Belayneh. 2006. The efects of physical environment on the condition of rangelands in Borana. Trop. Grasslands. 40:33-39.
AOAC. 2005. Oicial Methods of Analysis of AOAC Interna -tional. 18th ed. Assoc. Of. Anal. Chem.,Arlington.
BPS. 2014. Timor Tengah Selatan dalam Angka.Badan Pusat Statistik Kabupaten Timor Tengah Selatan.
Damry. 2009. Production and nutrients composition of forages produced from a natural grassland in Lore Utara subdis-trict, Poso district. J.Agroland. 16:296-300.
Dhalika, T., Mansyur, H. K. Mustafa, & H. Supratman. 2006. Proportion of African star grass and sentro in mix pasture system on production and quality of forages. J. Ilmu Ter-nak. 6:163-168.
Halls, L. K., R. H. Hughes, R. L. Rummel, & B. L. Southwel.
1964. Forage and Catle Management in Longleaf-Slaash
Pine Forest. Farmer’s Bulletin, 2119. US Department of Ag-riculture, Washington D.C..
Hall, T. J. & R. W. Walker. 2005. Pasture legume adaptation to six environments of the seasonally dry tropics of north
Queensland. Trop. Grasslands. 39:182-196.
Hanai, N. D., S. Umar, & I. Bachari. 2005. The efect levels of
the shade at various pasture mixtures towards the produc-tion of suitables. J. Agribisnis Peternakan. 1:100-105. Hariadi, B. T. 2008. Carrying capacity of wallaby (Macropus
agilis) at savannah of Mar, Wasur National Park Merauke District. J. Ilmu Peternakan. 3:58-63.
Herawati, T. & Miranti. 2012. Fodder plant for strengthening terrace. J. Pastura. 1:35-38.
Jones, R. J. & R. P. Lefeuvre. 2006. Pasture production, pasture quality and their relationships with steer gains on irrigat-ed, N-fertilised pangola grass at a range of stocking rates in the Ord Valley, Western Australia. Trop. Grasslands. 40:1-13.
Junaidi, M. & D. Sawen. 2010. Botanical variety and carrying capacity of natural pasture at Yapen Regency. J. Ilmu Pe-ternakan.5:92-97.
Kamlasi, Y., M. L. Mullik, & T. O. Damidato. 2014. Pola produksi dan nutrisi rumput kume (Shorgum plumosum var. Timorense) pada lingkungan alamiahnya. J. Ilmu-Il-mu Peternakan. 24:31-40.
Lambert, G. 2007. Pasture management. Trop. Grasslands. 41:216-219.
Lowe, K. F., M. N. Callow, T. M. Bowdler, S. A. Lowe, J. A. White, & N. Gobius. 2009. The performance of irrigated mixtures of tall fescue, ryegrass and white clover in
sub-tropical Australia. 1. The efects of sowing mixture com -binations, nitrogen and oversowing on establishment, productivity, botanical composition and persistence. Trop. Grasslands. 43:4-23.
Mannetje, L. & K. P. Haydock. 1963. The dry weight rank meth-od for the botanical analysis of pasture. J. Brit Grassland Soc. 18:268-275. htp://dx.doi.org/10.1111/j.1365-2494.1963.
tb00362.x
Manu, A. E. 2013. Produktivitas padang penggembalaan sabana Timor Barat. J. Pastura. 3:25-29.
Mullik, M. L. & B. Permana. 2009. Improving growth rate of
Bali catle grazing native pasture in wet season by supple -menting high quality forages. JITV. 14:192-199.
Njurumana, G. N. D., B. A. Victorino, & Pratiwi. 2008. Potency of mamar development as a model of community forest in critical land rehabilitation at Timor Barat. J. Penelitian Hutan dan Konservasi Alam. 5:473-484.
Nunez, P., R. Demanet, F. Matus, & M. L. Mora. 2007. Graz-ing management, ammonia and nitrous oxide emissions: a general view. J. Soil Sc. Plant Nutr. 7:61-99.
Orr, D. M. 2008. Grazing management inluences the dynamics
of populations of Stylosanthes hippocampoides (Oxley ine stem stylo). Trop. Grasslands. 42:193-201.
Pebriansyah, A., P. D. M. H. Karti, & A. T. Permana. 2012. Ef-fect of drought stress and addition of Arbuscula Mycor-rhizal Fungi (AMF) on growth and productivity of tropical grasses (Chloris gayana, Paspalum dilatatum, and Paspalum notatum). J. Pastura. 2:41-48.
Quatrocchi, U. 2006. CRC World Dictionary of Grasses:
Com-mon Names, Scientiic Names, Eponyms, Synonyms, and
Etymology. Taylor & Francis Group, Boca Raton. htp://
dx.doi.org/10.1201/9781420003222
Rusdin., M. Ismail, Mustaring, S. Purwaningsih, A. Andriana, & S. U. Dewi. 2009. Studi potensi kawasan Lore Tengah untuk pengembangan sapi potong. Media Litbang Sult-eng. 2:94-103.
Salendu, A. H. S. & F. H. Elly. 2012. Land utilization under the
coconut tree to forage for catle in North Sulawesi. J. Pas -tura. 2:21-25.
Sawen, D. 2012. Growth of Pennisetum purpureum and Panicum maximumbase on intensity of solar radiation. J. Ilmu Ter-nak dan Tanaman. 2:17-20.
Setyanti, Y. H., S. Anwar, & W. Slamet. 2013. Photosynthesis characteristic and phospor uptake of alfalfa (Medicago sati-va) in diferent defoliation intensity and nitrogen fertilizer. J. Anim. Agric. 2:86-96.
Som, K. R. 1996. Practical Sampling Techniques. 2th ed. Revised
and Expanded. Marcel Dekker Inc., New York.
Stone, B. C. 1983. A Guide to Collecting Pandanaceae (Pan-danus, Freycinetia, Sararanga). Ann. Missouri Bot. Gard. 70:137-140. htp://dx.doi.org/10.2307/2399011
Steel, R. G. D. & J. H. Torrie. 1993. Prinsip dan Prosedur
Statis-tika (Pendekatan Biometrik). Sumantri B, penerjemah. Gramedia Pustaka Utama. Terjemahan dari: The Principle
and Prosedure of Statistics. Jakarta.
Susetyo, S. 1980. PadangPenggembalaan. Bogor Agricultural University. Bogor.
Tillman, A. D., H. Hartadi, S. Reksohadiprodjo, S. Prawiroku-somo, & S. Lebdosoekojo. 1983. Ilmu Makanan Ternak
Dasar. Gadjah Mada University. Yogyakarta.