Drinking Water Quality
This textbook provides a comprehensive review of the problems associated with the supply of drinking water in the developed world. Since thefirst edition of this book was published there have been enormous changes in the water industry, especially in the way drinking water is perceived and regulated. Water companies and regulators have been presented with numerous new challenges–global warming has seriously affected the sustainability of water supplies as well as impacting water quality; advances in chemical and microbial analysis have revealed many new contaminants in water that were previously undetectable or unknown; and recent terrorist attacks have demonstrated how vulnerable water supplies could be to contamination or disruption. This new edition is an overview of the current and emerging problems, and what can be done to solve them. It has been completely updated, and includes the new WHO Revised Drinking Water Guidelines.
Drinking Water Qualityis an ideal textbook for courses in environmental science, hydrology, environmental health, and environmental engineering. It also provides an authoritative reference for practitioners and professionals in the water supply industry.
Drinking Water Quality
Second Edition
N. F. Gray
CAMBRIDGE UNIVERSITY PRESS
Cambridge, New York, Melbourne, Madrid, Cape Town, Singapore, São Paulo
Cambridge University Press
The Edinburgh Building, Cambridge CB2 8RU, UK
First published in print format
ISBN-13 978-0-521-87825-8
ISBN-13 978-0-521-70253-9
ISBN-13 978-0-511-39371-6
© N. F. Gray 1994, 2008
2008
Information on this title: www.cambridge.org/9780521878258
This publication is in copyright. Subject to statutory exception and to the provision of
relevant collective licensing agreements, no reproduction of any part may take place
without the written permission of Cambridge University Press.
Cambridge University Press has no responsibility for the persistence or accuracy of urls
for external or third-party internet websites referred to in this publication, and does not
guarantee that any content on such websites is, or will remain, accurate or appropriate.
Published in the United States of America by Cambridge University Press, New York
www.cambridge.org
paperback
eBook (EBL)
Contents
Preface pagexiii
Acknowledgements xvi
Part I
Introduction to water supply
1 The water business 3
1.1 Introduction 3
1.2 Water consumption 3
1.3 Acceptable water quality 7
1.4 Water utilities 10
1.5 Water conservation 18
1.6 Conclusions 33
References 35
2 Drinking water standards and risk 37
2.1 Introduction 37
2.2 Development of quality standards 37
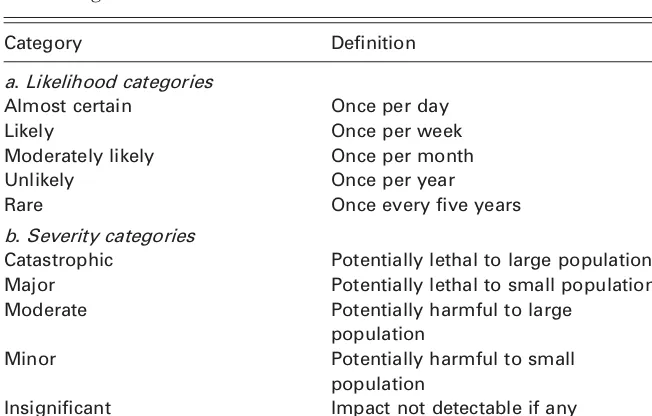
2.3 Risk assessment in the development of health-based targets 39
2.4 Water safety plans 42
2.5 Drinking water standards 52
2.6 Conclusions 63
References 64
3 A quick guide to drinking water problems 65
3.1 Introduction 65
3.2 The problems 66
3.3 Conclusions 72
References 73
Part II
Problems with the resource
4 Sources of water 77
4.1 Introduction 77
4.2 The water cycle 77
4.3 Surface waters: lakes, reservoirs and rivers 80
4.4 Groundwater sources 89
4.5 Other sources of water 99
4.6 Conclusions 112
References 114
5 Nitrate and nitrite 116
5.1 Sources in water 116
5.2 Water quality standards 119
5.3 Effect on consumers 120
5.4 Nitrate in groundwaters 123
5.5 Nitrate in surface waters 125
5.6 Control of high-nitrate water 126
5.7 Conclusions 132
References 134
6 Pesticides and organic micro-pollutants 137
6.1 Organic micro-pollutants 137
6.2 Pesticides 139
6.3 Industrial solvents 156
6.4 Polycyclic aromatic hydrocarbons 160
6.5 Removal of organic contaminants from drinking water 162
6.6 Conclusions 163
References 165
7 Endocrine-disrupting compounds and PPCPs 169
7.1 Introduction and definitions 169
7.2 Pharmaceutical and personal care products (PPCPs) 171
7.3 Oestrogen and fertility 174
7.4 Conclusions 177
References 179
8 Odour and taste 181
8.1 Introduction 181
8.2 Standards and assessment 181
8.3 Classification 183
8.4 Odour-causing substances of natural origin 185
8.5 Man-made odour-causing substances 188
8.6 Conclusions 188
References 189
9 Metals 191
9.1 Iron 191
9.2 Manganese 193
9.3 Arsenic 194
9.4 Other metals 196
9.5 Removal by treatment 198
9.6 Conclusions 199
References 200
10 Hardness and total dissolved solids 203
10.1 Introduction 203
10.2 Chemistry of hardness 203
10.3 Standards 205
10.4 Health aspects 206
10.5 Conclusions 207
References 208
11 Algae and algal toxins 210
11.1 Introduction 210
11.2 Problems associated with algae 210
11.3 Standards 213
11.4 Treatment 213
11.5 Conclusions 214
References 215
12 Radon and radioactivity 217
12.1 Introduction 217
12.2 Radon 218
12.3 Non-radon radionuclides 219
12.4 Standards and treatment 220
12.5 Conclusions 222
References 223
13 Pathogens 225
13.1 Introduction 225
13.2 Protozoa 225
13.3 Viruses 229
13.4 Bacteria 231
13.5 Unusual sources of contamination 235
13.6 Conclusions 237
References 239
Part III
Problems arising from water treatment
14 Water treatment 245
14.1 Introduction 245
14.2 Unit processes 246
14.3 Process selection 260
14.4 How problems arise 261
14.5 Conclusions 267
References 268
15 Aluminium and acrylamide 270
15.1 Aluminium 270
15.2 Acrylamide 277
15.3 Conclusions 278
References 279
16 Odour and taste 282
16.1 Source of odour and taste problems 282
16.2 Removing odours and tastes 283
16.3 Conclusions 285
References 285
17 Fluoridation 286
17.1 Introduction 286
17.2 Fluoride addition 287
17.3 Fluoridation and health 289
17.4 Fluoridation and public opinion 291
17.5 Who is at risk 292
17.6 Conclusions 293
References 295
18 Disinfection by-products 297
18.1 Formation 297
18.2 Standards 300
18.3 Health risks 301
18.4 Prevention of by-product formation 302
18.5 Conclusions 303
References 304
19 Monitoring and removal of pathogens 307
19.1 Introduction 307
19.2 Monitoring pathogens 307
19.3 Measurement and standards 308
19.4 Heterotrophic plate counts 313
19.5 Removal of pathogens 314
19.6 Disinfection 316
19.7 Conclusions 317
References 320
Part IV
Problems arising in the distribution network
20 The distribution network 325
20.1 Introduction 325
20.2 Service reservoirs 325
20.3 Water mains 327
20.4 Service pipes 328
20.5 Conclusions 332
References 333
21 Aesthetic quality 334
21.1 Odour and taste 334
21.2 Discolouration and iron 335
21.3 Sediment and turbidity 338
21.4 Conclusions 340
References 340
22 Asbestos 342
22.1 The nature of asbestos 342
22.2 Health effects and standards 344
22.3 Asbestos cement distribution pipes 345
22.4 Conclusions 346
References 348
23 Coal-tar linings and polycyclic aromatic hydrocarbons 350
23.1 Introduction 350
23.2 Conclusions 351
References 352
24 Animals on tap 353
24.1 Microbial slimes in distribution pipes 353
24.2 Water supplies 355
24.3 Common species and remedial measures 356
24.4 Sampling water mains for animals 361
24.5 Microbial pathogens and invertebrates 362
24.6 Conclusions 363
References 364
25 Pathogens in the distribution system 366
25.1 Introduction 366
25.2 Microbial contamination 366
25.3 Control 369
25.4 Drinking water security 370
25.5 Conclusions 370
References 371
Part V
Problems in household plumbing systems
26 Household plumbing systems 375
26.1 Entry to the home 375
26.2 Plumbing systems 375
26.3 Water Byelaws and regulations 380
26.4 Conclusions 381
References 381
27 Corrosion and metal contamination from pipework
andfittings 382
27.1 Introduction 382
27.2 Corrosion 382
27.3 Lead 387
27.4 Copper 400
27.5 Zinc 403
27.6 Conclusions 403
References 404
28 Micro-organisms,fibres and taste 407
28.1 Micro-organisms in plumbing systems 407
28.2 Fibres, including asbestos 410
28.3 Odour and taste 411
28.4 Conclusions 412
References 413
Part VI
The water we drink
29 Alternatives to tap water 417
29.1 Introduction 417
29.2 Bottled water 417
29.3 Point-of-use water treatment 428
29.4 Water harvesting 436
29.5 Conclusions 438
References 441
30 Water security in the twenty-first century 442
30.1 Introduction 442
30.2 Vulnerability assessment 444
30.3 Developing security plans 444
30.4 The emergency response plan 447
30.5 Conclusions 450
References 451
31 Final analysis 453
31.1 Introduction 453
31.2 Complaints 454
31.3 Public perception of drinking water quality 455
31.4 The quality of drinking water 457
31.5 Water usage and conservation 460
31.6 Water conflict 461
31.7 Drinking water in developing countries 461
31.8 Conclusions 465
References 468
Appendix 1 EC Drinking Water Directive (98/83/EEC) quality
parameters 469
Appendix 2 US National Primary and Secondary Drinking Water Standards of the US Environmental Protection Agency
(2006) 471
Appendix 3 World Health Organization drinking water guide values for chemicals of health significance. Health-related guide values have not been set for a number of chemicals that are not considered hazardous at concentrations normally found in drinking water, although some of these compounds may lead to consumer complaints on aesthetic grounds. These are listed in Table 2.6 488
Appendix 4 Major pesticides and their degradation (breakdown) products with their relative toxicity limits in drinking water. The toxicity is based on limits set originally by the Federal Health Authority in the former Federal Republic of Germany (Milleret al.,1990), where category A pesticides should not
exceed 1mg l 1, category B 3mg l 1and category C 10mg l 1 492 Appendix 5 EC Water Framework Directive (2000/60/EC) Priority
Substances 496
Appendix 6 List I and List II substances covered by the EC Dangerous
Substances Directive (76/464/EEC) 498
Appendix 7 The USEPA second Drinking Water Contaminant
Candidate List (CCL) published in February 2005 499
Glossary 501
Index 508
Preface to the second edition
Since writing the first edition there have been enormous changes in the water industry especially in the way drinking water quality is perceived and regulated. Thatfirst edition was written at the same time as the 1993 revision of the World Health Organization (WHO) guidelines as published, which has subsequently resulted in the revision of all the major drinking water standards, including those covering the European Union and the USA. That early edition reflected those changes. So the preparation of this new edition was timed to coincide with the publication, late in 2004, of the latest revision of the drinking water guidelines by the WHO, which has adopted a more rigorous health-based approach in setting guidelines. These new guidelines have been used as the basis of this new edition.
The problems associated with global warming leading to regional changes in climate and water availability are seriously affecting sustainability of supplies as well as seriously impacting on quality. Advances in chemical and microbial analysis have revealed that water contains many new contaminants that were previously undetectable or unknown, constantly presenting water utilities and regulators with new challenges. Also the recent terrorist attacks have demonstrated how vulnerable water supplies are to contamination or disruption. Thus, while the existing risks remain and need to be dealt with on a day-to-day basis, these new problems require innovative technical and management solutions. The aim of this new edition is to give an overview of the current and emerging problems and what can be done to solve them.
This new edition has been extensively updated and expanded using a different framework. It now comprises of 31 chapters clustered into 5 distinct parts, each dealing with a separate element of the water supply chain. Part I. Introduction to water supplycomprises of three introductory chapters. Thefirst deals with the fundamentals of the water industry: how much water is used; what is required by consumers in terms of quality; and the operation, management and regulation of the water utilities. The remainder of the chapter looks at the new management approaches to water supply, in particular water demand management, and how water conservation is becoming an integral part of sustaining future supplies. The second chapter reviews how drinking water standards are developed and the role of risk assessment in that process. Water safety plans are now the basis for achieving good quality and maintaining
supplies and this is discussed in detail. The chapter also explores how guidelines and standards have changed over the past 15 years. Part Icloses with a quick overview of the problems relating to drinking water quality, where those problems arise within the supply chain and where more information can be accessed within this text.
Part II. Problems with the resource examines in depth the water quality problems that arise within water resources due to natural and man-made influences. Chapter4is a brief overview of how quality varies due to land use and natural geology, comparing surface and ground waters. The remaining chapters look at each group of potential contaminants in turn examining the source, effects on consumers and appropriate solutions. There are separate chapters dealing with nitrate and nitrite; organic micro-pollutants including pesticides, industrial solvents and polycyclic aromatic hydrocarbons; endocrine-disrupting (oestrogen-mimicking) compounds, pharmaceutical and personal care products; odour and taste; metals including iron, manganese, arsenic and other heavy metals; hardness; algae and algal toxins; radon and non-radon radionuclides; and pathogens.
PartIII.Problems arising from water treatmentlooks at how the very action of improving water quality can itself cause significant aesthetic and occasionally health-related problems. After a brief review of treatment technology and how problems arise, there are individual chapters dealing with the main issues: flocculants such as aluminium and acrylamide; odour and taste; the contentious issue of fluoridation; disinfection by-products including trihalomethanes; and pathogen removal.PartIV.Problems arising in the distribution networkdeals specifically with the transport of water from the treatment plant to the consumer, which can seriously affect water quality. The design and management of service reservoirs, the mains and the individual service pipe that connects individual households to the network are explained. Chapters dealing with aesthetic quality, asbestos, bitumen and coal-tar linings, the remarkable variety of animals, both large and small, that live in the network and occasionally pop out of the tap, and finally the problems of biofilm development and pathogens within the mains are all dealt with in detail. After all this the water is still very susceptible to contamination from our own household plumbing and storage system. Part V. Problems in household plumbing systems explains how household systems work and follows with specialist chapters on corrosion, including lead contamination, pathogens, such asLegionella and Mycobacter-ium,and other quality problems.
PartVI.The water we drinkdeals with a number of consumer-related issues. The first chapter deals with alternatives to tap water and includes detailed sections on bottled water, point-of-use and point-of-entry treatment systems and other sources of water such as rainwater harvesting and water reuse. I said at the beginning that much has changed in the water industry in the developed world. What hasn’t changed is the number of people facing water scarcity in
developing countries, leading to poverty, starvation, serious illness and frequently death. After decades of dedicated and life-saving work by agencies such as WaterAid, the situation continues to worsen, driven by the dual problems of climate change and conflict. Water security in the twenty-first century looks at the problem of terrorism and ensuring water is protected more effectively from deliberate or accidental contamination or interruption. Thefinal chapter gives an overview of drinking water quality and how climate change will affect it over the coming decades.
Each chapter in the book concludes with a brief discussion of the relevance of the specific problems for consumers and suppliers alike. There are also a number of appendices giving drinking water standards in Europe, USA, as well as the new WHO guidelines and much else.
In this text I have attempted to provide a cohesive and comprehensive introduction to the water supply industry and the supply chain, which I hope will be equally useful to engineers, scientists, managers and even the general consumers who wants to know more about the water they drink. The text has been designed to give you an integrated overview of drinking water quality and to act as a reference guide. It should be used in conjunction with the Internet where very detailed information can be accessed and for that reason key URLs have been given where appropriate in the text.
The royalties from this text have been donated to WaterAid (www.wateraid. org.uk), which is an international non-governmental organization (NGO) dedicated to the provision of safe drinking water, sanitation and hygiene education to the world’s poorest communities. As you turn on your tap and safe
clean water pours out, remember that this really is something very special and that it has given us the wonderful society in which we live today. If you can help WaterAid in giving this gift to others then thank you.
Acknowledgements
I am very grateful to the very many people who have kindly provided me with information. I would especially like to thank any publishers or organizations who have given their permission to reproduce, or to modify, copyright material in this text.
PART I
Chapter 1
The water business
1.1
Introduction
The water supply industry is vitally important not only to maintain the health of the community, but for the sustainability of industry, business and agriculture. Without adequate water supplies our present society would never have evolved, and our lives today would be unrecognizable. Our dependence on treated water is now incalculable, and threats to that supply are comparable to the worst natural and man-made disasters. The volumes of water consumed each day by agriculture, industry and the public are vast, requiring an enormous infrastructure to satisfy the demand. Like the other service providers, electricity, telephone and gas, the water utilities deliver their product to the home, which requires a network of distribution pipes to service each household, but unlike the other utilities these are stand alone local or regional networks, rather than integrated national supply networks.
In England and Wales there are 26 private water companies that together supplied 52.7 million consumers in 2004/5 with 15 807 million litres (Ml d 1) of water each day. Sixty-eight per cent of this came from surface waters and the remainder (32%) from groundwater. It requires 1344 plants to treat this volume of water, which is supplied to consumers via 326 471 km of distribution mains. When this is broken down by region, the greatest demand is in the south-east and north-west regions, which have the largest populations. However, the areas of highest demand do not normally correspond to the areas where adequate water resources are to be found, so shortages occur. The current demand for potable water in England and Wales has stabilized and is currently at 91% of the peak demand recorded in 1990/1 (Table 1.1).
1.2
Water consumption
Water demand varies significantly between countries due to differences in culture, climate and economic wealth (Smith and Ali,2006). The demand for water also varies over the 24-hour period. This is known as the diurnal variation, with peak usage in the UK occurring between 07.00 and 12.00 and from
Table 1.1 Water supplied to the public distribution system 1990/1–2004/5. Adapted from Defra (2006) with permission from Defra
Ml d 1
United Kingdom
1990/1 1991/2 1992/3 1993/4 1994/5 1995/6 1996/7 1997/8 1998/9 1999/ 2000
2000/1 2001/2 2002/3 2003/4 2004/5
England and Wales1
metered2 4824 4785 4646 4572 4687 4676 4743 4791 4866 5076 5142 5464 5509 5704 5765 unmetered3 12 558 12 414 12 109 12 185 12 424 12 643 11 918 11 192 10 477 10 254 10 117 10 319 10 312 10 373 10 042
England and Wales total
17 382 17 199 16 755 16 757 17 111 17 319 16 661 15 983 15 343 15 331 15 259 15 783 15 821 16 077 15 807
Scotland
metered2 656 643 603 610 612 574 625 555 553 531 438 532 454 478 470
unmetered3 1645 1596 1603 1662 1651 1748 1686 1782 1775 1832 1962 1876 1933 1919 1920
Scotland total
2301 2239 2206 2272 2263 2322 2312 2336 2329 2363 2400 2408 2387 2397 2390
Northern Ireland
metered2 143 152 186 184 188 186 187 174 158 157 147 144 156 151 148
unmetered3 538 527 483 486 498 517 520 516 534 547 573 591 558 525 492
Northern Ireland total
681 679 669 670 686 703 707 690 692 704 720 735 714 676 640
United Kingdom1
metered2 5623 5580 5435 5366 5487 5436 5555 5520 5577 5764 5727 6140 6119 6333 6383 unmetered3 14 741 14 537 14 195 14 333 14 573 14 908 14 124 13 490 12 786 12 633 12 652 12 786 12 803 12 817 12 454
United Kingdom total
20 364 20 117 19 630 19 699 20 060 20 344 19 680 19 009 18 364 18 398 18 379 18 926 18 922 19 150 18 837
1
Includes water supplied by water supply companies. 2
Metered water is water measured at the point of delivery to premises. 3
Unmetered water includes leakage from the distribution system and water used for miscellaneous purposes such as fire-fighting, sewer cleaning, water mains flushing and temporary supplies for construction sites.
18.00 –20.00 each day (Figur e 20.1). Dem and is great er d uring weekends by about 12%, with demand being higher in the summer than in the winter. In the UK the typical household water consumption, typical here meaning a family of two adults and two children, is currently 510 l d 1. This is equivalent to a per capita water consumption rate of 150–180 l d
1
. Less than 20% of the water supplied is consumed for drinking or food preparation, with toiletflushing the single major use of water (Table1.2). Ownership of certain white goods, which has increased dramatically over the past 20 years, has an important influence on water usage. For example in the UK, 94% of households owned a washing-machine in 2003 compared to just 79% in 1983. A similar trend has been seen with dishwasher ownership, which is currently 31% in the UK compared to 5% over the same period. On average a dishwasher adds an extra 6 l d 1to the per capita consumption, increasing the overall demand by about 4%. Table1.3gives some idea of the amount of water such appliances use. At the top of the list are automatic washing-machines, which can use a staggering 100 litres each time they are used. A bath uses on average 90 litres a time compared with a shower that can use as little as 5 l min 1, although this depends on the showerhead used. For example, a power shower can use in excess of 17 litres per minute. Garden sprinklers use about a 1000 l h 1, which is the average daily water usage for seven or eight people. Clearly not all the public supplies are utilized for Table 1.2Typical current domestic water use in England and Wales
Use % Use %
Toilet 35 Washbasin 8
Kitchen sink 15 Outside use 6
Bath 15 Shower 5
Washing-machine 12 Dishwasher 4
Table 1.3 Average water use of a range of activities and appliances
Purpose of water use Frequency Litres
Cooking, drinking, washing-up and personal hygiene
per person per day 27
Bath one 90
Shower one 20
Toilet one 6–9a
Automatic washing-machine one 100
Dishwashing machine one 50
Hosepipe/sprinkler per minute 18
aModern cisterns now use 4 litres, or more commonly 6 litres, compared to
9 litres in older systems.
domestic purposes. This is illustrated by the analysis of daily water usage in 1984–5 by the former Severn and Trent Water Authority. Of the total 1942 Ml d 1supplied each day, 840 Ml was used for domestic purposes, 530 Ml for industrial, 50 Ml for agricultural purposes and a remarkable 522 Ml (26.9%) was lost every day through a leaky distribution system (Table1.4).
Losses from leaks are a widespread problem as water mains not only deteriorate with age, but are often damaged by heavy vehicles, building work or subsidence. Leakage control is a vital method of conserving water. Detecting and repairing leaks is both labour intensive and time consuming, which means that it is very expensive. However, if leaks are not controlled then water demand will escalate, with most of the extra demand seeping away into the ground instead of making its way to the consumer. In England and Wales 3608 Ml of the 15 378 Ml of treated water supplied each day was lost during 2004/5 through leakage, 2584 Ml d 1 from the distribution mains (17% of total input) and 1024 Ml d 1from supply pipes (7% of total input). The current leakage rate is Table 1.4Estimated daily use of water supplied by the former Severn and Trent Water Authority during 1984–5. Adapted from Archibald (1986) with permission from the Economic and Social Research Council
Amount used Amount used
Type of use (Ml d 1) Purpose (Ml d 1)
Domestic 840 Basic 288
Toilet flushing 242
Bathing 155
Washing-machine 114
External use 27
Luxury appliances 14 Industrial and
commercial 530 Processing 256
Domestic 153
Cooling: direct 77
Cooling: recycled 44
Agricultural 50 Livestock 35
Domestic 10
Protected crops 3
Outdoor irrigation 2
Unaccounted for 522 Distribution system 287
Consumers’ service pipes
167
Trunk mains 52
Service reservoirs 16
Total 1942
33% lower than the peak leakage rates reported in 1994/5, but has remained static each year since 1997/8 at between 22% and 25% despite a huge investment by the water companies in repairs and replacement to the distribution network each year (Figure1.1). Currently, 24% of all water treated is being lost due to leakage.
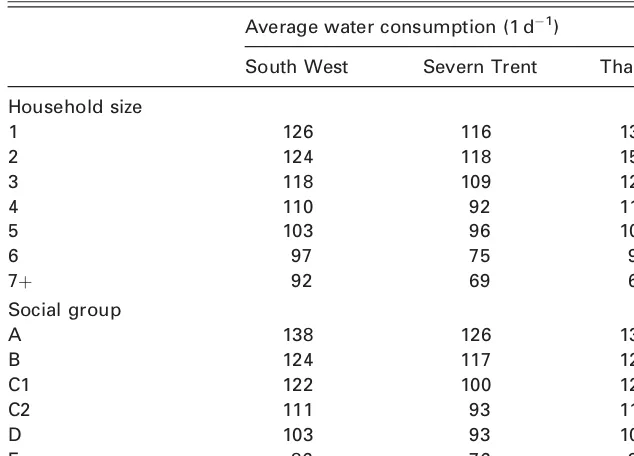
Studies of water usage are very difficult to carry out, as individual use of water is so variable. Actual average consumption values may also hide water lost by leakage within the household plumbing system for example. The National Water Council (1982) carried out a detailed study of water usage and found that the actual average consumption levels were slightly lower than those calculated by the companies at that time (Table1.5). This and subsequent studies on the pattern of domestic water usage have shown that per capita consumption decreases slightly with an increase in household size, and that social groupings also have an influence, with Social Group A using about 50 l d 1more than Social Group E (Baileyet al., 1986) (Table 1.5). It was also shown that the daily volume of water consumed per household for non-potable purposes is dependent on the size of the household. So on a national basis about 3% of the total volume of domestic water consumed each day is used for potable purposes, which is equivalent to about 10 litres for the average household. Interestingly, 25% of the first draws of water taken from the system each day are for potable purposes, a habit that may have significant consequences in those areas where the water is corrosive and lead or galvanized plumbing is used (Chapter 27).
1.3
Acceptable water quality
Water rapidly absorbs both natural and man-made substances, generally making the water unsuitable for drinking without some form of treatment.
6000
Losses from supply pipes Losses from distribution mains
5000
4000
3000
megalitres lost daily
2000
1000
0
1992–3 1994–5 1996–7 1998–9 2000–1 2002–3 2004–5
Figure 1.1Water leakage reported in England and Wales during the period 1992/3 to 2004/5. Adapted from Defra (2006) with permission from Defra.
Important categories of substances that can be considered undesirable in excess are:
1. Colour. This is due to the presence of dissolved organic matter from peaty soils, or the mineral salts of iron and manganese.
2. Suspended matter. This isfine mineral and plant material that is unable to settle out of solution under the prevailing conditions.
3. Turbidity. This is a measure of the clarity, or transparency, of the water. Cloudiness can be caused by numerous factors such asfine mineral particles in suspension, high bacteria concentrations, or evenfine bubbles due to over-aeration of the water. 4. Pathogens. These can be viruses, bacteria, protozoa or other types of pathogenic
organism that can adversely affect the health of the consumer. They can arise from animal or human wastes contaminating the water resource.
5. Hardness. Excessive and extremely low hardness are equally undesirable. Excessive hardness arises mainly from groundwater resources whereas very soft waters are characteristic of some upland catchments.
6. Taste and odour. Unpleasant tastes and odours are due to a variety of reasons such as contamination by wastewaters, excessive concentration of certain chemicals such as iron, manganese or aluminium, decaying vegetation, stagnant conditions due to a lack of oxygen in the water, or the presence of certain algae.
Table 1.5Comparison of average water consumption per person in three water company areas with respect to household size and socio-economic group Adapted from National Water Council (1982) with permission from the National Water Council
Average water consumption (1 d 1)
South West Severn Trent Thames
Household size
1 126 116 136
2 124 118 151
3 118 109 123
4 110 92 116
5 103 96 103
6 97 75 97
7þ 92 69 64
Social group
A 138 126 134
B 124 117 126
C1 122 100 124
C2 111 93 113
D 103 93 102
E 86 76 94
7. Harmful chemicals. There is a wide range of toxic and harmful organic and inorganic compounds that can occur in water resources. These are absorbed from the soil or occur due to contamination from sewage or industrial wastewaters.
Water treatment and distribution is the process by which water is taken from water resources, made suitable for use and then transported to the consumer. This is the first half of the human or urban water cycle, before water is actually used by the consumer (Figure 1.2). The second half of the cycle is the collection, treatment and disposal of used water (sewage) (Gray,2004).
The objective of water treatment is to produce an adequate and continuous supply of water that is chemically, bacteriologically and aesthetically pleasing. More specifically, water treatment must produce water that is:
1. Palatable–that is, has no unpleasant taste;
2. Safe – it should not contain any pathogenic organism or chemical that could be
harmful to the consumer;
3. Clear–be free from suspended matter and turbidity;
4. Colourless and odourless–be aesthetic to drink;
5. Reasonably soft–to allow consumers to wash clothes, dishes and themselves without
excessive use of detergents or soaps;
6. Non-corrosive–water should not be corrosive to pipework or encourage leaching of
metals from pipes or tanks;
7. Low in organic content–a high organic content will encourage unwanted biological
growth in pipes or storage tanks, which can affect the quality of the water supplied.
With the publication of drinking water standards such as the European Union Drinking Water Directive (98/83/EEC) (Appendix 1) and the Safe Drinking Water Act (1974) in the USA, which has given rise to the National Primary and Secondary Drinking Water Standards (Appendix 2), water must conform to the standards laid down for a large number of diverse parameters. In England and Wales, for example, the European Directive is enforced by the Water Supply
TREATMENT WORKS
WATER RESOURCES AND TREATMENT DISTRIBUTION DEMAND SEWERAGE SEWAGE TREATMENT
TREATMENT of the water companies in supplying water to the consumer and
subsequently treating it before returning it to the hydrological cycle
(Water Quality) Regulations (2000), which requires the water supply companies to deliver water to consumers that is wholesome and defines clearly what this term means. Consumers expect clear, wholesome water from their taps 24 hours a day, every day. Although water that is unaesthetic, for example due to colour or turbidity, may be perfectly safe to drink, the consumer will regard it as unpalatable and probably dangerous to health. Problems not only originate from the resources themselves, but during treatment, distribution and within the consumer's home (Chapter3).
1.4
Water utilities
Water supply has traditionally been a function carried out by state or regional authorities, but throughout Europe, Canada, Australia and the USA this role is increasingly being transferred to the private sector. Regulation and the overall quality control of drinking water remains largely with Governments and their agencies; however, the day-to-day operation is now largely privatized. There is growing concern that there may be a slow globalization of the market with a relatively small number of large companies dominating this vital product; also there is little evidence to support the idea that private companies are any more or less efficient than the public sector in supplying water (Hall and Lobina,2005). Clearly, it is extremely difficult to generalize, so an example of how drinking water is managed and regulated in a single country, the UK, is given below.
1.4.1
Water undertakers and regulation in the UK
Prior to 1989 a mixture of private companies and public-owned water authorities provided drinking water in England and Wales. Since September of that year all water services have been provided by the private sector. Ten Water Service Companies created by the privatization of the 10 water authorities deliver both water and sewerage services, while 29 water supply companies that had always been in the private sector supplied water only. The number of water supply companies has subsequently been reduced to 16 through a number of amalgamations (Table 1.6).
The situation elsewhere in the British Isles is rather different. In Scotland the three public water authorities, North of Scotland Water, East of Scotland Water and West of Scotland Water were amalgamated to form a single new authority, Scottish Water in April 2002 (www.scottishwater.co.uk). Although answerable to the Scottish Executive it is structured and managed as a private company. Northern Ireland is the only part of the UK where water supply and sewerage provision remains within the public sector. The Water Service is an Executive Agency that was set up after local government reorganization in 1996 within the Department for Regional Development (www.waterni.gov.uk); it became a Government Company in April 2007.
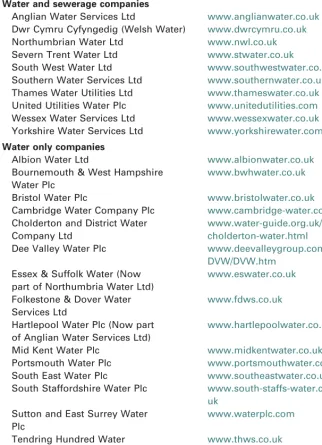
Table 1.6List of the 10 water and sewerage companies and 16 water only companies supplying drinking water in England and Wales and their web addresses
Water and sewerage companies
Anglian Water Services Ltd www.anglianwater.co.uk
Dwr Cymru Cyfyngedig (Welsh Water) www.dwrcymru.co.uk
Northumbrian Water Ltd www.nwl.co.uk
Severn Trent Water Ltd www.stwater.co.uk
South West Water Ltd www.southwestwater.co.uk
Southern Water Services Ltd www.southernwater.co.uk
Thames Water Utilities Ltd www.thameswater.co.uk
United Utilities Water Plc www.unitedutilities.com
Wessex Water Services Ltd www.wessexwater.co.uk
Yorkshire Water Services Ltd www.yorkshirewater.com
Water only companies
Albion Water Ltd www.albionwater.co.uk
Bournemouth & West Hampshire Water Plc
www.bwhwater.co.uk
Bristol Water Plc www.bristolwater.co.uk
Cambridge Water Company Plc www.cambridge-water.co.uk
Cholderton and District Water Company Ltd
www.water-guide.org.uk/ cholderton-water.html
Dee Valley Water Plc www.deevalleygroup.com/
DVW/DVW.htm
Essex & Suffolk Water (Now part of Northumbria Water Ltd)
www.eswater.co.uk
Folkestone & Dover Water Services Ltd
www.fdws.co.uk
Hartlepool Water Plc (Now part of Anglian Water Services Ltd)
www.hartlepoolwater.co.uk
Mid Kent Water Plc www.midkentwater.co.uk
Portsmouth Water Plc www.portsmouthwater.co.uk
South East Water Plc www.southeastwater.co.uk
South Staffordshire Water Plc www.south-staffs-water.co. uk
Sutton and East Surrey Water Plc
www.waterplc.com
Tendring Hundred Water Services Ltd
www.thws.co.uk
Three Valleys Water Plc www.3valleys.co.uk
There are three forms of regulation on water utilities, economic, quality and environmental. Economic and financial regulation depends on whether companies are privately or publicly owned, whereas quality and environmental regulation are imposed on all water utilities by the implementation of EC Directives or other legislation, although the rate of implementation and the exact nature of their implementation may differ slightly.
So while largely privatized, UK water utilities are regulated by the government through legislation and standards, and in three key areas by government-appointed organizations. In England and Wales the Water Act 1989 enabled privatization of the water industry, and through its numerous amendments makes the principal regulators the Secretary of State, the Water Services Regulation Authority and the Environment Agency.
The water utilities in England and Wales are different to other business sectors in that they do not have to compete for domestic customers and only compete in a very limited way for industrial customers. For that reason the price they can charge for water is regulated to protect customers from being exploited. This function is carried out by the Water Services Regulation Authority in England and Wales who is charged with protecting customers’interests while
ensuring that the privately owned water companies carry out and finance their functions properly. The Water Services Regulation Authority replaced the Office of Water Services (Ofwat) as the Government’s statutory watchdog (www.
ofwat.gov.uk) in April 2006 in order to bring it in line with the other economic regulators, although the acronym Ofwat has been retained. It is to this authority that consumers ultimately take their complaints and problems relating to pricing and standards of service when they have failed to obtain satisfaction from either the water company itself or through the Consumer Council for Water, which is an independent organization that represents customers’interests. The cost of this
is borne by the licence fee paid by the water service companies and statutory water companies (known as appointees) in England and Wales.
More specifically, the Water Services Regulation Authority, in consultation with the Secretary of State for Environment, Food and Rural Affairs, the Welsh Assembly and other interested groups, has the primary duty to (1) ensure that water and sewerage functions are properly carried out in England and Wales and (2) ensure that the water undertakers are able tofinance the proper operation of these functions by securing reasonable returns on their capital. Subject to these primary duties the Authority is also responsible to: (i) protect the interests of customers and potential customers in respect of charges (having particular regard to the interests of customers in rural areas and to ensure that in fixing charges there is no undue preference towards, or undue discrimination against, customers or potential customers); (ii) protect the interests of customers and potential customers in respect of other terms of supply, the quality of services (taking into account in particular those who are disabled or of pensionable age) and the benefits that could be secured from the proceeds of the disposal of
certain land transferred to companies when the former Regional Water Authorities were privatized; (iii) promote economy and efficiency on the part of utilities in the carrying out of the water and sewerage functions in a sustainable manner; and (iv) facilitate effective competition between persons holding or seeking appointments under the Water Act as water or sewerage utilities.
To act as a buffer between consumers with complaints and Ofwat itself, the Consum er Cou ncil for Water (www.ccwa ter.org.uk) is an indepe ndent group that deals with consumer complaints at a personal level when they have not received satisfaction from the Company complaints procedure. Ofwat deals with complaints of a more general nature in relation to pricing, competition and levels of service provided by companies.
Since 1 September 1989 all the water utilities in England and Wales have operated under the terms of an individual appointment, which is in essence a kind of operator’s licence. The terms of the appointment set out the maximum
charge increase(K)for all regulated services, mainly water supply and sewerage charges. Also defined are the circumstances under which unforeseen or previously unquantifiable obligations placed on the companies may be eligible for costs to be passed onto customers, a process known as cost pass through. The Water Act enables Ofwat to monitor standards of customer service, which includes the assessment of the state of underground assets such as mains and sewers to ensure that these are protected against progressive deterioration. Among the majorfinancial problems facing the water service companies is the rehabilitation of thousands of kilometres of old and leaking water mains and sewers, and the replacement of lead service pipes.
The Water Act requires each water company to develop and maintain an efficient and economic system of water supply within its area. It must also ensure that all such arrangements have been made for providing supplies of water to premises in its area, making such supplies available to people who demand them and for maintaining, imposing and extending its distribution system as necessary, to enable it to meet its water supply obligation.
In Scotland the Water Industry Commissioner has the same function as Ofwat in relation to Scottish Water and oversees charging policy and service standards. The Commissioner is supported byfive regional panels that represent the views of customers. Water services in Northern Ireland are controlled centrally by government who also set charges.
The Drinking Water Inspectorate (DWI) (www.dwi.gov.uk) was formed at the beginning of January 1990 and has nine main tasks: (1) To carry out technical audits of water companies. This is a system used by the DWI to check that water supply companies are complying with their statutory obligations and whether they are following good practice. There are three elements to this technical audit. Firstly an annual assessment based on information provided by the companies of the quality of water in each supply zone, water treatment
works and service reservoirs, compliance with sampling and other requirements and the progress made on improvement programmes. The second element is the inspection of individual companies covering all the above points at the time of the inspection, but also an assessment of the quality and accuracy of the information collected by the company. The third and final element is interim checks, which are made based on the information provided by the companies. (2)To instigate action as necessary to secure or facilitate compliance with legal requirements. (3) To investigate incidents that adversely affect water quality. (4)To advise the Secretary of State in the prosecution of water companieswho have supplied water found to be unfit for human consumption. (5) To provide technical and scientific advice to Ministers and Officials of the Department for Environment, Food and Rural Affairs (Defra) and Welsh Office on drinking water issues. (6) To assess and respond to consumer complaints when local procedures have been exhausted. Almost all of these problems are resolved by referring the complaint back to the water supply company concerned, requesting them to investigate the matter and report back to the DWI. The DWI may also ask the local environmental health officer to investigate the matter and to report back. The DWI also works closely with Ofwat and will investigate and liaise with them on complaints. Ofwat receives complaints from Consumer Council for Water and these may be passed on to the DWI. (7)To identify and assess new issues or hazards relating to drinking water quality and initiate research as required. (8)To assess chemicals and materials used in connection with water supplies. The DWI operates a statutory scheme that assesses and approves (if appropriate) the use of chemicals in treating drinking water. This scheme also covers the construction materials used to build water treatment plants and distribution systems. This scheme is to protect the public by ensuring that all chemicals added to water are safe, and that the chemicals which leach from construction materials are also safe. It is also important that such chemicals do not encourage microbial growth in distribution systems that would affect the taste or odour of the water. (9)To provide authoritative guidance on analytical methods used in the monitoring of drinking water.
All the water supply companies are inspected annually, although the level of inspection will vary from year to year. In the report that follows the inspection, areas of compliance and non-compliance are identified and recommendations made to ensure full compliance with statutory requirements, which includes prosecution where necessary. The DWI checks the sampling procedures and the location of sampling points to ensure that they are representative of water quality within each water supply zone. About 90 different laboratories analyze water supplies for the water companies. During inspection the procedures used and the training and competence of laboratory staff are examined. The actual results from sampling are also scrutinized, as is the data-handling system used to analyze them, which is done to ensure that the integrity of the data is maintained. The DWI concentrates on those results that have not complied with
the National Standards, and ensures that the correct follow-up action has been taken. Every day procedures are checked and all the data recorded on public registers.
The DWI only covers England and Wales so neither Scotland nor Northern Ireland have a specific agency concerned with drinking water quality, which remains the responsibility of government in the form of the Scottish Executive and the Northern Ireland Water Service respectively.
Environmental quality regulation in England and Wales is carried out by the Environment Agency (www.environment-agency.gov.uk), which replaced the National Rivers Authority in April 1996. The local authorities have retained their public health responsibilities as to the wholesomeness of drinking water, and have special powers to deal with private supplies. The regulations referring to water abstractions, impoundments and discharges of wastewaters is the responsibility of the Environment Agency. Their main regulatory functions cover (1) water resources (mostly abstractions, for which they issue licences as well as independently monitoring river quality); (2) pollution control through the issuing of discharge licences, also known as consents, to both industries and sewage treatment works operated by the water service companies; (3)fisheries; (4) land drainage and flood protection; and finally (5) conservation, amenity, recreation and navigation. While Defra also has regulatory functions, it is the activities of the DWI that are of most importance with respect to drinking water. The Scottish Environment Protection Agency (SEPA) (www.sepa.org.uk) carries out a similar function to the Environment Agency and has the duty to control discharges to rivers and seas, conserve water resources, prevent pollution and promote conservation throughout Scotland. In Northern Ireland, the Water Service is monitored by the Environment and Heritage Service (www. ehsni.gov.uk).
1.4.2
Charges
One of Ofwat’s most important tasks is reviewing increases in charges made by
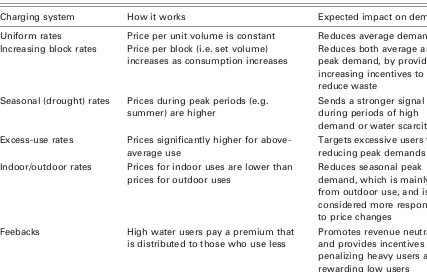
the water companies. Under a complex pricing formula the water companies in England and Wales can impose price increases in line with the current rate of inflation plus an individual sum known as theKfactor. This extra chargeKtakes account of the need to finance the major improvements programme and the amount is decided by Ofwat each year. The producer prices construction output index is used when considering cost pass through. For capital expenditure pricing, an index specifically applied to the water industry, the public works non-roads index (PWNRI) is used. The representative weighting in the retail price index (RPI) for gas, telecoms and water are 2.1%, 1.6% and 0.7% respectively. The basic regulation of charge increases (%) is by the formula RPIþK, so most charges rise each year byKpercentage points more than the annual rise of inflation. Those charges covered by this formula are the basket
items, which are unmeasured water supply and sewerage services, measured (metered) water supply and sewerage services, and also trade effluent, which covers most water company charges. The value ofKwas set for thefirst time in January 1991 when Ofwat calculated the RPI as 9.7%, compared to 2.43% in 2005, and allowed varyingKvalues for each water undertaker. In recent years the formulaKþRPIþUhas been used whereUis any unusedKthe company wishes to carry forward for use in future years (Table 1.7) (Ofwat, 2006). Pricing is now done using a financial model called Aquarius 3 which can be examined on Ofwat's website.
Charging household customers for water and sewerage is based on three different systems: (1) unmetered charges that are either fixed or based on the rateable value (RV) of the customer’s property; (2) metered charges that are
based on the amount of water recorded by the customer’s meter; or (3) assessed
charges that are based on the amount of water a customer would be likely to use if he/she had a meter. In England and Wales unmetered consumers have the right to request a water meter, which is fitted free of charge. On the other hand companies have the right to compulsorily install meters where there is a change of occupier or where a customer (1) waters his/her garden using a non-hand-held appliance; (2) has a swimming pool or pond with a capacity >10 000 litres that is replenished automatically; (3) has a bath, spa or Jacuzzi with a capacity >230 litres; (4) has certain types of shower, including power showers; (5) has a water treatment unit that incorporates reverse osmosis; or (6) lives in an area of water scarcity as determined by the Secretary of State.
Table 1.7Price limits, including K, used in the calculation of water charges by water service companies in England and Wales during 2006/7. (Adapted from Ofwat (2006) with permission from Ofwat.) The retail price index (RPI) for this period is 2.43. Unused K is carried forward (U)
Water Company Kfor 2006/7 (%)
Price limit (KþRPIþU) (%)
Actual increase in average charge (%)
Ucarried forward (%)
Ufrom 2005/6 (%)
Anglian 0.0 2.43 2.43 – –
Dwr Cymru 3.6 11.09 6.41 4.68 5.06
Northumbrian 3.7 6.16 6.16 – 0.03
Severn Trent 4.8 7.23 6.58 – –
South West 9.8 12.23 12.23 – –
Southern 3.9 6.33 6.33 – –
Thames 2.1 4.53 4.53 – –
United Utilities 6.4 8.83 8.82 0.01 –
Wessex 4.9 7.33 7.33 – –
Yorkshire 4.9 7.33 7.33 – –
Weighted average 4.0
Metered charges comprise of two elements, a fixed standing charge and a volumetric charge based on the amount of water used (Table 1.8). Only two companies have introduced metered tariffs to reward low-volume users. These are Anglian Water (which now owns Hartlepool Water Company) and Mid Kent Water Company. The tariff includes no standing charge but consumers pay a higher volumetric charge. So in order to break even they must use<75 m3per annum (i.e. the volume above which the tariff is no longer beneficial). There are special tariffs for vulnerable groups within the community.
The current mean level of metering is 30.3% (2006/7). Level of metering varies between companies from 15.2% (Dwr Cymru) to 57.4% (Anglian) for the water service companies (Table 1.8) and from 7.8% (Portsmouth) to 64.9% (Tendring Hundred) for the water only companies. The level of metering generally reflects the degree of water scarcity in supply areas.
Ofwat now undertakes a five-yearly price review to determine customer prices. The most recent review was completed in December 2004 to set prices for 2005 to 2010. As only a quarter to a third of domestic customers are currently metered, most pay a flat rate charge. Non-domestic customers are normally metered and like domestic customers pay according to the amount they use plus a standing charge. The average household bill in 2006/7 was £142 for water and £152 for sewerage. The average metered cost was £127 compared Table 1.8 The standing and volumetric charges applied to metered households in England and Wales by the water service companies in 2006/7 and the percentage of households currently metered. Adapted from Ofwat (2006) with permission from Ofwat
Water Company
Standing charge (£ per year)
Volumetric charge
(pence per m3)
Households metered (%)
Anglian 24.00 106.46 57.4
Anglian SoLowa 0.00 138.46 –
Dwr Cymru 27.00 113.93 15.2
Northumbrian 26.40 78.95 39.6
Severn Trent 19.80 108.77 27.5
South West 23.76 124.97 55.3
Southern 24.57 76.00 33.4
Thames 23.00 95.10 22.7
United Utilities 25.00 112.60 21.4
Wessex 17.00 128.76 37.4
Yorkshire 24.05 102.00 30.5
Mean 23.46 104.75b 30.3
aAnglian SoLow is a metered tariff system for low-volume users. bExcluding Anglian SoLow.
to £149 for unmetered supplies. The average unmetered water supply bill varied for this period from £112 (Southern Water) to £169 (South West Water) for the service companies and from £80 (Portsmouth Water) to £167 (Tendring Hundred Water) for the water only companies. So a litre of tap water costs on average about £0.10 or £0.19 including the full cost of sewage treatment.
Together the UK water companies supply drinking water to over 20 million properties and operate 1000 reservoirs and over 2500 water treatment works. Together with 9000 sewage treatment works and in excess of 700 000 kilometres of mains and sewers they have an annual turnover of more than £7 billion making water a very big business indeed. Each year more than £3 billion are invested back into the industry in England and Wales alone.
1.5
Water conservation
1.5.1
Water demand management
Water demand management (WDM), arose from the key principles of the Dublin Statement (ICWE,1992), which were restated at the Second World Water Forum held at The Hague in 2000. Water demand management, sometimes referred to as demand-side management, uses a range of tools such as conservation, pricing, water-efficient technologies and public education in conjunction with existing water supply infrastructure (i.e. supply-side management) to address the problems of dwindling water supplies and escalating water demand. The shortfall between supply and demand is a worldwide problem that is being exacerbated in many areas by climate change. Although applicable to all water users including industry and the biggest user agriculture, the section below deals only with drinking water supplies. Water demand management has been pioneered in Canada through the POLIS water sustainability project (POLIS,2005) and in Australia, where thefirst water use efficiency labelling scheme has recently been introduced (Australian Government, 2005). Specific actions may include the integrated use of conservation measures, metering, charging, building regulations incorporating water use minimization, and the increased water use efficiency of appliances and fixtures. To be successful, WDM also requires the development of new management techniques and structures, the use of decentralized technologies, and a change in user attitudes and behaviour.
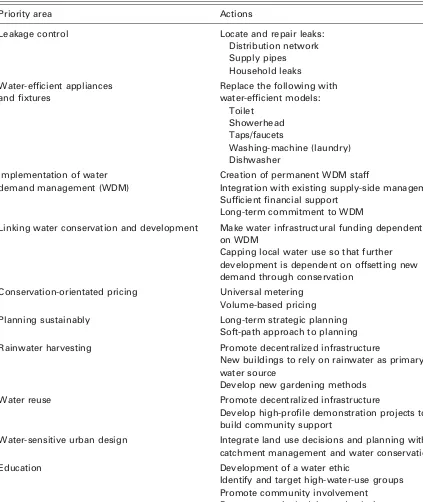
Water demand management has identified the need to move away from expensive, unrestrained and ecologically damaging infrastructural development associated with continually increasing water production. Rather it aims to replace traditional engineered solutions with a more sustainable approach where existing resources are used more effectively so there is no longer a need to exploit new surface or ground water resources, or damage existing resources further by increasing abstraction or by the construction of impounding reservoirs. The POLIS project has proposed ten key actions to achieve a more sustainable use of water resources (Table1.9) (Brandes,2006). All had to
Table 1.9 The ten key steps identified by the POLIS project to achieve water sustainability. Adapted from Brandes (2006) with permission from POLIS project, University of Victoria
Priority area Actions
Leakage control Locate and repair leaks:
Distribution network Supply pipes Household leaks
Water-efficient appliances and fixtures
Replace the following with water-efficient models:
Toilet Showerhead Taps/faucets
Washing-machine (laundry) Dishwasher
Implementation of water demand management (WDM)
Creation of permanent WDM staff
Integration with existing supply-side management Sufficient financial support
Long-term commitment to WDM
Linking water conservation and development Make water infrastructural funding dependent on WDM
Capping local water use so that further development is dependent on offsetting new demand through conservation
Conservation-orientated pricing Universal metering Volume-based pricing
Planning sustainably Long-term strategic planning
Soft-path approach to planning
Rainwater harvesting Promote decentralized infrastructure
New buildings to rely on rainwater as primary water source
Develop new gardening methods
Water reuse Promote decentralized infrastructure
Develop high-profile demonstration projects to build community support
Water-sensitive urban design Integrate land use decisions and planning with catchment management and water conservation
Education Development of a water ethic
Identify and target high-water-use groups Promote community involvement
Promote practical advice and solutions
meet the basic criteria of being technically feasible, broadly applicable, socially acceptable and cost effective compared to normal infrastructural development. These are considered below in detail.
1.5.2
Leak reduction in water mains
All water distribution systems suffer from leaks, with the degree of loss related to the age of the pipework. So as our systems age more water is lost requiring ever increasing investment to mend leaks. In Canada 13% of the total volume of treated water is lost via leaks, while in the UK it is 24% equivalent to 3608 Ml d 1. It is relatively easy to save between 5% and 10% by having a dedicated leak detection and repair service. However, in the UK, the national leakage rate has remained at approximately the same level for a decade even though increasing effort is spent in leak detection and repair each year (Figure1.1).
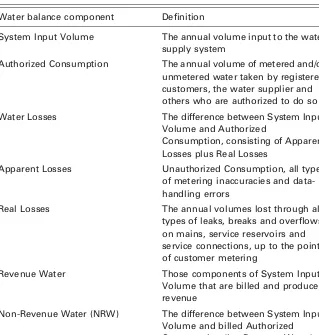
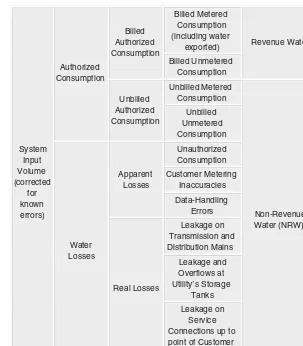
There are a number of ways in which leaks can be detected in water networks: water audits, sonic leak detection and passive detection. Water audits compare the amount supplied to the amount consumed using water meters at the supply and householders ends of the distribution network (i.e. integrated metering). The International Water Association (IWA) and the American Water Works Association (AWWA) have jointly developed a sophisticated water audit system that takes into account system-specific features such as pressure and length of pipework. This model allows whole sections of the water supply network to be checked at the same time allowing a water balance to be drawn up so that all water can be accounted for and losses can be identified as either apparent or real (Table1.10, Fig1.3). The model adopts a theoretical reference value, the unavoidable annual real loss (UARL), that represents the lowest level of leakage that can be realistically achieved if all of today’s best technology
could be successfully applied.
UARL¼ ð5:41Lmþ0:15Ncþ7:5LpÞ·P (gallons per day)
where Lm is the length of water mains in miles, Nc the number of service connections,Lp the total length of private (i.e. supply) pipe in miles calculated as Nc · the average distance from curb stop to customer meter, and P the average pressure in the system in psi. The UARL gives the level of leakage control that utilities should strive to reach. The software can be downloaded free from the AWWA website (www.awwa.org/WaterWiser/waterloss/Docs/ WaterAuditSoftware.cfm).
Alternatively the distribution pipework can be tested manually from the surface using a sonic leak detector. A number of water utilities, such as the Las Vegas Valley Water District, usefixed underground noise detection systems that allows subsurface leaks to be rapidly identified and located. This is a proactive approach where leaks can be detected early before the losses become too severe.
It also allows the integrity of the pipes to be quantified so that replacement of distribution mains can be prioritized more effectively. However, where water meters are not installed then leaks may only be detected when water is seen on the surface or enters the basement of buildings. This reactive approach is known as passive detection and results in greater water loss and is more expensive as reactive repairs cannot be managed or anticipated to any great extent.
Leakage detection and repairs to the distribution system do not involve customers and so are relatively straightforward; leaks in the customer’s supply
pipe linking the water main, after the meter, to the house are the responsibility of the householder. For example in the UK 1024 Ml d 1is lost from leaking supply pipes after the company meter, and so are not picked up by normal water audits. Table 1.10Components and definitions of the water balance used in the IWA/ AWWA leakage model. Extrapolated from the IWA/AWWA leakage model at
www.aw wa.org/WaterWiser/water loss/D ocs/WaterAud itSo ftware.cfm with
per-mission from the American Water Works Association
Water balance component Definition
System Input Volume The annual volume input to the water supply system
Authorized Consumption The annual volume of metered and/or unmetered water taken by registered customers, the water supplier and others who are authorized to do so
Water Losses The difference between System Input
Volume and Authorized
Consumption, consisting of Apparent Losses plus Real Losses
Apparent Losses Unauthorized Consumption, all types
of metering inaccuracies and data-handling errors
Real Losses The annual volumes lost through all
types of leaks, breaks and overflows on mains, service reservoirs and service connections, up to the point of customer metering
Revenue Water Those components of System Input
Volume that are billed and produce revenue
Non-Revenue Water (NRW) The difference between System Input Volume and billed Authorized Consumption (i.e. Revenue Water)
Detection of these leaks requires the involvement of the customer with household and business audits saving customers 5% on average on their bills. The POLIS project recommends that utilities adopt a comprehensive leak detection and system maintenance programme; and adopt integrated metering. This will need a large financial investment by companies and may need to be included into existing regulations or legislation (Brandes,2006).
Leaks also occur within households through poor maintenance or damage to household plumbing systems. While only metered customers will be paying for this wasted water, it is creating unnecessary demand. Leaking taps and cisterns are not always obvious but can waste significant volumes of water, while it will be even less likely that the householder will realize whether the supply pipe connecting the house to the mains is leaking. If a water meter is installed and accessible then the simplest way to check for leaks is to ensure that all the taps are turned off and that no water-using appliances are running. The meter is then read and again after an hour. If the reading has increased then there is a leaking
Billed Metered Utility,s Storage
Tanks Connections up to point of Customer
supply pipe, dripping tap or faulty toilet cistern. If the household is not metered the only alternative is to inspect all the taps and appliances for leaks or check for the sound of water movement in the pipework when all appliances are turned off and taps are fully closed. Modern toilet cisterns rarely have external overflows with excess water discharged into the bowl, so householders are rarely aware if the cistern is overflowing. Toilets can be checked for leaks by putting a little food colouring into the cistern. If the colouring begins to appear in the bowl withoutflushing, then the ballcock in the cistern needs to be either adjusted or replaced. A leaking toilet can waste more than 60 000 litres of water per year while each dripping tap can waste between 30 and 200 litres of water each day.
1.5.3
Efficient water-using appliances and fixtures
Residential water use has been rising steadily and has been associated with greater ownership and use of certain household appliances. However, mainly as a response to the need to reduce energy usage, these appliances have become increasingly water efficient. So a key area where water demand could be reduced without compromising current standards of living could be through the adoption of water-efficient appliances andfixtures.
With low rainfall and high evaporation rates, Australia is one of the driest continents in the world. With a rapidly expanding population and increasing standard of living, a serious shortfall between demand and supply of water is developing. The Australian Government has responded by the development of a range of water conservation measures to stabilize and potentially reduce demand, including the introduction in July 2006 of a new water efficiency labelling scheme for consumers and manufacturers. The mandatory Water Efficiency Labelling and Standards Scheme (WELS) applies to seven product types that must now be labelled for water efficiency. Using a six star rating system, the labelling scheme is very similar to that currently employed in many parts of the world for energy efficiency of white electrical goods. The new labels give a star rating of between one to six, with six being the best, as well as an actual water consumptionfigure. The WELS label is very distinctive and must befixed to the product, and if packaged then it must also appear on the outer packaging. The actual label or the details contained on the label must also appear in any product specifications such as brochures, magazines, advertize-ments or website promoting a registered product.
The products covered by WELS are washing-machines, dishwashers, showers, toilets, urinals, all taps, except those used over the bath, and flow controllers. All these products must now be tested and rated according to new water efficiency standards, and registered with the National Regulator. Compliance with WELS is monitored by a permanent team of Inspectors who can impose a range offines and penalties. Under the WELS legislation (i.e. the Water Efficiency Labelling and Standards Act 2005) the regulator can compel