Herding Behavior of Post Initial Public Offering
in Indonesia Stock Exchange
Ike Arisanti
1*and Marwan Asri
2ABSTRACT: This research was conducted to test whether there is a herding behavior post Initial Public Offering (IPO) in Indonesia Stock Exchange. Domestic transactions on the Indonesia Stock Exchange are rising year by year along with the increased of IPO emissions. The existence of underpricing phenomenon causes a domino effect (herding) that arises on potential investors after the IPO. This study used Cross-Sectional Absolute Deviation (CSAD) method to detect herding behavior. The data used were daily price data of IPO shares from the 1st day until the 30th day after IPO period 2005-2015. Hypothesis testing was done using regression analysis by means of CSAD variable as dependent variable and return market as independent variable. The result of this research indicated that there was a herding behavior post -IPO in Indonesia Stock Exchange period 2005-2015 period. It is shown by the negative a d sig ifi a t alue of γ . < . 5 .
KEYWORDS: herding behavior; post IPO; underpricing
© 2018 jai. all rights reserved
Introduction
The classical theory of finance explains that investor behavior is rational, which means that an investor's investment decision is based on one's logic and rationality. That rational behavior makes investors have a desire to get high returns and low acceptable risk.
An efficient market is marked by the prices in the market which reflect all available information and no one can obtain abnormal returns. In fact, the current capital market conditions are not fully explained by the classical theory of finance, there are conditions where investors are irrational in their investment decisions. The moment after the IPO is known by the phenomenon of underpricing, where the IPO stock price increases higher compared to when it is first published in the primary market. The existence of underpricing phenomenon causes a domino effect (herding) that arise on potential investors post IPO.
Herding behavior occurs when the market is not transparent (Kremer & Nautz, 2012). Agrawal as cited by Kim (2014) mentions that there is a phenomenon of underpricing post-IPO almost throughout the world capital market. Herding behavior becomes very important if the market is dominated by large institutional investors. Institutions can purchase IPO shares in large volumes so that it creates price movements. Institutions are evaluated based on a peer group, they must be extremely careful in making decisions by looking at other managers’ decisions. Moreover, retail investors usually also hear stock recommendations given by the institutional investors. Mada, Jl. Kaliurang KM 5, Sleman, Yogyakarta Special Region,
behavior Among others are Gunawan, Hari, Achsani and Rahman (2011) who detected herding behavior in Indonesia and Asia Pacific stock markets, the results showed that herding behavior occurred in stressed market conditions both in Indonesia and Asia Pacific. Tristantyo and Arfianto (2014) examined herding behavior based on investor type in stock ownership in Indonesia. The result showed that there was a pattern of causality relationship between institutional investor type to domestic individual, foreign institution to domestic institution, domestic institution to individual domestic relationship in one way. The fourth result of the analysis can explain the existence of herding behavior in Indonesia capital market even though its impact is only on the same type of investor.
Researches on post-IPO herding have also been conducted in Malaysia and West Africa, Yong (2007; 2011) and Muema (2014) show that there have been gaps from the results of research that has been done. In Malaysia, it appears that post-IPO herding behavior while at Nairobi Stock Exchange (West Africa), post-IPO herding behavior does not appear simultaneously, herding behavior appears in only five stocks. Chandra (2012) conducted a study on herding on IPO shares in Indonesia in 2007-2011, the result of the study showed that there was no herding behavior on IPO shares in Indonesia. This study examines the herding rate that occurs in the Indonesian stock market, especially IPO shares in the period 2005-2015. Researches on herding on IPO phenomenon are still rare in Indonesia, therefore it is very interesting to conduct a research in Indonesia because herding behavior is very likely to occur in post-IPO. Investors do not have enough information related to the performance of the company and the underpricing phenomenon, so they tend to follow the market consensus. In addition, this study differs from the research conducted by Chandra (2012), in which the researcher used the year period of 2005-2015, used stock price data from day 1 to day 30 post IPO, and detected herding behavior which is grouped according to industrial sector.
The possibility of herding behavior in investors is very possible to occur since Indonesia is one part of emerging market country at this current time. The research on herding in post-IPO stock is interesting to be conducted Indonesia to see the effect of domino (herding) and underpricing phenomenon that happened in post-IPO. The main objective of this research is to examine herding behavior after the initial public offering in the period 2005-2015 in Indonesia Stock Exchange.
Literature Review and Hypothesis Development
Definition of Herding
Journal of Accounting and Investment, July 2018 | 151
Cognitive bias in behavior finance
According to Asri (2015), heuristic is the behavior of a person who often uses data, efforts, and analysis which is relatively limited to produce decisions as soon as possible. Often, heuristic simplification behavior is complemented with the tendency to use available information only (availability bias). Hindsight refers to the tendency of people to feel that an event can be predicted before only by looking at the last event that happened. Representativeness is defined as a view that represents something, illustrating that representativeness as a judgment maker about the probability of an event.
Efficient Market Hypothesis
According to Fama (1970), the Efficient Market Hypothesis (EMH) is a thought that stock prices already reflect all available information. The MEM consists of three versions categorized according to the definition of information availability that can be obtained by investors, namely weak, semi strong, and strong.
Herding Detection Researchs
Lakonishok, Shleifer, and Vishny (LSV) Method
Lakonishok, Shlefier and Vishny (1992), hereafter referred to as LSV, examined 769 pension funds to analyze the impact of herding by financial managers on stock prices.
LSV uses the equation:
HLSVi,t = LSVli,t– AFi,t = | - Pt| - AFi,t
Note:
= proportion of share purchase transactions i on t period.
LSV1i,t = absolute gap between proportion and proportion of expectation
on no-herding condition.
Pt =probability of purchased share on t period
AFi,t = adjustment factor.
According to Bikhcandani and Sharma in Chandra (2012), the LSV method has disadvantage in which LSV cannot measure the intensity of herding behavior because it only uses the number of buyers and sellers on the stock market, not seeing the volume of transactions.
Christy and Huang (CH) Method
Christy and Huang (1995) describe CSSD as follows:
CSSDt =
Note:
Ri,t = return share on i share on t period.
Rm,t = cross-sectional average N return on market portfolio on t period
N = the number of shares in portfolio
To find a linear correlation of the average proximity on individual stock returns towards market return the following equation is used:
CSSDt= α+ β L
tD L
t + β U
Dt U
+ ɛt
Note:
α = the average dispersion coefficient of the sample without involving the presence of dummy variable.
βL,βU
= the coefficient of herding indicator if it shows a statistically significant negative value.
DLt = valued = 1, if the return on t day is on 1% extreme and 5% lower tail
from market return distribution; and = 0 if the vice versa.
DUt = valued = 1, if the return on t day is on 1% extreme and 5% upper tail
from market return distribution, and = 0 if the vice versa. ɛ = standard error
Dummy variable is created to capture differences in investor behavior on the up or do o ditio s. If the alues of βL a d βU are egati e a d significant, it can be said that there are indications of herding behavior. CH uses 1% or 5% of the upper tail and lower tail data distribution to describe the condition of extreme price movement.
Chang, Cheng, and Khorana (CCK) Method
Chang, Cheng, and Khorana (2000), which, which then abbreviated as CCK, expanded the analysis of Christy and Huang (1995) in three additional dimensions:
1. A stronger approach to measure herding on the basis of equity behavior returns, using the non-linear regression method to measure the correlation between the levels of the dispersion equity return (using Cross-sectional Absolute Deviation or CSAD) with the average market return. The instinct is, we expect the share return dispersion to decrease if market returns increase and when the activity of herding is high and moderate.
2. Analyzing herding behavior in the United States, Hongkong, South Korea, Japan and Taiwan and found that in international markets, factors such as the extent of individual or individual investors’ roles, the quality and level of market information disclosure, the complexity of the derivative market strongly determine the behavior of investors in market.
Journal of Accounting and Investment, July 2018 | 153
To begin with, CCK describes the correlation between CSAD and market return. CCK illustrates that under extreme conditions, if investors follow the consensus of market behavior and ignore their personal opinions, then the linear correlation between dissemination and market return is no longer valid, but the correlation can be non-linear.
CCK describes the correlation between CSAD and market return. CCK illustrates that under extreme conditions, if investors follow the consensus of market behavior and ignore their personal opinions, then the linear correlation between dissemination and market return is no longer valid, but the correlation can be non-linear.
The calculation of CSAD is as follows:
CSADt = Ri,t– Rm,t|
Note:
Ri,t = return of individual stocks in t period
Rm,t = market return in t period
N = the number of companies in the sample
Hence, to search a non-linear correlation we will use the following equation:
CSADt= α + γ1 | Rm,t | + γ2 Rm,t2+ ɛt
Note:
Α = intersect variable
γ1 = linear coefficient between CSAD and market return portfolio
γ2 = non-linear coefficient between CSAD and market return portfolio
Rm,t = market return portfolio on t period
ɛt = standard error
The absolute value of Rm,t is required to compare the linear coefficients. The
alue of γ1 describes the linear correlation between Rm,t and CSADt. While
this non-linear orrelatio a e see i egati e oeffi ie t of γ2 and
statistically significant. The advantage of CCK method can detect herding as a whole both linear and nonlinear correlation and the required data is relatively easy to obtain because it only uses stock return data.
Initial Public Offering and Underpricing
Initial Public Offering is a stock market launch activity that becomes one of the financing alternatives for the company. Hartono (2016) states that the benefits of public offering among others are the easiness of raising capital in the future, increasing liquidity for shareholders and the market value of the company. Besides the advantages of offering shares to the public, some of the losses are increased report costs, disclosure, fear of being taken over.
phenomenon. Hartono (2016) calculated the initial return IPO for 25 years from 1991 until May 2014 in Indonesia, the results showed that for 25 years the opening price on the first day underwent underpricing.
The existence of underpricing phenomenon in Indonesia illustrates the specific behavior of stock prices relating to time, that the price at certain times has different behavior with the price at other times. Hence, investors will tend to remember a phenomenon that becomes a reference to invest. Rock in Yong (2011) argues that uninformed investors will face asymmetry information if it takes the desired stock but does not have enough information, so they just follow the decisions of other investors who have the information. Based on that asymmetry information, the uninformed investor will buy the stock if there is underpriced to gain profit. Based on the above theory, the research hypothesis is as follows:
H0: There is no post-IP herding behavior on the Indonesia Stock Exchange.
Hi: There is herding behavior in post-IPO at Indonesia Stock Exchange.
Research Method
In this study, researchers used a sample of all companies that issue initial stock (IPO) from 2005 to 2015. The data used included daily stock price data from the first day until the 30th day of post-publish in the primary market. The sample selection was conducted using purposive sampling method, which were the companies whose data were available during the observation period.
Operational Definition
Return is the result of an investment. According to Hartono (2016: 253), return consists of capital gain / loss and yield. Daily Market Return calculation is with the value of market return(Rm,t) in which in this study it
obtained by calculating daily stock return (Ri,t), then add up all the values of
each stock on day t and divided by the number of shares available (N).
In this study the researchers used a cross-sectional absolute deviation analysis which was first developed by Chang, Cheng, and Khorana (2000) which used deviation absolute to detect herding behavior. The level of stock dispersion can be measured by cross-sectional absolute deviation from stock return. Rational asset pricing model predicts that dispersion is a positive function of market return and its relationship is linear. An increase in the tendency of herding behavior toward the market consensus at a time when large stock price movements can change the correlation from linear to nonlinear.
Data Analysis Method and Hypothesis Testing
Journal of Accounting and Investment, July 2018 | 155
alues fro the data. Le el of sig ifi a e used at 5% α = . 5 . Data ere analyzed using Cross Sectional Absolute Deviation (CSAD) model. The formula used was as follows:
CSADt = α + γ1 | Rm,t | + γ2 Rm,t 2
+ ɛt
Note:
α = intersect variable
γ1 = linear coeffisient between CSAD and market return portofolio
γ2 = non-linear koefisien between CSAD and market return portofolio
Rm,t = market return portofolio on t periode
ɛt = standard error
According to Chang, Cheng, and Khorana (2000) if the negative and sig ifi a t γ2 (<0.05) then H0 is rejected and Hi is accepted which means
there is a herding behavior of post-IPO in the Indonesia Stock Exchange. If the alue of γ2 is positive and significant then H0 is accepted and Hi is
rejected, it means that there is anti herding behavior or there is no herding behavior of post-IPO in Indonesia Stock Exchange
Result and Discussion
Descriptive Statistics Analysis
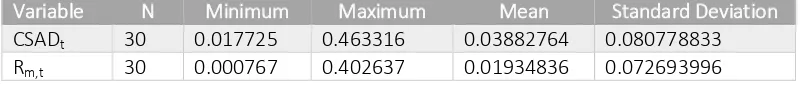
Table 1 provides a description that from a total of 205 issuers that fulfill the sample criteria have a total of 30 trading observations during each observation period of each issuer. The overall result of the descriptive statistical analysis showed a positive result. The daily average CSAD score during the observation period was 3.8% with a maximum return value of 46% achieved in the first post-IPO trading day, a minimum of 1.7% achieved on the 29th day of post-IPO trade and standard deviation of 8%. Daily average market returns during the observation period were 1.9% with a maximum return value of 40% achieved on the first post-IPO trading day, a minimum market return of 0.07% achieved on the 29th post-IPO trading day, and standard deviation by 7.2%.
Table 2 shows the descriptive statistics of initial return of companies doing IPO in the period of 2005-2006. Maximal initial return in 2012 is 3.7541 by PT Surya Essa Perkasa Tbk shares and minimal initial return in 2010 is -0.5922 by Nippon Retailindo Tbk shares.
Table 1 Descriptive Statistics Analysis of CSADt and Rm,t
Variable N Minimum Maximum Mean Standard Deviation
CSADt 30 0.017725 0.463316 0.03882764 0.080778833
Table 2 Descriptive Statistics Analysis Initial Return IPO period 2005-2015
Variable N Minimum Maximum Mean
Initial Return 2005 8 0.0500 0.4762 0.0841
Initial Return 2006 11 0.0385 0.6818 0.2302
Initial Return 2007 18 -0.6811 2.5000 0.4690
Initial Return 2008 15 -0.7456 0.7000 0.2683
Initial Return 2009 7 -0.3247 0.5727 0.0906
Initial Return 2010 19 -0.5922 1.1190 0.3191
Initial Return 2011 18 -0.2608 1.1250 0.1637
Initial Return 2012 17 -0.3105 3.7541 0.6548
Initial Return 2013 21 -0.1727 0.6944 0.1481
Initial Return 2014 20 0.0035 2.8774 0.6393
Initial Return 2015 14 -0.1565 0.7000 0.2325
Table 3 shows that the regression results using the overall sample data during the period of 2005 to 2015. Empirically, there are indications of herding behavior. The empirical test result from the regression showed the oeffi ie t γ is egati e a d fulfils the le el of o fide e at 95% le el. The ability of the regression results fulfiled the expected level of confidence, then empirically this could infer the existence of herding behavior. This means supporting the hypothesis on Hi, then in aggregate it appears that from the period 2005 to 2015 the herding behavior of post IPO occurs.
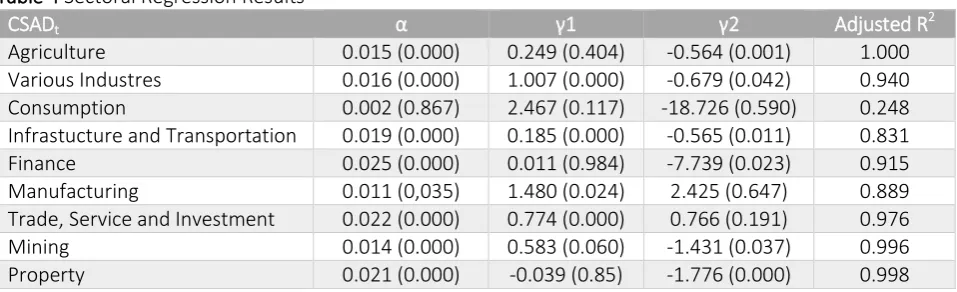
Table 4 shows that the regression results are based on sectoral samples from 2005 to 2015. Herding behavior is seen in several sectors including agriculture, various industries, infrastructure and transportation, finance, mining and property. It is shown by the coefficient is empirically negative and significant or fulfil the level of confidence by 95%. There is no evidence of herding behavior in the three sectors including the consumption, manufacturing and investment services sectors. It is shown by the coefficient which is not significant or does not fulfil the 95% confidence level. Herding behavior is dominated by several sectors including the agricultural sector, various industries, infrastructure and transportation, finance, mining, and property.
Table 3 Result of Regression Agregate Test
CSADt α γ γ Adjusted R
2
Agregate 0.016 (0.000) 1.337 (0.000) -0.561 (0.013) 0.997
Table 4 Sectoral Regression Results
CSADt α γ γ Adjusted R
2
Agriculture 0.015 (0.000) 0.249 (0.404) -0.564 (0.001) 1.000
Various Industres 0.016 (0.000) 1.007 (0.000) -0.679 (0.042) 0.940
Consumption 0.002 (0.867) 2.467 (0.117) -18.726 (0.590) 0.248
Infrastucture and Transportation 0.019 (0.000) 0.185 (0.000) -0.565 (0.011) 0.831
Finance 0.025 (0.000) 0.011 (0.984) -7.739 (0.023) 0.915
Manufacturing 0.011 (0,035) 1.480 (0.024) 2.425 (0.647) 0.889
Trade, Service and Investment 0.022 (0.000) 0.774 (0.000) 0.766 (0.191) 0.976
Mining 0.014 (0.000) 0.583 (0.060) -1.431 (0.037) 0.996
Journal of Accounting and Investment, July 2018 | 157
Discussion
The occurrence of post-IPO herding in Indonesia is in accordance with research conducted by Yong (2011) who analyzed post-IPO herding behavior in Malaysia. The occurrence of informed investors who know the information related to the IPO stock price before it is issued in the primary market (there will be underpricing) brings influence to other investors who have no information to follow the market consensus behavior on underpricing issues.
This study is also consistent with research conducted by Kim (2014) in Korea who found post-IP herding behavior, overpowering investors to underpricing phenomena contribute to the first post-IPO returns, investors have different reasons to maximize profits, preferring to follow observation of other investors who are considered to have more information. Uninformed investors will buy shares if it only happens underpriced to gain profit. Rational expectation theory that explains that investors who do not have private information will get the information by observing the price changes that occur. Investors who do not follow the information will make transactions by following transactions conducted by other investors.
In Indonesia, post-IPO herding behavior is also suspected due to investors' optimism regarding the underpricing phenomenon so that investors are gaining investment in post-IPO shares. The optimism is because of the phenomenon of underpricing has occurred in Indonesia. Efficient market hypothesis explains that stock prices already reflect all the information available in the company, so stock prices reflect investor confidence (beliefs) that lead to the accuracy of the return investors’ expectations, investor knowledge related to company’s fundamental information is very limited to enable them to make decisions based on signals from other investors, indicating that there is a herding behavior on stock investment post IPO.
The value of adjusted R square means that how well the research model can be applied to explain the theory. The value of adjusted R square in the research of 0.997 means that 99.7% of the dependent variables can be explained by the independent variables, while 0.3% described other variables outside the model. Based on Chang, Cheng and Khorana (2000) high adjusted R square values indicate that macroeconomic conditions have a higher role compared to company-specific information. Based on these assumptions, the results of this study indicate that the occurrence of herding behavior in Indonesia is influenced more by macroeconomic factors. In Chang, Cheng, Khorana's research, the higher the adjusted R square value in emerging markets is consistent with the view that scarcity of company-specific information which is fast and accurate can lead investors to focus more on macroeconomic conditions.
Conclusion
behavior is conducted through the relationship between the level of disperse with the market return rate during the period 2005-2015.
The result of empirical test shows that herding behavior happened post-IPO in Indonesia. Herding behavior is dominated by several sectors including the agricultural sector, various industries, infrastructure and transportation, finance, mining, and property. The presence of informed investors who know the information related to the IPO stock price before it is published in the primary market (underpricing will occur) brings in the influence of other investors who have no information to follow the market consensus behavior on the underpricing issue. Practically this research can be used by issuers. As a company conducting IPOs, this research is used to consider IPO timings that can provide optimal results.
Limitations of this study is that the researcher used daily stock return data for 30 days post IPO and only focused on underpricing phenomenon. In order for herding research to be more accurate, it is expected for further research to conduct herding research on other phenomena that occur in Indonesia. Not only use daily return data, but intra-day trading data, weekly or monthly data so that the existence of herding behavior is possible to be detected.
References
Arifin, Z. (2010). Potret IPO di Bursa Efek Indonesia. Jurnal Siasat Bisnis, 14(1), 88-89.
Asri, M. (2015). Keuangan Keperilakuan. Yogyakarta: BPFE Fakultas Ekonomika dan Bisnis UGM.
Chang, E., Cheng, J., & Khorana., A. (2000). An Examination of Herd Behaviour in Equity Markets: An International Perspective. Journal of
Banking & Finance, 24(10), 1651-1679.
Christiy, W.G., & Huang. R.D. (1995). Following The Pied Piper: Do Foreign Individual Returns Herd Around The Market. Financial Analyst Journal,
51(4), 31-37. doi: 10.2469/faj.v51.n4.1918
Chandra, M. (2012). Pengukuran Dan Analisis Perilaku Herding Pada Saham IPO
Bursa Efek Indonesia Tahun 2007-2011. Thesis, Universitas Indonesia.
Chiang, T., & Zheng. D. (2010). “An Empirical Analysis of Herd Behaviour in Global Stock Markets”. Journal of Banking and Finance, 34(2), 1911-1921. doi: 10.1016/j.jbankfin.2009.12.014
Fama, F.E. (1970). Efficient Capital Markets: A Review of Theory and Empirical Work. The Journal Of Finance, 25(2), 413-416. doi: 10.2307/2325486
Gunawan., W., Hari, N. A., Achsani., & Rahman . (2011). Pendeteksian Perilaku Herding Pada Pasar Saham Indonesia dan Asia Pasifik.
Indonesian Journal of statistic, 16(2), 1-8.
Hartono, J. (2016). Teori Portofolio dan Analisis Investasi (Edisi Kesepuluh). Yogyakarta : Badan Penerbit Fakultas Ekonomika UGM.
Kim, S. (2014). The Effects of IPO Herding on the Initial Returns and Subsequent IPO Timing. Paper Prsented at Financial Five Scientific Research Society Conference 2014 (PP 1490 -1520). Korean Finance Association, South Korea.
Journal of Accounting and Investment, July 2018 | 159
Lakonishok, J., Shleifer, A., & Vishny, R.W. (1992). The Impact of Institutional Trading on Stock Price. Journal of Financial Economic,32(1), 23-43.
Muema, S.M.( 2014). The Herd Effect During An Initial Public Offering and Stock Returns At the Nairobi Stock Exchange. Paper was presented at the School of Business University of Nairobi Research Project, East Africa.
Tristantyo, R., & Arfianto, E. (2014). Analisis Perilaku Herding Berdasarkan Tipe Investor Dalam Kepemilikan Saham. Diponegoro Journal of
Management,3(4), 6-10.
Yong, O. (2011). Winner’s Curse and Bandwagon Effect in Malaysia IPO: Evidence from 2001-2009. Jurnal Pengurusan, 32(2), 21-26.
Yong, O. (2007). A Review of IPO Research in Asia: What Next?. Pacific-Basin