Seep mounds on the Southern Vøring Plateau (offshore Norway)
Michael Ivanov
a,*, Adriano Mazzini
b, Valentina Blinova
a, Elena Kozlova
a, Jan-Sverre Laberg
c,
Tatiana Matveeva
d, Marco Taviani
e, Nikita Kaskov
aaUNESCO Centre for Marine Geology and Geophysics, Moscow State University, Moscow 119899, Russia bPhysics of Geological Processes, University of Oslo, PO Box 1048, Blindern, Norway
c
University of Tromsø, Department of Geology, Tromsø, Norway dVNIIOkeangeologia, 1 Angliyskiy Av., 190121 St-Petersburg, Russia eCNR-Instituto di Scienze Marine, Via Gobetti 101, I-40129 Bologna, Italy
a r t i c l e
i n f o
Article history: Received 4 August 2009 Received in revised form 9 November 2009 Accepted 20 November 2009 Available online 6 December 2009
Keywords: Seep structures Hydrocarbon gases Gas hydrates
Methane-derived carbonates Chemosynthetic fauna Vøring Plateau
a b s t r a c t
Multidisciplinary study of seep-related structures on Southern Vøring Plateau has been performed during several UNESCO/IOC TTR cruises on R/V Professor Logachev. High-resolution sidescan sonar and subbottom profiler data suggest that most of the studied fluid discharge structures have a positive relief at their central part surrounded by depression. Our data shows that the present day fluid activity is concentrated on the top of these ‘‘seep mounds’’. Number of high hydrocarbon (HC) gas saturated sedi-ment cores and 5 cores with gas hydrate presence have been recovered from these structures.d13C of methane (between68 and94.6&VPDB) and dry composition of the gas points to its biogenic origin. The sulfate depletion generally occurs within the upper 30–200 cm bsf and usually coincides with an increase of methane concentration. Pore water d18O ranges from 0.29 to 1.14&showing an overall gradual increase from bottom water values (d18Ow 0.35&). Although no obvious evidence of fluid
seepage was observed during the TV surveys, coring data revealed a broad distribution of living Pogo-nophora and bacterial colonies on sea bottom inside seep structures. These evidences point to ongoing fluid activity (continuous seepage of methane) through these structures. From other side, considerable number and variety of chemosynthetic macro fauna with complete absence of living species suggest that present day level of fluid activity is significantly lower than it was in past. Dead and subfossil fauna recovered from various seep sites consist of solemyid (Acharax sp.), thyasirid and vesicomyid (cf. Calyptogenasp.) bivalves belonging to chemosymbiotic families. Significant variations ind13C (31.6
&to 59.2&) andd18O (0.42&and 6.4&) of methane-derived carbonates collected from these structures most probably related to changes in gas composition and bottom water temperature between periods of their precipitation. This led us to ideas that: (1) seep activity on the Southern Vøring Plateau was started with large input of the deep thermogenic gas and gradually decries in time with increasing of biogenic constituent; (2) authigenic carbonate precipitation started at the near normal deep sea environments with bottom water temperature around þ5 C and continues with gradual cooling up to negative
temperatures recording at present time.
Ó2009 Elsevier Ltd. All rights reserved.
1. Introduction
This paper presents the geochemistry of fluids, gas hydrates, and authigenic carbonates collected during three UNESCO-IOC Training Through Research (TTR) cruises on the Vøring Plateau and discusses the origin and recent seep activity of the seafloor structures.
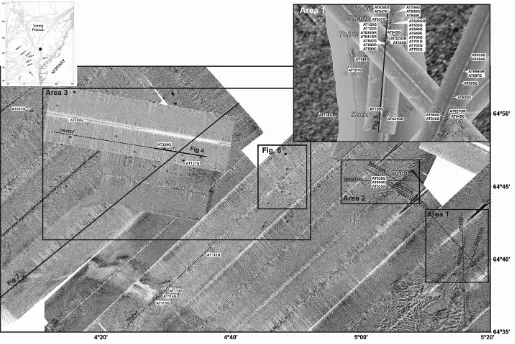
Several fields of high-backscatter patches have been mapped with OKEAN long-range sidescan sonar and single channel airgun
seismic (Fig. 1) during TTR-8 expedition with R/V Professor Loga-chev to the Vøring Plateau (north of the Storegga Slide scar) in 1998 (Kenyon et al., 1999; Bouriak et al., 2000). These features had been interpreted as evidence of seabed fluid discharge. The underwater TV observations, and sampling of sediments, fluids (HC gases and interstitial water) and carbonate crust from seep structures trig-gered pioneer research in geochemistry of fluids and authigenic carbonates in this area (Aloisi and Belenkaya, 1999; Belenkaya, 1999). The subsequent TTR-10, 16 and 17 cruises to the mid-Norwegian Margin also pursued multidisciplinary studies of the newly discovered seep-related structures (Kenyon et al., 2001; Akhmetzhanov et al., 2008; Ivanov et al., 2009). The first
*Corresponding author.
E-mail address:[email protected](M. Ivanov).
Contents lists available atScienceDirect
Marine and Petroleum Geology
j o u r n a l h o m e p a g e : w w w . e l s e v i e r . c o m / l o c a t e / m a r p e t g e o
0264-8172/$ – see front matterÓ2009 Elsevier Ltd. All rights reserved.
identification of a bottom-simulating reflector (BSR) beneath the Vøring Plateau outside the Storegga Slide was done by Bugge (1983). Bugge related this observation to the occurrence of gas hydrates in the sedimentary succession. This interpretation was corroborated by other geophysicists (Mienert et al., 1998; Posewang and Mienert, 1999; Andreassen et al., 2000). The BSR inside the Storegga Slide area was first identified during the TTR-8 cruise (Bouriak et al., 2000), indicating that gas hydrates had adjusted to the post-Storegga Slide temperature–pressure equilibrium conditions.
The vertical subbottom zones of acoustic wipe-outs were identified on most of the TTR seismic records in this area (Kenyon et al., 1999, 2001; Akhmetzhanov et al., 2008). These zones have widths between 150 and 500 m and vertical extensions up to 700– 800 ms TWT below the sea floor. Similar acoustic features were previously reported for this area by other authors (Baas et al., 1994; Evans et al., 1996; Mienert et al., 1998), who believed that they are caused by vertical fluid expulsion.Berndt et al. (2003), Bu¨nz et al. (2003), Gay and Berndt (2007)described such vertical subsurface features as pipes, which can be traced beneath the BSR to a polyg-onal fault system. Some pipes terminate upward in different stratigraphic levels; other ones penetrate the whole succession and reach the seafloor. The pipes are similar to acoustically transparent zones described as chimney structures elsewhere (e.g.Wood et al., 2002; Gay et al., 2006; Ryu et al., 2009). Mienert et al. (1998), Bouriak et al. (2000), Berndt et al. (2003), Bu¨nz et al. (2003)agree that chimneys play the role of conduits for fluids (mainly gas) rising from greater depths and discharging at the sea floor. However the internal structure and infilling material of such chimneys is still
debated. Most of the seismic records demonstrate that the reflec-tors marginal to the chimneys are bending up. This can be explained by a) structural reasons, when rising sediments build diaper-like structures or mud volcanoes (Mienert et al., 1998; Bouriak et al., 2000) or b) by acoustic velocity effect pulling up the reflectors due to the high velocity material (e.g. authigenic carbonates or gas hydrates) located inside these chimneys ( West-brook et al., 2008; Foucher et al., 2009; Ryu et al., 2009). This second hypothesis is strongly supported by the finding of abundant carbonate crusts and nodules in seep structures crowned chimneys on the sea bottom (Kenyon et al., 1999, 2001; Mazzini et al., 2005, 2006; Hovland et al., 2005) and by the recent sampling of gas hydrates from the same structures (Ivanov et al., 2007). However, coring on the Vøring Plateau of sediments from inside of seep-related features revealed two kinds of lithology. The upper part of these cores (varying from tens of cm to first m) usually consists of soft uniform silty clay that is typical for recent (Holocene) sedi-ments broadly distributed in the whole area. The lower intervals are often composed of stiff homogeneous and gas-saturated clays with some silty and sandy admixture, usually more consolidated than the surrounding hemipelagic sediments outside of the seep structures (Kenyon et al., 1999). Micropaleontological studies of the samples from these cores revealed that, beside Quaternary and ice-rafted debris fossils present in all cores, the samples from stiff clay intervals contain Tertiary fossils, mainly of Eocene to Oligocene age (Bouriak et al., 2000). This study suggests that some chimney structures are most probably clay diapirs partially outcropping in the seep structures rather than mineralized (carbonate cemented) or gas hydrate infilled fluid pathways.
Seep-related features in this area have been described as circular or slightly elongated pockmarks (negative relief) (e.g. Mienert et al., 1998; Paull et al., 2008) or as complex pockmarks containing up to 10 m high ridges of methane-derived authigenic carbonate rock inside general depressions (Hovland et al., 2005; Mazzini et al., 2006). Observations of other authors clearly pointed out that there are some definitely positive structures which are elevated above the general level of the sea floor by 10–15 m. Such structures cannot be considered as pockmarks and were inter-preted as outcropping bodies of clay diapirs or as possible mud volcanoes (?) (Kenyon et al., 1999; Bouriak et al., 2000). The prod-ucts of the fluid discharge on the sea bottom and their composition are still poorly studied in this region.
First documented analyses of authigenic carbonates from the Vøring Plateau were reported by Mazzini et al. (2005) that described samples collected from pockmarks during marine expeditions in 1998 and 2000 (Kenyon et al., 1999, 2001). Further studies of authigenic carbonates and seafloor observations have been reported byHovland et al. (2005), Mazzini et al. (2006), and Paull et al. (2008). The concentrations and composition of HC gases in seep-related structures of the Vøring Plateau have been dis-cussed on conferences (Kozlova et al., 1999; Ivanov et al., 2007). The first publication on molecular (4 samples) and isotopic (2 samples) composition of light hydrocarbon gases from sediments in Nyegga pockmarks was done byHovland et al. (2005).Mazzini et al. (2005) analyzed the composition of the fluid inclusions in the authigenic carbonates using Raman spectroscopy.
A detailed study of pore water composition from cores collected within and outside of three pockmarks located on the northern flank of the Storegga Slide was reported byPaull et al. (2008). This study was performed in a field of relatively inactive pockmarks covered with thick hemipelagic sediments. Analysis of sulfate gradients in cores from within and outside of the pockmarks led these authors to the paradoxical conclusion that the flux of methane to the seafloor is presently smaller within the pockmarks than in the adjacent undisturbed sediments. The study of absolute age of the planktonic foraminifera overlying and interlayer with the carbonate nodules and shell-bearing sediments indicate that methane was present on the seafloor within the pockmark prior to 14 ka14C years B.P. (Paull et al., 2008).
The first observations and sampling of living (microbial mats, Pogonophora worms) and dead (chemosynthetic bivalves) fauna on the Vøring Plateau were done during TTR-8 and TTR-10 cruises (Kenyon et al., 1999, 2001; Mazzini et al., 2005). Later on some of these species were determined and described in more detail (Hovland et al., 2005; Paull et al., 2008; Van Gaever et al., 2009); however so far there is still no systematic description and docu-mentation of the chemosynthetic fauna in seep structures of the Vøring Plateau.
The possible occurrence of gas hydrates at the near subsurface of the Vøring Plateau was inferred by many scientists (Mienert et al., 1998; Kenyon et al., 1999; Gravdal et al., 2003; Mazzini et al., 2005; Hovland et al., 2005; Hovland and Svensen, 2006). These speculations were generally based on discoveries of the BSR, seep structures, pathways of fluid migration and presence of a gas hydrate stability zone on the sea bottom. The first sampling of gas hydrates from five seep structures on the Vøring Plateau (CN03, Sharic, Bobic, Tobic, and G11) was performed from R/V Professor Logachev in the summer of 2006 during TTR-16 cruise (Ivanov et al., 2007).
This paper aims to (1) present original multidisciplinary data set collected during three TTR cruises at seep-related structures on the Vøring Plateau, (2) discuss the geochemistry of fluids, gas hydrates, and authigenic carbonates, (3) investigate the origin and present day fluid activity on the seafloor.
2. Geological setting
The study area is located on the boundary between the Vøring and the Møre basins, to the north of the Storegga Slide (Fig. 1). This region developed during several rifting phases in the Mid – Late Jurassic, the Late Cretaceous and before the continental break-up in the Early Eocene (Skogseid and Eldholm, 1989; Ren et al., 2003; Gay and Berndt, 2007). During this period, a large amount of volcani-clastic material was deposited in this area, which is one of the possible sources for the abundant smectites found in the Tertiary sediments (Jordt et al., 2000; Thyberg et al., 2000). The sedimentary succession includes a thick unit of mainly fine-grained Cretaceous deposits, which have been partially drilled on the Ormen Lange Gas Field in the Møre Basin (Stuevold et al., 2003). According to the drilling results, the lowest part of the penetrated successions consists of smectitic claystone, which overlain upward by turbiditic sandstones of the Springar Formation (Maastrichtian) and sand-stones of the Egga Member of the Vaale Formation (Danian). Above these reservoir rocks lies another fine-grained succession of Late Eocene – Early Miocene age (Brygge Formation), changing towards the top from mudstones into biogenic (siliceous) mudstones and ooze (Stuevold et al., 2003).
The Upper Miocene – Lower Pliocene Kai Formation is domi-nated by clayey ooze with very high smectite content (Forsberg and Locat, 2005). The Upper Pliocene – Pleistocene Naust Formation was deposited during glacial – interglacial palaeoclimatic fluctua-tions and contains interlayered contourite deposits and glacial debris-flow deposits (Stuevold and Eldholm, 1996; Hjelstuen et al., 1999; Nygård et al., 2005). Holocene deposits up to several meters thick cover the entire area.
During the Oligocene and Miocene time this part of the Norwegian margin underwent a period of compression resulting in several north-south elongated dome structures (Stuevold and Eldholm, 1996; Hjelstuen et al., 1997; Vågnes et al., 1998).
The entire region is characterized by a broad distribution of polygonal fault systems. Polygonal faults are a non-tectonic class of faults recognized in more then fifty sedimentary basins in the world (Cartwright et al., 2003). They have mainly been described from sedimentary successions that are dominantly fine grained and are typically found in smectite-rich claystones or biogenic mudstones (Stuevold et al., 2003). The origin of polygonal faults has been described as a process of compaction and volumetric contraction of fine-grained sediments leading to pore fluid expul-sion (Cartwright and Lonergan, 1996). The volume of fluids expelled from the host sediments might be as much as 60% (Verschuren, 1992). Thus, polygonal faults are genetically related to fluid generation in the host formation and can act as efficient pathways for fluids migrating from greater depths. Three major tiers of polygonal faults were recognized and described in the study region. Two tiers had been identified in the vicinity of the Ormen Lange field using interpretation of 2D and 3D seismic and deep explor-atory well data (Stuevold et al., 2003). These two separate horizons of polygonal faults are stratigraphically bound units. The top of the Vaale horizon (Paleocene) is transected by faults developed within the Late Cretaceous and Paleocene succession (Tier 1). Maximum fault throw values measured at this horizon reach 70–80 m. The Opal CT horizon (with the Brygge Formation) is transected by faults developed within the Eocene to Miocene interval (Tier 2) (Stuevold et al., 2003).
faults exists at the base of the overlying Naust Formation (Upper Pliocene – Pleistocene). These faults abruptly terminate upward below a thick interval of debris flow. The high interconnectivity between faulted layers allows the fluids to rich shallower depth, forming well-expressed pipes and pockmarks on the sea floor (Gay and Berndt, 2007).
3. Materials and methods
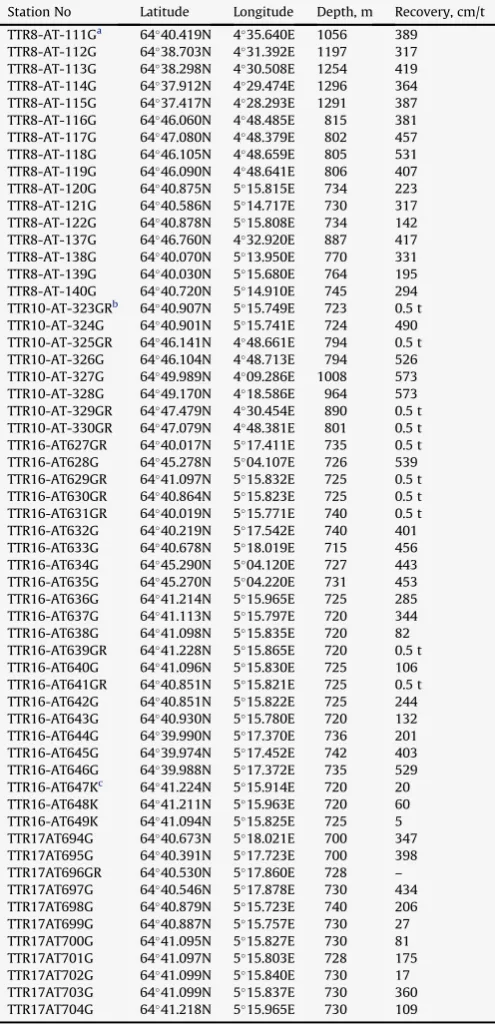
A total of 1935 km of single channel seismic, 1185 km long-range sidescan sonar, 115 km deep-towed sidescan sonar with subbottom profiler, and 15 h of sea bottom TV observations have been obtained on Southern Vøring Plateau during the TTR-8, 10 and 16 cruises. Sampling material consists of 47 gravity cores and 11 TV controlled grab samples collected predominantly within fluid escape struc-tures (Table 1).
The investigations were conducted on the R/V Professor Loga-chev equipped with long-range OKEAN 9 kHz sidescan sonar, single channel airgun seismic system, MAK-1M and OREtech deep-towed sidescan sonars operating at 30 and 100 kHz frequencies with integrated 5 kHz subbottom profiler. Seafloor observations of the seep-related structures were performed with the digital under-water TV system. Sampling operations were completed with a 6 m long, 168 mm diameter, 1.5 tonne gravity corer, and a large TV controlled grab sampler. The ship was equipped with short base underwater navigation system Sigma-1001M and dynamic posi-tioning system ASUD. The sedimentary cores were opened onboard, split, subsampled for different kinds of analysis, photo-graphed and described.
3.1. Hydrocarbon gas
Subsampling for hydrocarbon gas analysis and pore water was done approximately each 10–15 cm unless relevant lithological changes were observed. Head-space technique was used to extract gas from the sediments (Bolshakov and Egorov, 1987). The molec-ular composition of the C1–C5hydrocarbons including unsaturated (ethene, propene, butenes and pentenes), isomeric and cyclic hydrocarbons were analyzed using a gas chromatograph (GC) Trace Ultra equipped with an on-column injector and a flame ionization detector. Samples were separated on a 50 m capillary column CP-Al2O3/Na2SO4 0.53 mm, 10
m
m. Concentration was calculated according to the volume of wet sediment.The carbon isotope ratios from hydrocarbon gases were measured on a Finnigan Delta Plus XL mass spectrometer with an HP 5890 GC and a GC-combustion interface. The carbon stable isotope values are reported in the&relative to Vienna Pee Dee Belemnite (VPDB) standard. The hydrogen isotopic composition of methane from gas hydrates was determined by a GC-C-IRMS system. The international standard NGS-2 and an in-house stan-dard were used for testing accuracy and precision. Repeated anal-yses of standards indicate that the reproducibility of
d
D values is better than 10&PDB (2s
).3.2. Pore water
Extraction of pore water from the sediments was performed onboard with a centrifugal device (3000 rpm max.). The samples were then refrigerated and analyzed on shore.
The geochemistry of the water samples were determined in VNIIOkeangeologia (St. Petersburg) using a method described by Reznikov and Mulikovskaya (1956)andGieskes et al. (1991). Cl,
Ca2þ
, Mg2þ
were determined by titration (argento-, acide-, and complexometry, respectively), SO2
4 species was determined by weight, and Naþand Kþusing flame-photometry.
Oxygen (
d
18O) isotopic analyses of the pore water were carried out in the Centre of Isotopic Research of VSEGEI (St. Petersburg). Measurements were determined using an IRM–MS method by means of a DELTA plus XL mass-spectrometer with a Gas Bench II preparative device (ThermoFinnigan production) working on-line and providing isotope exchange between H2O and CO2. Random error during determination of oxygen isotopic composition (1s
) in the water was in the range of 0.1–0.2&. The results of isotopic measurements are represented in per-mil delta notations (&)Table 1
Sampling stations position of TTR cruises.
Station No Latitude Longitude Depth, m Recovery, cm/t
TTR8-AT-111Ga 64
40.419N 4
35.640E 1056 389
TTR8-AT-112G 6438.703N 431.392E 1197 317
TTR8-AT-113G 6438.298N 430.508E 1254 419
TTR8-AT-114G 6437.912N 429.474E 1296 364
TTR8-AT-115G 6437.417N 428.293E 1291 387
TTR8-AT-116G 6446.060N 448.485E 815 381
TTR8-AT-117G 6447.080N 448.379E 802 457
TTR8-AT-118G 64
46.105N 4
48.659E 805 531
TTR8-AT-119G 6446.090N 448.641E 806 407
TTR8-AT-120G 6440.875N 515.815E 734 223
TTR8-AT-121G 6440.586N 514.717E 730 317
TTR8-AT-122G 6440.878N 515.808E 734 142
TTR8-AT-137G 6446.760N 432.920E 887 417
TTR8-AT-138G 6440.070N 513.950E 770 331
TTR8-AT-139G 64
40.030N 5
15.680E 764 195
TTR8-AT-140G 6440.720N 514.910E 745 294
TTR10-AT-323GRb 6440.907N 515.749E 723 0.5 t
TTR10-AT-324G 6440.901N 515.741E 724 490
TTR10-AT-325GR 6446.141N 448.661E 794 0.5 t
TTR10-AT-326G 6446.104N 448.713E 794 526
TTR10-AT-327G 6449.989N 409.286E 1008 573
TTR10-AT-328G 64
49.170N 4
18.586E 964 573
TTR10-AT-329GR 6447.479N 430.454E 890 0.5 t
TTR10-AT-330GR 6447.079N 448.381E 801 0.5 t
TTR16-AT627GR 6440.017N 517.411E 735 0.5 t
TTR16-AT628G 6445.278N 504.107E 726 539
TTR16-AT629GR 6441.097N 515.832E 725 0.5 t
TTR16-AT630GR 6440.864N 515.823E 725 0.5 t
TTR16-AT631GR 6440.019N 515.771E 740 0.5 t
TTR16-AT632G 6440.219N 517.542E 740 401
TTR16-AT633G 6440.678N 518.019E 715 456
TTR16-AT634G 6445.290N 504.120E 727 443
TTR16-AT635G 6445.270N 504.220E 731 453
TTR16-AT636G 6441.214N 515.965E 725 285
TTR16-AT637G 64
41.113N 5
15.797E 720 344
TTR16-AT638G 6441.098N 515.835E 720 82
TTR16-AT639GR 6441.228N 515.865E 720 0.5 t
TTR16-AT640G 6441.096N 515.830E 725 106
TTR16-AT641GR 6440.851N 515.821E 725 0.5 t
TTR16-AT642G 6440.851N 515.822E 725 244
TTR16-AT643G 6440.930N 515.780E 720 132
TTR16-AT644G 64
39.990N 5
17.370E 736 201
TTR16-AT645G 6439.974N 517.452E 742 403
TTR16-AT646G 6439.988N 517.372E 735 529
TTR16-AT647Kc 6441.224N 515.914E 720 20
TTR16-AT648K 6441.211N 515.963E 720 60
TTR16-AT649K 6441.094N 515.825E 725 5
TTR17AT694G 6440.673N 518.021E 700 347
TTR17AT695G 6440.391N 517.723E 700 398
TTR17AT696GR 6440.530N 517.860E 728 –
TTR17AT697G 6440.546N 517.878E 730 434
TTR17AT698G 6440.879N 515.723E 740 206
TTR17AT699G 6440.887N 515.757E 730 27
TTR17AT700G 6441.095N 515.827E 730 81
TTR17AT701G 64
41.097N 5
15.803E 728 175
TTR17AT702G 6441.099N 515.840E 730 17
TTR17AT703G 6441.099N 515.837E 730 360
TTR17AT704G 6441.218N 515.965E 730 109
aGravity corer.
b TV-cotrolled grab.
relative to SMOW standard. The
d
D composition of gas hydrate water was determined by a Micromass Optima IRMS. Average value for GISP from IAEA during 2003–2004 isd
DVSMOW¼ 189.71 0.89&(one standard deviation). ‘‘True’’ value is189.730.9&.3.3. Total organic carbon content
TOC content was measured from sediments recovered by gravity corer from the same interval as used for gas and pore water studies. 10 g of dry material was processed by acid (10% HCl) to remove inorganic carbon. Afterwards, cleaned and dried samples were burned at 1000C in oxygen flow. The results are presented in
weight%.
3.4. Gas hydrates
Detail photo and macro-description of the gas hydrate samples was done on board. Some of the collected gas hydrates were dissociated for gas and water analyses (see above), while the remaining part was stored at 25 C for further laboratory
investigations.
Frozen gas hydrate was imaged using a GE Lightspeed Ultra CT 99_OC0 spiral computed tomography scanner, with an 8 sensor system (Majorstuen Røntgen Capio, Oslo, Norway). The thickness of the scanned slices was 0.625 mm, and more than 100 scans were made throughout the sample.
3.5. Authigenic carbonates
Authigenic carbonates were studied using both optical and scan electronic microscopes. X-ray diffraction analyses were performed on bulk carbonate samples to distinguish the mineralogical composition and dominant carbonate phase. Further analyses to
determine with more accuracy the mineralogical composition require microprobe investigations.
Carbon and oxygen isotopic analyses were completed on bulk carbonate samples. Carbonate cements were ground and dissolved with a 0.1 ml 100% H3PO4 solution for two hours at 30 C in a vacuum environment. The released CO2was transferred to a Fin-nigan MAT DeltaXP IRMS, for determination of
d
13C andd
18O. Results are reported in & relative to the VPDB standard. The precision ford
13C is0.1&and ford
18O0.2&.4. Results
4.1. Geophysical survey
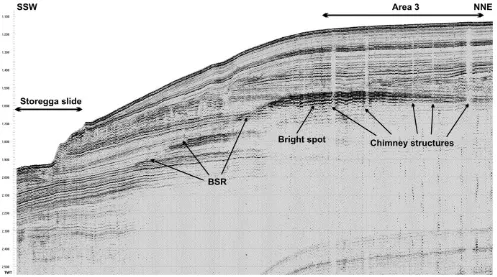
Digital mosaic of the long-range OKEAN sidescan records show numerous high-backscattering patches of different sizes and shapes (Fig. 1). Their positions are in good accordance with loca-tions of pockmark structures reported by other authors (Mienert et al., 1998; Bouriak et al., 2000; Bu¨nz et al., 2003; Brown et al., 2006). Besides isolated structures there are several dense fields of such features on long-range sidescan sonar mosaic. We selected for our study three areas characterized by different orientation and level of the backscattering from seep structures (Fig. 1). Seismic lines crossing these features show vertical acoustically transparent zones (Fig. 2). These chimney-like structures usually penetrate the BSR and enhanced reflectors that correspond to free gas accumu-lations, however their termination cannot be observed on single channel seismic.
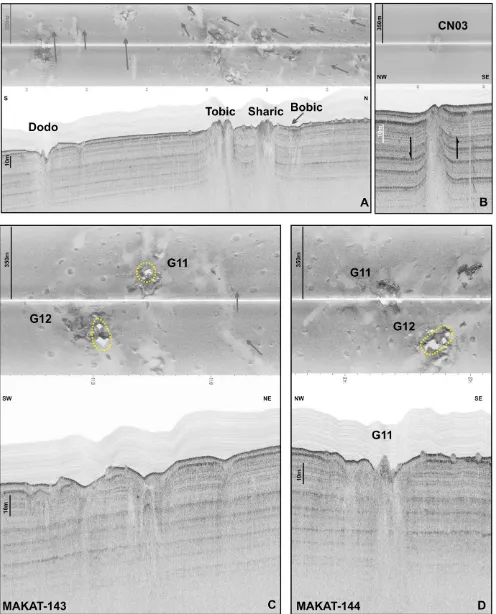
Deep-towed 100 kHz sidescan sonar records accompanied with 5 kHz subbottom profiler demonstrate the complex structure of the sea bottom corresponding to outcropping above vertical wipeout zones (chimneys). Some of them undoubtedly have positive relief – rising above surrounding seafloor level from 8 to 15 m (Fig. 3A). On sidescan image these features have rather fanciful shapes slightly
Fig. 2.Singe-channel seismic line (PSAT187) across Storegga slide and Area 3 showing BSR, chimney-like structures and bright spots (free gas accumulations). Location of the line is
elongated in accordance with the general orientation of the chains of the small-scale sea mounds (Fig. 3A). The positive in relief structures have a relatively strong backscatter (dark), the negative ones have weak backscatter (light) and normal sea floor (with flat relief) has medium (grey) backscatter. On the profiler record the positive structures are surrounded by some depressions. Interest-ingly, the vertical acoustic chimneys on the subbottom profiler record correspond to topographic highs and not to depressions (pockmarks?) (Fig. 3A). We also observed that some depressions are linear extend in accordance with the positive structures, and occasionally are not directly related to the seep features (Fig. 3A). Most of the profiler records indicate that the uppermost sedi-mentary layer representing Holocene sediments is pinching out and absent on topographical highs suggesting recent activity of these structures. MAKAT-143 line (Fig. 3C) is located between and very close to two fluid escape structures (G11 and G12). On the subbottom profiler record we observe structural depressions looking like common pockmarks. However, the high level of back-scattering and long acoustic shadows imaged for both structures indicate that these are topographic highs with rather sharp relief surrounded by gentle depressions. The arrows inFig. 3C (time mark 11:41) indicate the weak backscatter linear depression that abruptly changes orientation by 45 degrees. We interpret this as the trace of a small fault (probably polygonal type?). The next line (Fig. 3D) crosses structure G11 almost in the center, clearly demonstrating structural elevation surrounded by topographic depression.
Area 2 is located to the north-west of Area 1 (Fig. 1) and generally looks less active. It is covered by thicker recent sediments and has a limited number of fluid escape structures. One of the largest in this area is the CN03 structure that was crossed with the 100 kHz sidescan sonar (Fig. 3B). The high-resolution acoustic subbottom profiler record shows the different position of the
stratigraphic horizons on the opposite sides of this structure. All acoustic reflectors located on south-eastern side of the structure (including the sea bottom reflector) are obviously shifted upward by about 5 m. This fact suggests that CN03 is located on some fault. Remarkable that once again the acoustically transparent chimney structure (interpreted as a fluids migration pathway) is located below the topographic high, but not below the pockmark, situated on the south-east side of positive structure. All bounding reflectors, including sea bottom reflector, are pulled up suggesting structural origin of this feature (Fig. 3B).
Fluid discharge structures located to the west of CN03 (Area 3, seeFig. 1) are characterized by even less level of fluid activity than previously described. The low backscattering observed on deep-towed 30 kHz sidescan sonar images suggests that these structures are buried under thick recent sediments and are not currently active (Fig. 4B). Some high-backscattering dots inside and outside the structures can correspond to previous periods of activity and probably represent remnants of the crust and/or fossils, or just large dropstones covered with recent sediments.
The 9 kHz acoustic signal from OKEAN produces a much stronger backscatter from the same features, than does the 30 kHz OREtech (Fig. 4A). Moreover some strong backscattering patches documented on the long-range OKEAN sonograph cannot be observed on the OREtech deep-towed record. Most probably it reflects deeper penetration below seafloor of low frequency OKEAN signal in comparison with OREtech one. Deep-towed acoustic profiler record confirms thick, well-stratified and undisturbed sedimentary cover (Fig. 4B).
4.2. Seafloor observation
Seafloor video observation revealed common features in all the visited fluid escaping structures except for those in Areas 2 and 3
Fig. 4.Fragment of long-range sidescan sonar OKEAN line (A) and high resolution 30 kHz OreTech line with 5 kHz subbottom profiler (B) across Area 3. Outline position of OreTech
(Fig. 1) where thick Holocene sediments were observed and no obvious sign of activity was detected. Authigenic carbonates either as laterally extensive pavements (Fig. 5A) or as broadly distributed large (several cubic meters sized) blocks (Fig. 5B), were seen throughout the structures. Some of these blocks are isolated, having sharp and angular surfaces that suggest their fragmentation by faulting (cracks) and uplifting during post-precipitation periods of deformation. Commonly authigenic carbonates are colonized by sea spiders, star fish, cnidarians, soft corals, crinoids, basket stars, occasional corals and cemented shells. Bivalves (and subordinate gastropods) are locally extremely abundant but only represented by dead shells loose or concretioned. Numerous pingo-like structures described previously by Hovland et al. (2005) were observed randomly distributed through these seep areas. Microbial colonies were seen thriving mainly on pingoes intimately associated with Pogonophora (Fig. 5C). Fields of dead shells were seen in the flat areas between the carbonate blocks (Fig. 5D). Dropstones are also commonly outcropping on the seafloor.
4.3. Seafloor sampling and authigenic carbonate variety
Sampling was carried out at different locations within the study area including Storegga Slide, hemipelagic sediments on the Vøring Plateau, but predominantly it was concentrated in the inner parts of relatively active fluid escape structures. The lithology of the back-ground hemipelagic cores is very uniform through the whole area and very similar to the cores described byPaull et al. (2008). They are composed of olive grey clay and silty clay without distinct contacts between layers. Some black horizons represented by len-ses and discrete stains enriched with hydrotroilite (iron mono-sulfide), are common for all hemipelagic cores. The penetration of the background cores was usually limited by the length of the
gravity corer (6 m) or by large dropstones randomly distributed in the sedimentary succession. The only remarkable difference observed in the hemipelagic cores was the depth of the hydro-troilite layers (commonly two layers). These intervals were commonly located between 3 and 5 m bsf in Areas 2 and 3 and between 0 and 3 m in Area 1 (Fig. 1). This observation suggests that these areas had significantly different sedimentation rate during the Holocene.
Sampling of the seep structures poses significant challenges to the navigation of the corer and accurate positioning of the ship at sampling sites. The sampling targets are usually too small, just several meters in diameter, and do not express in the bottom relief properly, thus coring operations with conventional equipment navigated from the ship became a matter of good luck. Two structures cored in Area 3 provide a good example (Fig. 6A). The first structure, located to the north, was cored four times: by the R/ V Professor Logachev in 1998 (sampling station AT 117G) and by the R/V Knor in 2004 (sampling stations GGC-1, GGC-2 and GGC-3) (Paull et al., 2008). All sampling stations were intended to be located inside of the structure at a distance of w140–160 m between each other. However, just one core (AT 117G) clearly demonstrated fluid activity (Fig. 6A). The second structure is located 1.8 km to the south of the first one. Four gravity cores and one TV-grab sample were taken by the R/V Professor Logachev on this structure (Fig. 6A). The core AT 116G most probably missed the target and recovered a typical succession of hemipelagic sediments that is very characteristic for the entire area. According to the ship navigation two other cores (AT 118G and AT 119G) sampled the inner part of the structure about 25 m from each other. Neverthe-less these two cores were significantly different. AT 119G looked more like background (similar to other hemipelagic cores of this area) except for one hydrotroilite-rich layer located at an unusual
Fig. 5.Selected seafloor images from some of the seep structures (A–C – Sharic (AT629GR); D – Tobic (AT630GR)). Image vieww1.2 m; A – laterally extensive pavements of
shallow depth (1.5–3.0 m bsf). Core AT 118G was also contained common hemipelagic sediments, but these sediments were strongly reduced. Abundant colony of Pogonophora was found in the top layer of this core, a strong smell of H2S was detected throughout and two horizons of carbonate crust and nodules were documented at 5.0 and 5.3 m bsf (Fig. 6A). These observations suggest some localized small-scale activity ongoing at this
structure. Generally, the seep structures situated in the described area are not presently active and we in principle agree with conclusions of Paull et al. (2008).
CN03 is located in a small field of seep structures (Area 2 on Fig. 1) about 12 km to the east of the area described above. This circular feature with a diameter of about 300 m, is characterized by relatively low backscattering, suggesting that it is partially covered
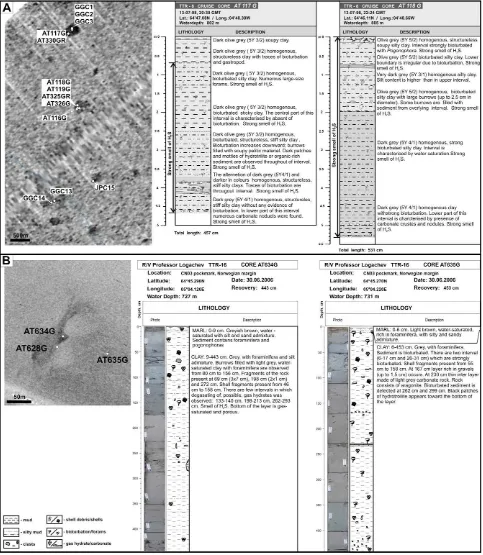
Fig. 6.A – Core logs of stations AT117G and AT118G (Area 3) indicating ongoing seep activity (living Pogonophora, strong smell of H2S, presence of authigenic carbonate crusts).
Locations of the TTR andPaull et al. (2008)sampling stations are shown on the left side of the figure. B – Core logs of stations AT634G and AT635G taken from the CN03 structure,
with recent hemipelagic sediments and absence of carbonate crust outcropping on the seafloor. Two gravity cores were taken from inside this structure and one from the periphery (Fig. 6B). All three cores were rather different from each other. The longest core AT 628G (539 cm long) targeted the central part of CN03 and did not show any signs of present or past gas seepage. The recovery con-sisted of common hemipelagic sediments similar to those broadly distributed through this area. Core AT 634G (443 cm long) collected from the highest point of the structure, contained predominantly grey clay with shell fragments at different intervals (Fig. 6B). The uppermost 10 cm were abundant with Pogonophora worms and dead foraminifera. Intensive bubbling typical for dissociation of gas hydrate crystals, was observed at several intervals in this core. The third core (AT 635G) was taken in close vicinity of CN03. This core also consisted of hemipelagic clay sediments with shell fragments in upper half (Fig. 6B). A distinct 6 cm thick layer of the pure botryoidal aragonite was documented within the clayey sediment at 240 cm bsf. This aragonite layer contains some bacteria filaments and looks very fresh. We suggest that aragonite precipitation is currently ongoing at this interval.
A field of largest and more active seep structures is located to the south-east of CN03 in Area 1 (Fig. 1). A total of 29 gravity cores, 3 kasten cores and 7 large TV grab samples were taken from this area, in particular from the central parts of the seep structures. Sedi-mentary cores are of different length and show larger variety in lithology in comparison with Areas 2 and 3. In addition to the silty-clayey hemipelagic succession described above, we often recovered thin layers of coarser sediments including sandy clay, sand and even gravel. Carbonate crust, nodules and shell fragments were documented at different stratigraphic levels throughout many cores (Fig. 7A). At the bottom of several cores we observed stiff mud probably representing older more lithified (compacted) sediments intruded into an overlying soft and very plastic material (Fig. 7B). In some places, especially on topographic highs, shallow penetration of gravity corer is not only because of the presence of carbonate
crust or hydrate cemented layers, but also due to stiff deposits underlying soft sediments. Characteristic degassing sediment features including locally disturbed sediments, increased macro porosity in muddy deposits, and anomalous water saturated sedi-ments were also commonly seen (Fig. 8).
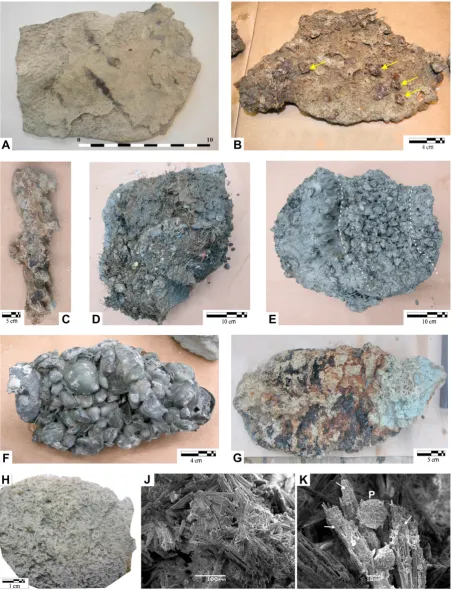
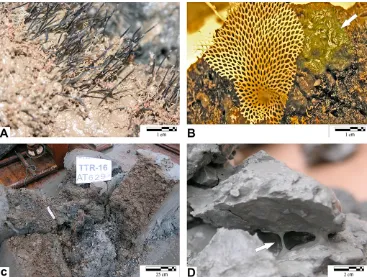
A large collection of authigenic carbonates was sampled from seep structures. These carbonates have various shapes, some of which are identical to the one described byMazzini et al. (2005, 2006). The samples comprise concretions, chemoherms, tabular, flamed, dendritic and irregular shaped blocks (Fig. 9). Semi-lithified carbonate-rich clayey intervals were also retrieved in deeper units usually associated with gas rich sediments. In particular, sampling the pingo sites (Tobic structure) with a large TV grab allowed investigating their internal structure. Below the Pogonophora-rich marl and carbonates present on the sea floor (Fig. 10A–B) the stratigraphy is not uniform (Fig. 10C). Pingoes are commonly characterized by a central fracture presumably acting as the main pathway for fluid seepage. This fracture is defined by semi-lithified cemented clayey sediment and is filled by carbonate-cemented clams. In addition whitish filamentous microbial colo-nies are present within this carbonate-rich sediment suggesting that AOM is currently ongoing (Michaelis et al., 2002; Hinrichs and Boetius, 2002; Joye et al., 2004) (Fig. 10D). Closer to the surface the shells are not cemented and the sediment is loose, soupy and extremely rich in framboidal pyrite. Most of the sampling stations revealed strong smell of H2S within the sediment.
4.4. Macrofauna
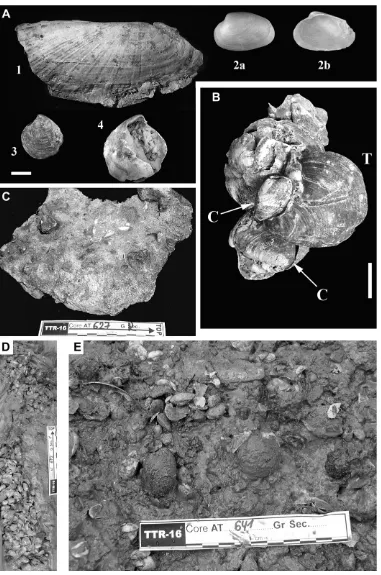
A diverse soft sediment seep macrofauna is documented from the study area at various places. With the noticeable exception of Pogonophora (Fig. 10A) our research recorded only pre-Modern dead and subfossil bivalves (Fig. 11A). The TV-controlled grab taken from the Tobic structure (AT641GR) recovered solemyid (Acharax sp.), thyasirid, vesicomyid (cf. Calyptogena sp.) bivalves, and
buccinid gastropods. All bivalves belong to families known to live upon chemosymbiosis by hosting intracellular sulphide oxidizing bacteria (Cavanaugh, 1983; Fisher, 1990; Reid, 1990; Distel, 1998; Stewart and Cavanaugh, 2006; Taylor et al., 2007). At same loca-tions (Tobic structure: AT323GR, AT698G, AT641GR) non-chemo-synthetic buccinid gastropods (e.g.,Beringius) were present in the death shell assemblage, documenting the occasional visit to cold seeps by mobile opportunistic species.
The shell material shows a variety of diagenetic preservations ranging from relatively fresh but dull shells (Fig. 11A,B) to heavily corroded, brown-stained and infilled shells, often concretioned (Fig. 11B) or encased into weakly carbonate-cemented sediments (Fig. 11C).
4.5. Geochemical study
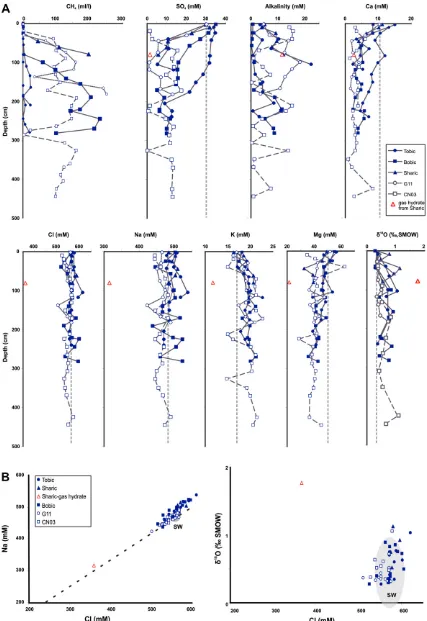
4.5.1. Pore water analyses
The concentration of the main cations and anions vs. depth are plotted inFig. 12A and Table 2. The sulfate depletion generally occurs within the upper 30–200 cm bsf and usually coincides with an increase of methane concentration, thereby marking the sulfate–methane interface (SMI). Sulfate dramatically decreases with depth up to 10–15 mM in cores from Sharic (AT638G), G11 (AT644G), and Tobic (AT120G, AT643G). In case of G11 sulfate depletion is observed at the first 100 cm bsf (up to 1 mM), below that level concentrations increase up to 13 mM. A low gradient is observed at station AT642G taken on the slope of Tobic. SO4 measurements from Area 3 (AT118G) show sea water signature up
to 450 cm bsf. CN03 structure revealed a SO4profile with several variations in concentration fluctuating between zero and 15 mM.
Alkalinity measurements reveal a general increase towards the bottom of the cores (Fig. 12A, Table 2). A peak in alkalinity concentration is observed at 100 cm in sediments from G11 structure, which corresponds to a minimum concentration in SO4. CN03 instead shows high alkalinity in the uppermost sediments decreasing to zero in interval 70–110 cm; two peaks with high alkalinity concentrations coincide with SO4minimum, suggesting active microbial processes of sulfate reduction-anaerobic methane oxidation.
Downsection decrease in abundance of Ca and Mg ions as well as increase in K is observed in all stations. K ions probably originate from the dissolution of K-bearing minerals (Matveeva et al., 2003). Gradual increase of Cl and Na was observed at Tobic and Sharic structures (Fig. 12A,Table 2). Nevertheless Na/Cl, Ca/Cl and Mg/Cl ratios generally follow the seawater composition trend (Fig. 12B).
Pore water
d
18O ranges from 0.29 to 1.14&showing an overall gradual increase (Fig. 12A,B, Table 2) from bottom water values (d
18Ow0.35&). Based on the distribution along the cores of ions concentrations and pore water oxygen isotopic values (Fig. 12A,B) we can conclude, that there is no any water flux from deep sedi-mentary sequences at least at the present time.4.5.2. Hydrocarbon gases
Methane concentration at the reference stations (113G, AT-114G) is up to 0.01 ml/l (in average 0.004 ml/l) (Fig. 13,Table 3). Ethane and propane are also detected. High level of unsaturated
Fig. 9.Variety in authigenic carbonates collected from Area 1(A, B – G11; C, G – Bobic; D–F – Sharic) and Area 2 (H–K – CN03). Note the discoloration and corrosion of the oxidation surfaces on samples collected at or close to the sea floor (i.e. images A, B, D, G). A – Tabular shaped forming pavements consisting of laminated aragonite layers devoid of hem-ipelagic sediments; B – Irregular slab containing hemhem-ipelagic sediments, precipitating in the subsurface and cementing occasional clams (arrowed) that were previously thriving on the seafloor; C – Elongated and irregular shaped authigenic carbonate, the external surfaces present embayment and vesicular features; D – Top part of a large carbonate block collected from a pingo structure showing Pogonophora colony on the top surface (brownish) with occasional shells. The remaining part of the block consists carbonate-cemented
shells and pyrite rich clayey sediments; EBottom part of a large block of carbonate-rich clayey sediment with cemented chemosymbiotic shells. Shells are distributed on
homologues (ethene, propene) is observed: C2H6/C2H4 ¼ 0.05, C3H8/C3H6¼0.3, which points toin situmicrobial origin of the gas.
In spite of considerable loss of methane and its homologues during core recovery and sub sampling procedure (up to 99.8% Dickens et al., 1997) measured concentration of hydrocarbons in sediments from seep sites are significantly higher than in the reference stations. Seep structures of Area 3 showed methane concentration up to 1.2 ml/l (two times higher than reference values). Unsaturated homologues are observed only in the upper-most sediments and in the lower 200 cm their concentrations are below the detection limit (Table 3).
Hydrocarbons distribution in cores from seep structures of Areas 1 and 2, are shown in Fig. 13. Methane concentration generally increases with the depth in all studied structures reach-ing 270 ml/l at Tobic structure and 150 ml/l at CN03.
All measured gases are characterized by dry composition. Their wetness is about 0.02% in average. Nevertheless there is strong enrichment in ethane and propane at the investigated structures compared with the reference stations (Fig. 13,Table 3).
The TOC content in the sediments is relatively low and varies from 0.34 to 0.89% (av. 0.57%) (Table 3). There is no remarkable difference observed between the reference cores and those from the seep site. Also no correlation was seen between TOC content and HC gas concentration.
All structures revealed much depleted
d
13CCH4 values varyingbetween 68 and 94.6& (Table 3). The isotopic variation observed in the uppermost units is ascribed to microbial processes (Fig. 13).
d
13C of ethane, measured in sediments from two seep structures, varies from33.6&(120 cm) to50.8&(170 cm) in G11, and38.6& (245 cm) in Bobic, respectively.d
13CCO2 showslow values ranging from20 to36.5&.
4.5.3. Gas hydrates
Small (<millimetres in size) gas hydrates aggregates of crystals
were seen rapidly dissociating during the retrieval and extrusion of cores from Bobic, Tobic, G11 and CN03 (Ivanov et al., 2007; Akhmetzhanov et al., 2008). In these cores strong bubbling and millimetric gas hydrate crystals were observed either in the bottom part or in some specific intervals. These zones of the core revealed the presence of typical gas hydrate dissociation features such as water saturated vesicles and foamy or soupy texture of the sediment (Fig. 8).
The central part of the Sharic structure is characterized by a complex area of positive topographic relief. Two stations targeting the topographically highest location (stations AT638G and AT640G) sampled distinct gas hydrate-rich intervals mainly in the bottom part of thew1 m long cores (80–100 cm bsf). These gas hydrates appear to form packages of few millimetres thick subparallel plates within the clayey sediment and likely prevented further penetra-tion of the corer (Fig. 14A,B). Ignition test on these sediments samples containing hydrates showed flames burning for several minutes despite the high clay content and the small amount of gas hydrates visible with naked eyes (Fig. 14C,D). Temperature measurements from the core catcher gave0.4C and strong smell
of H2S was detected at each of these stations. Similar hydrate bedded structure was observed and described in the cores of the Sea of Okhotsk, Caspian Sea, Gulf of Mexico, the Black Sea (Ginsburg and Soloviev, 1998). Such kind of hydrate structure usually forms under specific conditions when the gas migrates along distinct layers and the pore water is segregated from the host sediments.
The gas from dissociated gas hydrates (Sharic structure) mostly consists of methane (up to 97.97%) with minor amount of ethane (up to 0.019%) and propane (up to 0.0003%). 0.001% of H2and up to 2% of N2were also detected.
d
13CCH4shows strong depletion (aboutFig. 11.A – Documented chemosynthetic bivalves from Southern Vøring Plateau: 1) Acharax sp. (AT641GR- Tobic); 2) cf. Calyptogena sp. (AT630GR- Tobic): 2a, exterior of left valve, 2b, interior of right valve, 3) Thyasirid sp. (AT641GR, articulated shell, exterior of left valve); 4) Thyasirid sp. (AT641GR), articulated shell, exterior of right valve: note infilling of
carbonate-cemented mudstone; Bar¼1 cm. B – Carbonate-cemented concretions embedding a chemosynthetic bivalve cluster collected from the Tobic structure (AT641GR); c¼cf
Calyptogena; t¼Thyasirid. C – Slab of carbonate-cemented mudstone encasing various chemosynthetic bivalves, such articulated vesicomyids (cf Calyptogena), lucinids and
thyasirids (AT627GR-G11); an example of a precursor of Cenozoic macrofossiliferous methanogenetic limestones. D – Dense vesicomyid (cf Calyptogena) bivalve shell assemblage
embedded in soft mud sediment cored at Tobic structure (AT642G). EDiverse bivalve death assemblage including articulated and disarticulated shells of chemosynthetic taxa,
Fig. 12.A – Pore water composition and methane concentration along the cores taken from different seep structures (dotted lines – sea water composition); B – plots of Cl versus Na
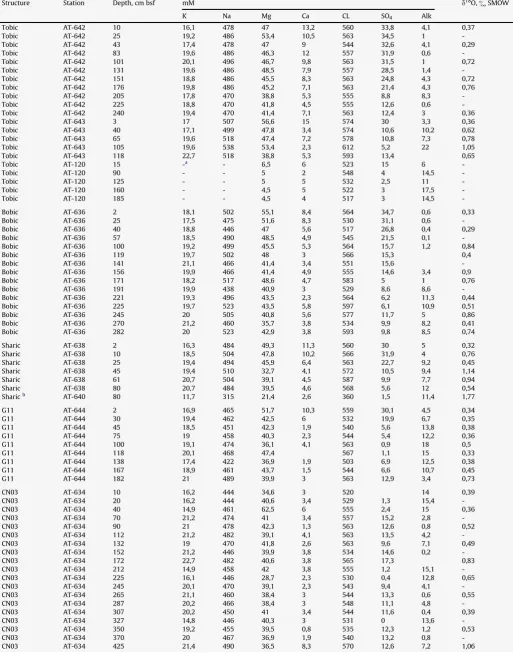
Table 2
Main cation and anion concentrations andd18O values of pore water collected in the cores from different locations.
Structure Station Depth, cm bsf mM d18O,&SMOW
K Na Mg Ca CL SO4 Alk
Tobic AT-642 10 16,1 478 47 13,2 560 33,8 4,1 0,37
Tobic AT-642 25 19,2 486 53,4 10,5 563 34,5 1
-Tobic AT-642 43 17,4 478 47 9 544 32,6 4,1 0,29
Tobic AT-642 83 19,6 486 46,3 12 557 31,9 0,6
-Tobic AT-642 101 20,1 496 46,7 9,8 563 31,5 1 0,72
Tobic AT-642 131 19,6 486 48,5 7,9 557 28,5 1,4
-Tobic AT-642 151 18,8 486 45,5 8,3 563 24,8 4,3 0,72
Tobic AT-642 176 19,8 486 45,2 7,1 563 21,4 4,3 0,76
Tobic AT-642 205 17,8 470 38,8 5,3 555 8,8 8,3
-Tobic AT-642 225 18,8 470 41,8 4,5 555 12,6 0,6
-Tobic AT-642 240 19,4 470 41,4 7,1 563 12,4 3 0,36
Tobic AT-643 3 17 507 56,6 15 574 30 3,3 0,36
Tobic AT-643 40 17,1 499 47,8 3,4 574 10,6 10,2 0,62
Tobic AT-643 65 19,6 518 47,4 7,2 578 10,8 7,3 0,78
Tobic AT-643 105 19,6 538 53,4 2,3 612 5,2 22 1,05
Tobic AT-643 118 22,7 518 38,8 5,3 593 13,4 0,65
Tobic AT-120 15 -a - 6,5 6 523 15 6
-Tobic AT-120 90 - - 5 2 548 4 14,5
-Tobic AT-120 125 - - 5 5 532 2,5 11
-Tobic AT-120 160 - - 4,5 5 522 3 17,5
-Tobic AT-120 185 - - 4,5 4 517 3 14,5
-Bobic AT-636 2 18,1 502 55,1 8,4 564 34,7 0,6 0,33
Bobic AT-636 25 17,5 475 51,6 8,3 530 31,1 0,6
-Bobic AT-636 40 18,8 446 47 5,6 517 26,8 0,4 0,29
Bobic AT-636 57 18,5 490 48,5 4,9 545 21,5 0,1
-Bobic AT-636 100 19,2 499 45,5 5,3 564 15,7 1,2 0,84
Bobic AT-636 119 19,7 502 48 3 566 15,3 0,4
Bobic AT-636 141 21,1 466 41,4 3,4 551 15,6
-Bobic AT-636 156 19,9 466 41,4 4,9 555 14,6 3,4 0,9
Bobic AT-636 171 18,2 517 48,6 4,7 583 5 1 0,76
Bobic AT-636 191 19,9 438 40,9 3 529 8,6 8,6
-Bobic AT-636 221 19,3 496 43,5 2,3 564 6,2 11,3 0,44
Bobic AT-636 225 19,7 523 43,5 5,8 597 6,1 10,9 0,51
Bobic AT-636 245 20 505 40,8 5,6 577 11,7 5 0,86
Bobic AT-636 270 21,2 460 35,7 3,8 534 9,9 8,2 0,41
Bobic AT-636 282 20 523 42,9 3,8 593 9,8 8,5 0,74
Sharic AT-638 2 16,3 484 49,3 11,3 560 30 5 0,32
Sharic AT-638 10 18,5 504 47,8 10,2 566 31,9 4 0,76
Sharic AT-638 25 19,4 494 45,9 6,4 563 22,7 9,2 0,45
Sharic AT-638 45 19,4 510 32,7 4,1 572 10,5 9,4 1,14
Sharic AT-638 61 20,7 504 39,1 4,5 587 9,9 7,7 0,94
Sharic AT-638 80 20,7 484 39,5 4,6 568 5,6 12 0,54
Sharicb AT-640 80 11,7 315 21,4 2,6 360 1,5 11,4 1,77
G11 AT-644 2 16,9 465 51,7 10,3 559 30,1 4,5 0,34
G11 AT-644 30 19,4 462 42,5 6 532 19,9 6,7 0,35
G11 AT-644 45 18,5 451 42,3 1,9 540 5,6 13,8 0,38
G11 AT-644 75 19 458 40,3 2,3 544 5,4 12,2 0,36
G11 AT-644 100 19,1 474 36,1 4,1 563 0,9 18 0,5
G11 AT-644 118 20,1 468 47,4 567 1,1 15 0,33
G11 AT-644 138 17,4 422 36,9 1,9 503 6,9 12,5 0,38
G11 AT-644 167 18,9 461 43,7 1,5 544 6,6 10,7 0,45
G11 AT-644 182 21 489 39,9 3 563 12,9 3,4 0,73
CN03 AT-634 10 16,2 444 34,6 3 520 14 0,39
CN03 AT-634 20 16,2 444 40,6 3,4 529 1,3 15,4
-CN03 AT-634 40 14,9 461 62,5 6 555 2,4 15 0,36
CN03 AT-634 70 21,2 474 41 3,4 557 15,2 2,8
-CN03 AT-634 90 21 478 42,3 1,3 563 12,6 0,8 0,52
CN03 AT-634 112 21,2 482 39,1 4,1 563 13,5 4,2
-CN03 AT-634 132 19 470 41,8 2,6 563 9,6 7,1 0,49
CN03 AT-634 152 21,2 446 39,9 3,8 534 14,6 0,2
-CN03 AT-634 172 22,7 482 40,6 3,8 565 17,3 0,83
CN03 AT-634 212 14,9 458 42 3,8 555 1,2 15,1
-CN03 AT-634 225 16,1 446 28,7 2,3 530 0,4 12,8 0,65
CN03 AT-634 245 20,1 470 39,1 2,3 543 9,4 4,1
-CN03 AT-634 265 21,1 460 38,4 3 544 13,3 0,6 0,55
CN03 AT-634 287 20,2 466 38,4 3 548 11,1 4,8
-CN03 AT-634 307 20,2 450 41 3,4 544 11,6 0,4 0,39
CN03 AT-634 327 14,8 446 40,3 3 531 0 13,6
-CN03 AT-634 350 19,2 455 39,5 0,8 535 12,3 1,2 0,53
CN03 AT-634 370 20 467 36,9 1,9 540 13,2 0,8
69&),
d
13CC2H6is44.2&. The difference ind
13C between
head-space gas and dissociated hydrate methane from the same horizon is about 2&.
d
DCH4of hydrate is195&, which points to methaneorigin due to CO2reduction.
The water collected after the gas hydrate dissociation revealed depletion in main anions and cations (Fig. 12,Table 2). Na/Cl ratio suggests seawater as a source for gas hydrates. Isotopic composition of hydrate water is
d
18O¼1.77&, which enriched in 1.5&compared to pore water.d
D of hydrate water is3.8&. All data indicate that seawater was the main source for hydrate formation, due to its extracting from the host sediments.CT scanning on sediment samples containing gas hydrates confirmed the presence of subparallel up to 3 mm thick hydrate layers crossed by a network of irregular microfractures- and pore-filling hydrates (Fig. 14E). From the CT digital images we find three preferential orientations of the gas hydrate layers exist (Fig. 14F). The highest population is subparallel to the sedimentary layering in addition to two main subvertical thinner fracture systems. Further results from CT imaging show, that the average volume occupied by gas hydrates is 30%. This value does not take in account the microporosity in the clayey fraction occupied by gas hydrates, potentially adding another 5%.
4.5.4. Authigenic carbonates
Study of thinsections and XRD analyses on the carbonates reveal that the carbonate cements consists mainly of Mg-calcite and aragonite. This is consistent with previous analyses done on other authigenic carbonates from G11 pockmark (Mazzini et al., 2006).
Carbon and oxygen stable isotope analyses on authigenic carbonates revealed consistent values from all the sampling stations. The
d
13C ranged between31.6&and59.2&andd
18O between 0.42&and 6.4&. (Fig. 15A,Table 4). Pure aragonite crust collected from 1.5 m bsf from periphery of CN03 structure has a valued
13C up to59.2&.Calyptogenashells vary in
d
13C from6.7 to25.5&.Acharax shells are depleted in13C from8&at Tobic structure to25.1&at CN03. Even non-chemosynthetic gastropods recovered from Dodo and Tobic structures are enriched in12C up to5&.d
18O from all studied shells ranges from 3.3 to 5.4&(Table 4).Some of the shells cemented by authigenic carbonate show high 12C enrichment, which is very close to
d
13C of cements: oxidizedcrust cement is42.7&, shell is34.6&; grey non-oxidized cement is52.7&, shell is50.1&(Table 4). Such abnormal light signals are most probably a result of methane-derived cement contamination.
5. Discussion
5.1. Morphology of the fluid escape structures
The TTR high-resolution sidescan sonar and subbottom profiler data suggest that most of the studied fluid escape structures have a positive relief at their central part surrounded
by a depression (Fig. 3). It is also obvious from high-resolution subbottom profiler data, that pull-up apparent in the bounding reflectors is not an acoustic velocity effect (hardly possible on the depth of several meters), but the presence of real structural uplift (diapire-like structures). The magnitude of such elevations usually does not exceed a few meters and is beyond the limit for conventional seismic resolution. If these relatively small struc-tures are crossed not exactly in their central part using e.g. an acoustic profiler the image of classic pockmarks will be recorded (compareFig. 3C and D). Fluid escape structures on the Southern Vøring Plateau cannot be considered as conventional pockmarks, because it is contrary to the definition of the pockmark (Hovland and Judd, 1988) and the common understanding of pockmark as a local seabed depression by most of marine geologists. Morphologically these structures are more similar to small-scale sea mounds (outcropping salt or mud diapirs) surrounded by sediment subsidence. We propose to call them as ‘‘seep mounds’’. Our data shows that the present day fluid activity is concen-trated on the top of these mounds. Similar structures were also described at the e.g. Dolgovskoy mound in the Black Sea ( Maz-zini et al., 2008; Bahr et al., 2009) or Darwin mound in the Gulf of Cadiz (Akhmetzhanov et al., 2008). It is possible that such seep mounds have a much broader distribution at other locations characterized by fluid discharge, but they have not been studied well yet and are often misinterpreted as mud volcanoes. Prob-ably these seep mounds were built during the initial (most active) stage of fluid seepage and then some of them were consequently subsided and gradually buried by thick sediments at places of reduced or ceased fluid activity. Geophysical and geological evidences show that seep mounds are still well expressed and broadly distributed in Area 1 where we docu-mented the present day fluid activity, and they are almost absent in Area 3 where they are covered by thick sediments.
5.2. Past and present day fluid activity of seep structures
While the bivalve shells points to the (past) presence of robust hydrogen sulphide seepage to maintain diverse and dense bivalve communities, these same sites have been permeated by hydro-carbon seepage conducive to hydro-carbonate incipient precipitation as clearly showed by strongly negative
d
13C composition of cements infilling these shells. We believe that the combination of hydro-carbon-derived authigenic carbonates and the H2S-sustained soft bottom infauna, indicates a complex emission of fluids enriched in hydrocarbons. Paull et al. (2008) recorded shells of chemo-synthetic mussels (Bathymodiolus) from a pockmark site located at 64.752 Lat N and 004.819 Long E. These authors speculate that these mussel shells document the expulsion of methane at the site before ca. 14 ka14C B.P measured by planktonic foraminifera. The reasoning stays on the assumption that this specific putative mussel was methanotrophic. Although this nutritional strategy is present in chemosynthetic Mytilidae, many bathymodiolinids areTable 2(continued).
Structure Station Depth, cm bsf mM d18O,&SMOW
K Na Mg Ca CL SO4 Alk
CN03 AT-634 445 20,6 473 45,2 2,6 548 12,9 0,8 0,63
-in fact thiotrophic (based upon H2S) or dual (Felbeck et al., 1981; Distel, 1998; Sibuet and Olu-Le Roy, 2002; Duperron et al., 2005) so that the finding of shells alone is not conclusive to derive the type of the seeped fluid. Furthermore, the image of the Bathy-modiolusshell bed of core JPC-15 reported byPaull et al. (2008: Fig. 5) shows ovate (hinged?) shells rather similar to those recorded from our sites (see Fig. 11A and the shell bed of Fig. 11D).
The hydrocarbon seepage through soft sediment hosting chemosynthetic assemblage led to the formation of distinctive chemoherm deposits at various sites (Fig. 11A,C,E). As also reported by other authors (e.g.,Lalou et al., 1992; Bohrmann et al., 1998) the chemoherms documented in this article are excellent examples of precursors of methanogenetic limestones containing
chemosynthetic bivalves widespread in the geologic record (e.g., Goedert and Squires, 1990; Nobuhara and Tanaka, 1993; Taviani, 1994, 2001; Peckmann et al., 2001, 2002; Goedert et al., 2003; Gill et al., 2005; Campbell, 2006; Kiel, 2006).
Present day seep activity is localized along small size (from several cm to several m in diameter) positive structures (e.g. pingoes) or along faults (cracks) expressed on the sea bottom (Fig. 5). Probably the current rate of fluid discharge is not enough to keep alive chemosynthetic macro fauna, but sufficient for surviving of tube worms and small bacterial colonies.
The large collection of carbonates reveal clear evidences, that most of the samples have corroded and oxidized surfaces, where pyrite is oxidized to iron hydroxides. However, at some sites we observed fresh crystals of aragonite accompanied by microbial
Table 3
TOC content, hydrocarbon gases concentrations,d18C of methane and carbon dioxide and main gas ratios measured from cores inside and outside of seep structures.
Strikethrough numbers of wetness mean that it is not a reliable value due to low hydrocarbons concentration.
Structure Station Depth,
Backgrou AT-113 0 0,75 3,50E-03 9,00E-05 1,19E-03 1,90E-04 1,80E-04 99,81a 0,08 1,06 0,47
Backgrou AT-113 13 0,57 3,90E-03 1,10E-04 8,70E-04 1,40E-04 4,40E-04 99,76 0,13 0,32 0,79
Backgrou AT-113 115 0,59 1,03E-02 9,00E-05 9,00E-05 1,40E-04 4,40E-04 98,79 1,00 0,32 0,64
Backgrou AT-113 171 7,20E-03 4,00E-05 4,40E-04 5,40E-05 1,50E-05 98,74 0,09 3,60 0,74
Backgrou AT-113 230 0,51 5,30E-03 3,20E-05 5,54E-04 4,10E-05 2,20E-04 99,39 0,06 0,19 0,78
Backgrou AT-113 347 0,59 6,90E-03 5,40E-05 6,40E-05 5,00E-05 2,20E-04 98,25 0,84 0,23 1,08
Backgrou AT-114 3 0,69 3,20E-03 1,10E-04 6,70E-04 1,60E-04 1,50E-04 29,36 0,16 1,07 0,69
Backgrou AT-114 13 0,44 3,50E-03 2,80E-04 1,10E-04 3,30E-04 17,84 0,33
Backgrou AT-114 22 0,46 3,50E-03 7,00E-05 6,80E-04 1,10E-04 3,70E-04 27,08 0,10 0,30 0,64
Backgrou AT-114 31 0,72 4,70E-03 1,50E-04 5,90E-04 1,10E-04 2,20E-04 18,54 0,25 0,50 1,36
Backgrou AT-114 40 0,88 4,20E-03 1,50E-04 1,03E-03 1,40E-04 2,40E-04 27,08 0,15 0,58 1,07
Backgrou AT-114 80 0,61 4,50E-03 1,70E-04 1,46E-03 1,10E-04 2,20E-04 30,34 0,12 0,50 1,55
Backgrou AT-114 112 0,6 5,20E-03 7,00E-05 1,19E-03 5,20E-04 2,60E-04 28,18 0,06 2,00 0,13
Backgrou AT-114 170 0,57 5,90E-03 7,00E-05 1,35E-03 8,00E-05 2,90E-04 24,16 0,05 0,28 0,88
Backgrou AT-114 285 0,67 1,03E-02 9,00E-05 1,71E-03 8,00E-05 2,90E-04 17,60 0,05 0,28 1,13
Backgrou AT-114 345 0,61 1,03E-02 9,00E-05 1,79E-03 8,00E-05 2,90E-04 18,12 0,05 0,28 1,13
structure-1 AT-117 4 0,68 0,01 4,00E-05 2,00E-04 1,40E-05 1,50E-04 6,39 0,20 0,09 2,86
structure-1 AT-117 32 0,05 1,10E-04 4,00E-04 1,40E-04 1,50E-04 1,85 0,28 0,93 0,79
structure-1 AT-117 71 0,09 1,70E-04 3,00E-04 1,40E-04 1,50E-04 0,88 0,57 0,93 1,21
structure-1 AT-117 103 0,16 2,60E-04 3,00E-04 2,20E-04 1,80E-04 0,64 0,87 1,22 1,18
structure-1 AT-117 134 0,56 0,15 1,10E-04 1,40E-04 7,00E-05 0,22 2,00 0,79
structure-1 AT-117 196 0,65 0,31 1,30E-03 2,00E-04 2,70E-04 1,50E-04 0,68 6,50 1,80 4,81
structure-1 AT-117 254 0,76 0,40 3,80E-03 4,60E-04 2,20E-04 1,19 2,09 8,26
structure-1 AT-117 282 0,65 0,46 5,60E-03 4,60E-04 2,20E-04 1,40 2,09 12,17
structure-1 AT-117 320 0,68 0,38 5,40E-03 3,30E-04 1,50E-04 1,55 2,20 16,36
structure-1 AT-117 345 0,45 0,50 9,20E-03 6,00E-04 1,80E-04 2,03 3,33 15,33
structure-1 AT-117 370 0,55 0,43 1,04E-02 4,60E-04 2,20E-04 2,58 2,09 22,61
structure-1 AT-117 388 0,60 0,55 1,88E-02 5,40E-04 1,10E-04 3,49 4,91 34,81
structure-1 AT-117 455 0,59 0,55 1,19E-02 5,40E-04 1,10E-04 2,28 4,91 22,04
structure-2 AT-118 8 0,77 0,03 1,50E-04 1,00E-04 3,50E-04 5,20E-04 4,23 1,50 0,67 0,43
structure-2 AT-118 34 0,66 0,47 3,89E-03 1,20E-03 9,80E-04 2,20E-04 1,38 3,24 4,45 3,97
structure-2 AT-118 59 0,89 0,58 4,75E-03 4,90E-04 2,20E-04 0,97 2,23 9,69
structure-2 AT-118 80 0,48 0,41 2,59E-03 2,40E-04 1,30E-04 0,73 1,85 10,79
structure-2 AT-118 100 0,56 0,79 8,43E-03 5,20E-04 1,80E-04 1,16 2,89 16,21
structure-2 AT-118 130 0,53 0,79 9,08E-03 5,40E-04 1,80E-04 1,24 3,00 16,81
structure-2 AT-118 149 0,56 1,27 1,38E-02 7,30E-04 1,00E-04 1,15 7,30 18,90
structure-2 AT-118 176 0,58 1,27 1,25E-02 6,50E-04 1,00E-04 1,05 6,50 19,23
structure-2 AT-118 182 0,53 1,10 1,21E-02 6,50E-04 1,00E-04 1,17 6,50 18,62
structure-2 AT-118 198 0,45 0,69 5,60E-03 4,10E-04 1,80E-04 0,91 2,28 13,66
structure-2 AT-118 227 0,73 0,81 5,90E-03 4,60E-04 1,50E-04 0,81 3,07 12,83
structure-2 AT-118 261 0,71 0,99 1,04E-02 7,10E-04 1,50E-04 1,13 4,73 14,65
structure-2 AT-118 287 0,72 0,76 8,60E-03 6,50E-04 2,50E-04 1,23 2,60 13,23
structure-2 AT-118 350 0,56 1,06 1,19E-02 7,90E-04 1,80E-04 1,21 4,39 15,06
structure-2 AT-118 378 0,56 0,62 7,20E-03 4,60E-04 1,80E-04 1,27 2,56 15,65
structure-2 AT-118 402 0,57 0,69 7,30E-03 4,90E-04 1,30E-04 1,15 3,77 14,90
structure-2 AT-118 463 0,50 0,69 9,90E-03 6,20E-04 1,10E-04 1,53 5,64 15,97
SW of Tobic AT-121 58 0,35 0,10 5,60E-04 7,10E-04 1,00E-03 3,70E-04 2,85 0,79 2,70 0,56
SW of Tobic AT-121 111 0,75 0,03 6,30E-04 5,50E-04 8,10E-04 2,20E-04 7,44 1,15 3,68 0,78
SW of Tobic AT-121 177 0,55 0,02 2,80E-04 5,20E-04 3,00E-04 1,50E-04 5,29 0,54 2,00 0,93
SW of Tobic AT-121 228 0,37 0,02 1,00E-04 4,40E-04 1,60E-0 2,20E-04 4,47 0,23 0,73 0,63
SW of Tobic AT-121 280 0,4 0,05 9,00E-05 3,20E-04 1,60E-04 2,20E-04 1,78 0,28 0,73 0,56
Tobic AT-120 28 0,55 0,27 2,60E-03 4,00E-04 3,30E-04 9,00E-05 1,27 6,50 3,67 7,88
Tobic AT-120 55 0,53 1,37 1,39E-02 7,10E-04 1,10E-04 1,08 6,45 19,58
Tobic AT-120 87 0,59 224,51 9,60E-03 0,00
Tobic AT-120 126 0,59 213,00 6,00E-03 0,00
Tobic AT-120 165 0,57 270,00 8,50E-03 0,00
Tobic AT-120 195 0,64 260,00 1,11E-02 0,00
Tobic AT-120 222 0,45 237,00 1,11E-02 0,01
Tobic AT-642 10 0,40 0,05 9,85E-05 1,34E-04 1,07E-04 0,71 0,73 0,92
Tobic AT-642 25 0,87 1,15E-03 9,92E-05 0,14 11,59
Tobic AT-642 80 0,45 0,13 1,37E-03 1,00E-04 1,36E-04 1,19 13,68 10,09
Tobic AT-642 100 0,18 1,40E-03 0,76
Tobic AT-642 160 0,58 0,20 2,74E-03 1,67E-04 1,45 16,41
Tobic AT-642 185 0,20 4,06E-03 1,65E-04 2,09 24,67
Tobic AT-642 210 0,50 7,44 1,60E-02 4,03E-03 0,27 3,98
Tobic AT-642 245 0,55 0,41 1,02E-02 3,02E-04 2,35E-04 2,54 33,73 43,31
Tobic AT-642 260 5,92 2,45E-02 2,88E-04 1,07E-03 0,44 85,02 22,87
Tobic AT-642 280 0,34 20,42 2,32E-02 1,39E-03 -86,54 0,12 16,73
Tobic AT-643 2 0,53 7,75E-04 2,43E-04 0,19 3,19