Lampiran 1. Tabel Hasil Analisis Karakteristik Agroekologi Di Tigapuluh (30)
Lokasi Penelitian
N P K C-ORG Mg pH N P K ST SU KM KT KE
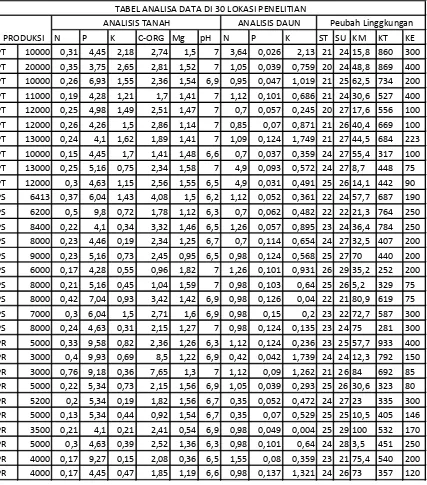
PT 10000 0,31 4,45 2,18 2,74 1,5 7 3,64 0,026 2,13 21 24 15,8 860 300 PT 20000 0,35 3,75 2,65 2,81 1,52 7 1,05 0,039 0,759 20 24 48,8 869 400 PT 10000 0,26 6,93 1,55 2,36 1,54 6,9 0,95 0,047 1,019 21 25 62,5 734 200 PT 11000 0,19 4,28 1,21 1,7 1,41 7 1,12 0,101 0,686 21 24 30,6 527 400 PT 12000 0,25 4,98 1,49 2,51 1,47 7 0,7 0,057 0,245 20 27 17,6 556 100 PT 12000 0,26 4,26 1,5 2,86 1,14 7 0,85 0,07 0,871 21 26 40,4 669 100 PT 13000 0,24 4,1 1,62 1,89 1,41 7 1,09 0,124 1,749 21 27 44,5 684 223 PT 10000 0,15 4,45 1,7 1,41 1,48 6,6 0,7 0,037 0,359 24 27 55,4 317 100 PT 13000 0,25 5,16 0,75 2,34 1,58 7 4,9 0,093 0,572 24 27 8,7 448 75 PT 12000 0,3 4,63 1,15 2,56 1,55 6,5 4,9 0,031 0,491 25 26 14,1 442 90 PS 6413 0,37 6,04 1,43 4,08 1,5 6,2 1,12 0,052 0,361 22 24 57,7 687 190 PS 6200 0,5 9,8 0,72 1,78 1,12 6,3 0,7 0,062 0,482 22 22 21,3 764 250 PS 8400 0,22 4,1 0,34 3,32 1,46 6,5 1,26 0,057 0,895 23 24 36,4 784 250 PS 8000 0,23 4,46 0,19 2,34 1,25 6,7 0,7 0,114 0,654 24 27 32,5 407 200 PS 9000 0,23 5,16 0,73 2,45 0,95 6,5 0,98 0,124 0,568 25 27 70 440 200 PS 6000 0,17 4,28 0,55 0,96 1,82 7 1,26 0,101 0,931 26 29 35,2 252 200 PS 8000 0,21 5,16 0,45 1,04 1,59 7 0,98 0,103 0,64 25 26 5,2 329 75 PS 8000 0,42 7,04 0,93 3,42 1,42 6,9 0,98 0,126 0,04 22 21 80,9 619 75 PS 7000 0,3 6,04 1,5 2,71 1,6 6,9 0,98 0,15 0,2 23 22 72,7 587 300 PS 8000 0,24 4,63 0,31 2,15 1,27 7 0,98 0,124 0,135 23 24 75 281 300 PR 5000 0,33 9,58 0,82 2,36 1,26 6,3 1,12 0,124 0,236 23 25 57,7 933 400 PR 3000 0,4 9,93 0,69 8,5 1,22 6,9 0,42 0,042 1,739 24 24 12,3 792 150 PR 3000 0,76 9,18 0,36 7,65 1,3 7 1,12 0,09 1,262 21 26 84 692 85 PR 5000 0,22 5,34 0,73 2,15 1,56 6,9 1,05 0,039 0,293 25 26 30,6 323 80 PR 5200 0,2 5,34 0,19 1,82 1,56 6,7 0,35 0,052 0,472 24 27 23 335 300 PR 5000 0,13 5,34 0,44 0,92 1,54 6,7 0,35 0,07 0,529 25 25 10,5 405 146 PR 3500 0,21 4,1 0,21 2,41 0,54 6,9 0,98 0,049 0,004 25 29 100 532 170 PR 5000 0,3 4,63 0,39 2,52 1,36 6,3 0,98 0,101 0,64 24 28 3,5 451 250 PR 4000 0,17 9,27 0,15 2,08 0,36 6,5 1,55 0,08 0,359 23 21 75,4 540 200 PR 4000 0,17 4,45 0,47 1,85 1,19 6,6 0,98 0,137 1,321 24 26 73 357 120
TABEL ANALISA DATA DI 30 LOKASI PENELITIAN
Lampiran 2. Hasil Analisis Karakteristik Agroekologi C-0rganik Berdasarkan
Potensi Produksi Tinggi.
Model Summaryb
Model R R Square
Adjusted R
Square
Std. Error of the
Estimate
1 ,384a ,148 ,041 2884,83564
a. Predictors: (Constant), C-Organik b. Dependent Variable: PT
ANOVAb
Model Sum of Squares Df Mean Square F Sig.
1 Regression 11521786,694 1 11521786,694 1,384 ,273a
Residual 66578213,306 8 8322276,663 Total 78100000,000 9
a. Predictors: (Constant), C-Organik b. Dependent Variable: PT
Coefficientsa
Model
Unstandardized Coefficients
Standardized Coefficients
T Sig. B Std. Error Beta
1 (Constant) 6996,684 4598,614 1,521 ,167
C-Organik 2287,885 1944,443 ,384 1,177 ,273
a. Dependent Variable: PT
Lampiran 3. Hasil Analisis Karakteristik Agroekologi C-0rganik Berdasarkan
Potensi Produksi Sedang
Model Summaryb
Model R R Square
Adjusted R Square
Std. Error of the Estimate
1 ,168a ,028 -,093 1070,36565
ANOVAb
Model Sum of Squares df Mean Square F Sig.
1 Regression 266091,183 1 266091,183 ,232 ,643a Residual 9165460,917 8 1145682,615
Total 9431552,100 9
a. Predictors: (Constant), C-Organik b. Dependent Variable: PS
Coefficientsa
Model
Unstandardized Coefficients
Standardized Coefficients
t Sig. B Std. Error Beta
1 (Constant) 7088,330 921,337 7,694 ,000
C-Organik 170,297 353,365 ,168 ,482 ,643
a. Dependent Variable: PS
Lampiran 4. Hasil Analisis Karakteristik Agroekologi C-0rganik Berdasarkan
Potensi Produksi Rendah
Model Summaryb
Model R R Square
Adjusted R Square
Std. Error of the Estimate
1 ,758a ,575 ,521 710,05411
a. Predictors: (Constant), C-Organik
b. Dependent Variable: PR
ANOVAb
Model Sum of Squares df Mean Square F Sig. 1 Regression 5447585,307 1 5447585,307 10,805 ,011a
Residual 4033414,693 8 504176,837
Total 9481000,000 9
Coefficientsa
Model
Unstandardized Coefficients
Standardized Coefficients
t Sig. B Std. Error Beta
1 (Constant) 5434,370 369,446 14,709 ,000
C-Organik -298,937 90,943 -,758 -3,287 ,011
a. Dependent Variable: PR
Lampiran 5. Hasil Analisis Karakteristik Agroekologi Nitrogen Berdasarkan
Potensi Produksi Tinggi
Model Summaryb
Model R R Square
Adjusted R Square
Std. Error of the Estimate
1 ,586a ,344 ,262 2531,19872
a. Predictors: (Constant), N b. Dependent Variable: PT
ANOVAb
Model Sum of Squares df Mean Square F Sig.
1 Regression 26844264,507 1 26844264,507 4,190 ,075a Residual 51255735,493 8 6406966,937
Total 78100000,000 9
a. Predictors: (Constant), N b. Dependent Variable: PT
Coefficientsa
Model
Unstandardized Coefficients
Standardized Coefficients
t Sig. B Std. Error Beta
1 (Constant) 4595,816 3847,977 1,194 ,267
N 30094,467 14702,363 ,586 2,047 ,075
Lampiran 6. Hasil Analisis Karakteristik Agroekologi Nitrogen Berdasarkan
Potensi Produksi Sedang
Model Summaryb
Model R R Square
Adjusted R Square
Std. Error of the Estimate
1 ,374a ,140 ,032 1007,20712
a. Predictors: (Constant), Nitrogen b. Dependent Variable: PS
ANOVAb
Model Sum of Squares df Mean Square F Sig.
1 Regression 1315822,673 1 1315822,673 1,297 ,288a
Residual 8115729,427 8 1014466,178
Total 9431552,100 9
a. Predictors: (Constant), Nitrogen b. Dependent Variable: PS
Coefficientsa
Model
Unstandardized Coefficients
Standardized Coefficients
t Sig. B Std. Error Beta
1 (Constant) 8534,799 961,738 8,874 ,000
Nitrogen -3576,120 3140,018 -,374 -1,139 ,288 a. Dependent Variable: PS
Lampiran 7. Hasil Analisis Karakteristik Agroekologi Nitrogen Berdasarkan
Potensi Produksi Rendah
Model Summaryb
Model R R Square
Adjusted R Square
Std. Error of the Estimate
1 ,622a ,387 ,310 852,64508
ANOVAb
Model Sum of Squares df Mean Square F Sig.
1 Regression 3664970,955 1 3664970,955 5,041 ,055a Residual 5816029,045 8 727003,631
Total 9481000,000 9
a. Predictors: (Constant), N b. Dependent Variable: PR
Coefficientsa
Model
Unstandardized Coefficients
Standardized Coefficients
t Sig. B Std. Error Beta
1 (Constant) 5466,122 519,163 10,529 ,000
N -3446,789 1535,139 -,622 -2,245 ,055
a. Dependent Variable: PR
Lampiran 8. Hasil Analisis Karakteristik Agroekologi Fosfor Berdasarkan Potensi
Produksi Tinggi
Model Summaryb
Model R R Square
Adjusted R Square
Std. Error of the Estimate
1 ,460a ,212 ,113 2774,16130
a. Predictors: (Constant), P b. Dependent Variable: PT
ANOVAb
Model Sum of Squares df Mean Square F Sig.
1 Regression 16532232,691 1 16532232,691 2,148 ,181a
Residual 61567767,309 8 7695970,914 Total 78100000,000 9
Coefficientsa
Model
Unstandardized Coefficients
Standardized Coefficients
t Sig. B Std. Error Beta
1 (Constant) 19508,403 4995,814 3,905 ,005
P -1534,029 1046,645 -,460 -1,466 ,181
a. Dependent Variable: PT
Lampiran 9. Hasil Analisis Karakteristik Agroekologi Fosfor Berdasarkan Potensi
Produksi Sedang
Model Summaryb
Model R R Square
Adjusted R Square
Std. Error of the Estimate
1 ,425a ,181 ,078 982,73447
a. Predictors: (Constant), P b. Dependent Variable: PS
ANOVAb
Model Sum of Squares df Mean Square F Sig.
1 Regression 1705415,765 1 1705415,765 1,766 ,221a
Residual 7726136,335 8 965767,042
Total 9431552,100 9
a. Predictors: (Constant), P b. Dependent Variable: PS
Coefficientsa
Model
Unstandardized Coefficients
Standardized Coefficients
t Sig. B Std. Error Beta
1 (Constant) 8935,333 1123,002 7,957 ,000
P -252,871 190,292 -,425 -1,329 ,221
Lampiran 10. Hasil Analisis Karakteristik Agroekologi Fosfor Berdasarkan
Potensi Produksi Rendah
Model Summaryb
Model R R Square
Adjusted R Square
Std. Error of the Estimate
1 ,129a ,017 -,106 1079,59030
a. Predictors: (Constant), P b. Dependent Variable: PR
ANOVAb
Model Sum of Squares df Mean Square F Sig.
1 Regression 156878,316 1 156878,316 ,135 ,723a
Residual 9324121,684 8 1165515,211
Total 9481000,000 9
a. Predictors: (Constant), P b. Dependent Variable: PR
Coefficientsa
Model
Unstandardized Coefficients
Standardized Coefficients
t Sig. B Std. Error Beta
1 (Constant) 4834,919 1051,617 4,598 ,002
P -54,336 148,103 -,129 -,367 ,723
a. Dependent Variable: PR
Lampiran 11. Hasil Analisis Karakteristik Agroekologi Kalium Berdasarkan
Potensi Produksi Tinggi
Model Summaryb
Model R R Square
Adjusted R Square
Std. Error of the Estimate
1 ,479a ,230 ,133 2742,22229
ANOVAb
Model Sum of Squares df Mean Square F Sig.
1 Regression 17941735,375 1 17941735,375 2,386 ,161a Residual 60158264,625 8 7519783,078
Total 78100000,000 9
a. Predictors: (Constant), K b. Dependent Variable: PT
Coefficientsa
Model
Unstandardized Coefficients
Standardized Coefficients
T Sig. B Std. Error Beta
1 (Constant) 8106,517 2849,977 2,844 ,022
K 2654,103 1718,257 ,479 1,545 ,161
a. Dependent Variable: PT
Lampiran 12. Hasil Analisis Karakteristik Agroekologi Kalium Berdasarkan
Potensi Produksi Sedang
Model Summaryb
Model R R Square
Adjusted R Square
Std. Error of the Estimate
1 ,415a ,172 ,069 987,94479
a. Predictors: (Constant), K
b. Dependent Variable: PS
ANOVAb
Model Sum of Squares df Mean Square F Sig.
1 Regression 1623272,771 1 1623272,771 1,663 ,233a Residual 7808279,329 8 976034,916
Total 9431552,100 9
Coefficientsa
Model
Unstandardized Coefficients
Standardized Coefficients
t Sig. B Std. Error Beta
1 (Constant) 8170,756 605,870 13,486 ,000
K -936,303 726,028 -,415 -1,290 ,233
a. Dependent Variable: PS
Lampiran 13. Hasil Analisis Karakteristik Agroekologi Kalium Berdasarkan
Potensi Produksi Rendah
Model Summaryb
Model R R Square
Adjusted R Square
Std. Error of the Estimate
1 ,155a ,024 -,098 1075,39867
a. Predictors: (Constant), K b. Dependent Variable: PR
ANOVAb
Model Sum of Squares df Mean Square F Sig. 1 Regression 229141,586 1 229141,586 ,198 ,668a
Residual 9251858,414 8 1156482,302
Total 9481000,000 9
a. Predictors: (Constant), K b. Dependent Variable: PR
Coefficientsa
Model
Unstandardized Coefficients
Standardized Coefficients
t Sig. B Std. Error Beta
1 (Constant) 4771,235 757,382 6,300 ,000
K -676,932 1520,767 -,155 -,445 ,668
Lampiran 14. Hasil Analisis Karakteristik Agroekologi Magnesium Berdasarkan
Potensi Produksi Tinggi
Model Summaryb
Model R R Square
Adjusted R Square
Std. Error of the Estimate
1 ,096a ,009 -,115 3110,04166
a. Predictors: (Constant), Mg b. Dependent Variable: PT
ANOVAb
Model Sum of Squares df Mean Square F Sig.
1 Regression 721126,761 1 721126,761 ,075 ,792a
Residual 77378873,239 8 9672359,155 Total 78100000,000 9
a. Predictors: (Constant), Mg b. Dependent Variable: PT
Coefficientsa
Model
Unstandardized Coefficients
Standardized Coefficients
t Sig. B Std. Error Beta
1 (Constant) 9009,859 12089,731 ,745 ,477
Mg 2253,521 8253,194 ,096 ,273 ,792
a. Dependent Variable: PT
Lampiran 15. Hasil Analisis Karakteristik Agroekologi Magnesium Berdasarkan
Potensi Produksi Sedang
Model Summaryb
Model R R Square
Adjusted R Square
Std. Error of the Estimate
1 ,481a ,231 ,135 952,15331
ANOVAb
Model Sum of Squares df Mean Square F Sig.
1 Regression 2178784,672 1 2178784,672 2,403 ,160a Residual 7252767,428 8 906595,928
Total 9431552,100 9
a. Predictors: (Constant), Mg b. Dependent Variable: PS
Coefficientsa
Model
Unstandardized Coefficients
Standardized Coefficients
t Sig. B Std. Error Beta
1 (Constant) 10195,216 1763,629 5,781 ,000
Mg -1926,979 1243,016 -,481 -1,550 ,160
a. Dependent Variable: PS
Lampiran 16. Hasil Analisis Karakteristik Agroekologi Magnesium Berdasarkan
Potensi Produksi Rendah
Model Summaryb
Model R R Square
Adjusted R Square
Std. Error of the Estimate
1 ,017a ,000 -,125 1088,47211
a. Predictors: (Constant), Mg b. Dependent Variable: PR
ANOVAb
Model Sum of Squares df Mean Square F Sig.
1 Regression 2827,738 1 2827,738 ,002 ,962a Residual 9478172,262 8 1184771,533
Total 9481000,000 9
Coefficientsa
Model
Unstandardized Coefficients
Standardized Coefficients
T Sig. B Std. Error Beta
1 (Constant) 4520,712 1093,600 4,134 ,003
Mg -42,651 873,018 -,017 -,049 ,962
a. Dependent Variable: PR
Lampiran 17. Hasil Analisis Karakteristik Agroekologi Kedalaman Efektif
Berdasarkan Potensi Produksi Tinggi
Model Summaryb
Model R R Square
Adjusted R Square
Std. Error of the Estimate
1 ,383a ,146 ,040 2886,85507
a. Predictors: (Constant), KE b. Dependent Variable: PT
ANOVAb
Model Sum of Squares df Mean Square F Sig.
1 Regression 11428542,441 1 11428542,441 1,371 ,275a
Residual 66671457,559 8 8333932,195 Total 78100000,000 9
a. Predictors: (Constant), KE b. Dependent Variable: PT
Coefficientsa
Model
Unstandardized Coefficients
Standardized Coefficients
t Sig. B Std. Error Beta
1 (Constant) 10554,460 1747,931 6,038 ,000
KE 8,780 7,498 ,383 1,171 ,275
Lampiran 18. Hasil Analisis Karakteristik Agroekologi Kedalaman Efektif
Berdasarkan Potensi Produksi Tinggi
Lampiran 19. Hasil Analisis Karakteristik Agroekologi Kedalaman Efektif
Berdasarkan Potensi Produksi Rendah
Model Summaryb
Model R R Square
Adjusted R Square
Std. Error of the Estimate
1 ,453a ,205 ,106 970,66347
a. Predictors: (Constant), KE b. Dependent Variable: PR
Model Summaryb
Model R R Square
Adjusted R Square
Std. Error of the Estimate
1 ,184a ,034 -,087 1067,18818
a. Predictors: (Constant), KE b. Dependent Variable: PS
ANOVAb
Model Sum of Squares df Mean Square F Sig.
1 Regression 320427,285 1 320427,285 ,281 ,610a
Residual 9111124,815 8 1138890,602
Total 9431552,100 9
a. Predictors: (Constant), KE b. Dependent Variable: PS
Coefficientsa
Model
Unstandardized Coefficients
Standardized Coefficients
t Sig. B Std. Error Beta
1 (Constant) 7988,453 978,461 8,164 ,000
KE -2,388 4,502 -,184 -,530 ,610
ANOVAb
Model Sum of Squares df Mean Square F Sig.
1 Regression 1943499,366 1 1943499,366 2,063 ,189a Residual 7537500,634 8 942187,579
Total 9481000,000 9
a. Predictors: (Constant), KE b. Dependent Variable: PR
Coefficientsa
Model
Unstandardized Coefficients
Standardized Coefficients
t Sig. B Std. Error Beta
1 (Constant) 3595,602 681,817 5,274 ,001
KE 4,600 3,203 ,453 1,436 ,189
a. Dependent Variable: PR
Lampiran 20. Hasil Analisis Karakteristik Agroekologi pH Berdasarkan Potensi
Produksi Tinggi
Model Summaryb
Model R R Square
Adjusted R Square
Std. Error of the Estimate
1 ,260a ,068 -,049 3017,00907
a. Predictors: (Constant), pH b. Dependent Variable: PT
ANOVAb
Model Sum of Squares df Mean Square F Sig.
1 Regression 5281250,000 1 5281250,000 ,580 ,468a
Residual 72818750,000 8 9102343,750 Total 78100000,000 9
Coefficientsa
Model
Unstandardized Coefficients
Standardized Coefficients
t Sig. B Std. Error Beta
1 (Constant) -15731,250 36812,611 -,427 ,680
pH 4062,500 5333,369 ,260 ,762 ,468
a. Dependent Variable: PT
Lampiran 21. Hasil Analisis Karakteristik Agroekologi pH Tanah Berdasarkan
Potensi Produksi Sedang
Model Summaryb
Model R R Square
Adjusted R Square
Std. Error of the Estimate
1 ,154a ,024 -,098 1072,83708
a. Predictors: (Constant), pH b. Dependent Variable: PS
ANOVAb
Model Sum of Squares df Mean Square F Sig.
1 Regression 223716,964 1 223716,964 ,194 ,671a
Residual 9207835,136 8 1150979,392
Total 9431552,100 9
a. Predictors: (Constant), pH b. Dependent Variable: PS
Coefficientsa
Model
Unstandardized Coefficients
Standardized Coefficients
t Sig. B Std. Error Beta
1 (Constant) 4043,621 7850,095 ,515 ,620
pH 516,071 1170,561 ,154 ,441 ,671
Lampiran 22. Hasil Analisis Karakteristik Agroekologi pH Tanah Berdasarkan
Potensi Produksi Rendah
Model Summaryb
Model R R Square
Adjusted R Square
Std. Error of the Estimate
1 ,644a ,415 ,342 832,42398
a. Predictors: (Constant), pH b. Dependent Variable: PR
ANOVAb
Model Sum of Squares df Mean Square F Sig.
1 Regression 3937562,500 1 3937562,500 5,682 ,044a
Residual 5543437,500 8 692929,688
Total 9481000,000 9
a. Predictors: (Constant), pH b. Dependent Variable: PR
Coefficientsa
Model
Unstandardized Coefficients
Standardized Coefficients
t Sig. B Std. Error Beta
1 (Constant) 21935,417 7331,451 2,992 ,017
pH -2614,583 1096,815 -,644 -2,384 ,044
a. Dependent Variable: PR
Lampiran 23. Hasil Analisis Karakteristik Agroekologi Nitrogen Daun
Berdasarkan Potensi Produksi Tinggi
Model Summaryb
Model R R Square
Adjusted R Square
Std. Error of the Estimate
1 ,070a ,005 -,119 3116,75444
ANOVAb
Model Sum of Squares df Mean Square F Sig.
1 Regression 386734,056 1 386734,056 ,040 ,847a Residual 77713265,944 8 9714158,243
Total 78100000,000 9
a. Predictors: (Constant), N-Daun b. Dependent Variable: PT
Coefficientsa
Model
Unstandardized Coefficients
Standardized Coefficients
T Sig. B Std. Error Beta
1 (Constant) 12534,634 1534,363 8,169 ,000
N-Daun -117,907 590,929 -,070 -,200 ,847
a. Dependent Variable: PT
Lampiran 24. Hasil Analisis Karakteristik Agroekologi Nitrogen Daun
Berdasarkan Potensi Produksi Sedang
Model Summaryb Mode
l
R R
Square
Adjusted R Square
Std. Error of the Estimate
1 ,055a ,003 -,122 1084,17706
a. Predictors: (Constant), N-Daun b. Dependent Variable: PS
ANOVAb
Model Sum of
Squares
df Mean
Square
F Sig.
1 Regression 28032,952 1 28032,952 ,024 ,881a Residual 9403519,148 8 1175439,893
Total 9431552,100 9 a. Predictors: (Constant), N-Daun
Coefficientsa
Model Unstandardized Coefficients Standardized Coefficients
t Sig.
B Std. Error Beta 1 (Constant
)
7790,467 1903,600 4,092 ,003
N-Daun -290,913 1883,774 -,055 -,154 ,881 a. Dependent Variable: PS
Lampiran 25. Hasil Analisis Karakteristik Agroekologi Nitrogen Daun
Berdasarkan Potensi Produksi Rendah
Model Summaryb
Model R R Square
Adjusted R Square
Std. Error of the Estimate
1 ,222a ,049 -,070 1061,50181
a. Predictors: (Constant), N-Daun b. Dependent Variable: PR
ANOVAb
Model Sum of Squares df Mean Square F Sig. 1 Regression 466711,337 1 466711,337 ,414 ,538a
Residual 9014288,663 8 1126786,083
Total 9481000,000 9
a. Predictors: (Constant), N-Daun b. Dependent Variable: PR
Coefficientsa
Model
Unstandardized Coefficients
Standardized Coefficients
t Sig. B Std. Error Beta
1 (Constant) 3955,287 867,352 4,560 ,002
N-Daun 578,329 898,610 ,222 ,644 ,538
Lampiran 26. Hasil Analisis Karakteristik Agroekologi Fosfor Daun Berdasarkan
Potensi Produksi Tinggi
Model Summaryb
Model R R Square
Adjusted R Square
Std. Error of the Estimate
1 ,023a ,001 -,124 3123,66327
a. Predictors: (Constant), P-Daun b. Dependent Variable: PT
ANOVAb
Model Sum of Squares df Mean Square F Sig.
1 Regression 41822,163 1 41822,163 ,004 ,949a
Residual 78058177,837 8 9757272,230 Total 78100000,000 9
a. Predictors: (Constant), P-Daun b. Dependent Variable: PT
Coefficientsa
Model
Unstandardized Coefficients
Standardized Coefficients
t Sig. B Std. Error Beta
1 (Constant) 12172,493 2183,750 5,574 ,001
P-Daun 2040,105 31161,158 ,023 ,065 ,949 a. Dependent Variable: PT
Lampiran 27. . Hasil Analisis Karakteristik Agroekologi Fosfor Daun
Berdasarkan Potensi Produksi Sedang
Model Summaryb
Model R R Square
Adjusted R Square
Std. Error of the Estimate
1 ,343a ,117 ,007 1020,02323
ANOVAb
Model Sum of Squares df Mean Square F Sig.
1 Regression 1107972,934 1 1107972,934 1,065 ,332a Residual 8323579,166 8 1040447,396
Total 9431552,100 9
a. Predictors: (Constant), P-Daun b. Dependent Variable: PS
Coefficientsa
Model
Unstandardized Coefficients
Standardized Coefficients
t Sig. B Std. Error Beta
1 (Constant) 6441,045 1076,882 5,981 ,000
P-Daun 10466,487 10142,533 ,343 1,032 ,332
a. Dependent Variable: PS
Lampiran 28. Hasil Analisis Karakteristik Agroekologi Fosfor Daun Berdasarkan
Potensi Produksi Rendah
Model Summaryb
Model R R Square
Adjusted R Square
Std. Error of the Estimate
1 ,099a ,010 -,114 1083,30979
a. Predictors: (Constant), P-Daun b. Dependent Variable: PR
ANOVAb
Model Sum of Squares df Mean Square F Sig.
1 Regression 92519,156 1 92519,156 ,079 ,786a
Residual 9388480,844 8 1173560,106
Total 9481000,000 9
Coefficientsa
Model
Unstandardized Coefficients
Standardized Coefficients
t Sig. B Std. Error Beta
1 (Constant) 4239,144 890,714 4,759 ,001
P-Daun 2944,594 10487,267 ,099 ,281 ,786
a. Dependent Variable: PR
Lampiran 29. Hasil Analisis Karakteristik Agroekologi Kalium Daun
Berdasarkan Potensi Produksi Tinggi
Model Summaryb
Model R R Square
Adjusted R Square
Std. Error of the Estimate
1 ,479a ,230 ,133 2742,22229
a. Predictors: (Constant), K b. Dependent Variable: PT
ANOVAb
Model Sum of Squares df Mean Square F Sig.
1 Regression 17941735,375 1 17941735,375 2,386 ,161a
Residual 60158264,625 8 7519783,078
Total 78100000,000 9 a. Predictors: (Constant), K
b. Dependent Variable: PT
Coefficientsa
Model
Unstandardized Coefficients
Standardized Coefficients
T Sig. B Std. Error Beta
1 (Constant) 8106,517 2849,977 2,844 ,022
K 2654,103 1718,257 ,479 1,545 ,161
Lampiran 30. Hasil Analisis Karakteristik Agroekologi Kalium Daun
Berdasarkan Potensi Produksi Sedang
Model Summary
Model R R Square
Adjusted R Square
Std. Error of the Estimate
1 ,046a ,002 -,123 1084,63978
a. Predictors: (Constant), K-Daun
Coefficientsa
Model
Unstandardized Coefficients
Standardized
a. Dependent Variable: PS
Lampiran 31. Hasil Analisis Karakteristik Agroekologi Kalium Daun
Berdasarkan Potensi Produksi Rendah
Model Summaryb
Model R R Square
Adjusted R
Square
Std. Error of the
Estimate
1 ,624a ,390 ,313 850,44525
a. Predictors: (Constant), K-Daun b. Dependent Variable: PR
ANOVAb
Model Sum of Squares df Mean Square F Sig. 1 Regression 3694943,067 1 3694943,067 5,109 ,054a
Residual 5786056,933 8 723257,117
Total 9481000,000 9
a. Predictors: (Constant), K-Daun
ANOVAb
Model Sum of Squares df Mean Square F Sig. 1 Regression 20004,522 1 20004,522 ,017 ,899a
Residual 9411547,578 8 1176443,447
Total 9431552,100 9
Coefficientsa
Model
Unstandardized Coefficients
Standardized Coefficients
t Sig. B Std. Error Beta
1 (Constant) 5251,163 437,917 11,991 ,000
K-Daun -1139,553 504,170 -,624 -2,260 ,054
a. Dependent Variable: PR
Lampiran 32. Hasil Analisis Karakteristik Agroekologi Ketinggian Tempat
Berdasarkan Potensi Produksi Tinggi
Model Summaryb
Model R R Square
Adjusted R Square
Std. Error of the Estimate
1 ,391a ,153 ,047 2876,33091
a. Predictors: (Constant), KT-Tempat b. Dependent Variable: PT
ANOVAb
Model Sum of Squares df Mean Square F Sig.
1 Regression 11913763,928 1 11913763,928 1,440 ,264a Residual 66186236,072 8 8273279,509
Total 78100000,000 9
a. Predictors: (Constant), KT-Tempat b. Dependent Variable: PT
Coefficientsa
Model
Unstandardized Coefficients
Standardized Coefficients
T Sig. B Std. Error Beta
1 (Constant) 8477,730 3312,519 2,559 ,034
KT-Tempat 6,260 5,216 ,391 1,200 ,264
Lampiran 33. Hasil Analisis Karakteristik Agroekologi Ketinggian Tempat
Berdasarkan Potensi Produksi Sedang
Model Summaryb
Model R R Square
Adjusted R Square
Std. Error of the Estimate
1 ,128a ,016 -,107 1076,85275
a. Predictors: (Constant), KT_Tempat b. Dependent Variable: PS
ANOVAb
Model Sum of Squares df Mean Square F Sig. 1 Regression 154657,322 1 154657,322 ,133 ,724a
Residual 9276894,778 8 1159611,847
Total 9431552,100 9
a. Predictors: (Constant), KT_Tempat b. Dependent Variable: PS
Coefficientsa
Model
Unstandardized Coefficients
Standardized Coefficients
t Sig. B Std. Error Beta
1 (Constant) 7840,860 990,192 7,919 ,000
KT_Tempat -,659 1,805 -,128 -,365 ,724
a. Dependent Variable: PS
Lampiran 34. Hasil Analisis Karakteristik Agroekologi Ketinggian Tempat
Berdasarkan Potensi Produksi Rendah
Model Summaryb
Model R R Square
Adjusted R Square
Std. Error of the Estimate
1 ,351a ,123 ,014 1019,26251
ANOVAb
Model Sum of Squares df Mean Square F Sig.
1 Regression 1169831,516 1 1169831,516 1,126 ,320a Residual 8311168,484 8 1038896,061
Total 9481000,000 9
a. Predictors: (Constant), KT-Tempat b. Dependent Variable: PR
Coefficientsa
Model
Unstandardized Coefficients
Standardized Coefficients
t Sig. B Std. Error Beta
1 (Constant) 5398,658 932,614 5,789 ,000
KT-Tempat -1,733 1,633 -,351 -1,061 ,320
a. Dependent Variable: PR
Lampiran 35. Hasil Analisis Karakteristik Agroekologi Kemiringan Lahan
Berdasarkan Potensi Produksi Tinggi
Model Summaryb
Model R R Square
Adjusted R Square
Std. Error of the Estimate
1 ,087a ,008 -,117 3112,69861
a. Predictors: (Constant), KM-Lahan b. Dependent Variable: PT
ANOVAb
Model Sum of Squares df Mean Square F Sig.
1 Regression 588858,944 1 588858,944 ,061 ,811a
Residual 77511141,056 8 9688892,632 Total 78100000,000 9
Coefficientsa
Model
Unstandardized Coefficients
Standardized Coefficients
t Sig. B Std. Error Beta
1 (Constant) 11847,187 2083,877 5,685 ,000
KM-Lahan 13,380 54,273 ,087 ,247 ,811
a. Dependent Variable: PT
Lampiran 36. Hasil Analisis Karakteristik Agroekologi Kemiringan Lahan
Berdasarkan Potensi Produksi Sedang
Model Summaryb
Model R R Square
Adjusted R Square
Std. Error of the Estimate
1 ,227a ,052 -,067 1057,42967
a. Predictors: (Constant), KM_Lahan b. Dependent Variable: PS
ANOVAb
Model Sum of Squares df Mean Square F Sig.
1 Regression 486292,068 1 486292,068 ,435 ,528a Residual 8945260,032 8 1118157,504
Total 9431552,100 9
a. Predictors: (Constant), KM_Lahan b. Dependent Variab
Coefficientsa
Model
Unstandardized Coefficients
Standardized Coefficients
t Sig. B Std. Error Beta
1 (Constant) 7065,788 740,227 9,545 ,000
KM_Lahan 8,945 13,563 ,227 ,659 ,528
Lampiran 37. Hasil Analisis Karakteristik Agroekologi Kemiringan Lahan
Berdasarkan Potensi Produksi Rendah
Model Summaryb
Model R R Square
Adjusted R Square
Std. Error of the Estimate
1 ,267a ,071 -,045 1049,07868
a. Predictors: (Constant), KM-Lahan b. Dependent Variable: PR
ANOVAb
Model Sum of Squares df Mean Square F Sig.
1 Regression 676471,453 1 676471,453 ,615 ,456a Residual 8804528,547 8 1100566,068
Total 9481000,000 9
a. Predictors: (Constant), KM-Lahan b. Dependent Variable: PR
Coefficientsa
Model
Unstandardized Coefficients
Standardized Coefficients
t Sig. B Std. Error Beta
1 (Constant) 4837,702 574,478 8,421 ,000
KM-Lahan -7,824 9,979 -,267 -,784 ,456
a. Dependent Variable: PR
Lampiran 38. Hasil Analisis Karakteristik Agroekologi Suhu Udara Berdasarkan
Potensi Produksi Tinggi
Model Summaryb
Model R R Square
Adjusted R Square
Std. Error of the Estimate
1 ,200a ,040 -,080 3061,22819
Coefficientsa
Model
Unstandardized Coefficients
Standardized Coefficients
t Sig. B Std. Error Beta
1 (Constant) 23633,540 19631,097 1,204 ,263
SH-Udara -440,994 762,927 -,200 -,578 ,579
a. Dependent Variable: PT
Lampiran 39.. Hasil Analisis Karakteristik Agroekologi Suhu Udara Berdasarkan
Potensi Produksi Sedang
Model Summaryb
Model R R Square
Adjusted R Square
Std. Error of the Estimate
1 ,067a ,004 -,120 1083,37322
a. Predictors: (Constant), SH-Udara b. Dependent Variable: PS
ANOVAb
Model Sum of Squares df Mean Square F Sig. 1 Regression 41971,868 1 41971,868 ,036 ,855a
Residual 9389580,232 8 1173697,529
Total 9431552,100 9
a. Predictors: (Constant), SH-Udara b. Dependent Variable: PS
Coefficientsa
Model
Unstandardized Coefficients
Standardized Coefficients
t Sig. B Std. Error Beta
1 (Constant) 6852,821 3446,286 1,988 ,082
SH-Udara 26,361 139,399 ,067 ,189 ,855
Lampiran 40. Hasil Analisis Karakteristik Agroekologi Suhu Udara Berdasarkan
Potensi Produksi Rendah
Model Summaryb
Model R R Square
Adjusted R Square
Std. Error of the Estimate
1 ,337a ,114 ,003 1024,97165
a. Predictors: (Constant), SH-Udara b. Dependent Variable: PR
ANOVAb
Model Sum of Squares df Mean Square F Sig. 1
Regression 1076464,853 1 1076464,853 1,025 ,341a Residual 8404535,147 8 1050566,893
Total 9481000,000 9
a. Predictors: (Constant), SH-Udara b. Dependent Variable: PR
Coefficientsa
Model
Unstandardized Coefficients
Standardized
a. Dependent Variable: PR
Lampiran 41. Hasil Analisis Karakteristik Agroekologi Suhu Tanah Berdasarkan
Potensi Produksi Tinggi
Model Summaryb
Model R R Square
Adjusted R Square
Std. Error of the Estimate
1 ,279a ,078 -,038 3000,70375
a. Predictors: (Constant), SH-Tanah b. Dependent Variable: PT
ANOVAb
Model Sum of Squares df Mean Square F Sig. 1 Regression 6066216,216 1 6066216,216
,674 ,436a Residual 72033783,784 8 9004222,973
Total 78100000,000 9
Coefficientsa
Model
Unstandardized Coefficients
Standardized Coefficients
t Sig. B Std. Error Beta
1 (Constant) 22168,919 12060,965 1,838 ,103
SH-Tanah -452,703 551,540 -,279 -,821 ,436
a. Dependent Variable: PT
Lampiran 42. Hasil Analisis Karakteristik Agroekologi Suhu Tanah Berdasarkan
Potensi Produksi Sedang
Model Summaryb
Model R R Square
Adjusted R Square
Std. Error of the Estimate
1 ,142a ,020 -,102 1074,73263
a. Predictors: (Constant), SH-Tanah b. Dependent Variable: PS
ANOVAb
Model Sum of Squares df Mean Square F Sig.
1 Regression 191150,284 1 191150,284 ,165 ,695a Residual 9240401,816 8 1155050,227
Total 9431552,100 9
a. Predictors: (Constant), SH-Tanah b. Dependent Variable: PS
Coefficientsa
Model
Unstandardized Coefficients
Standardized Coefficients
t Sig. B Std. Error Beta
1 (Constant) 5112,557 5881,778 ,869 ,410
SH-Tanah 101,649 249,870 ,142 ,407 ,695
Lampiran 43. Hasil Analisis Karakteristik Agroekologi Suhu Tanah Berdasarkan
Potensi Produksi Rendah
Model Summaryb
Model R R Square
Adjusted R Square
Std. Error of the Estimate
1 ,215a ,046 -,073 1063,20478
a. Predictors: (Constant), SH-Tanah b. Dependent Variable: PR
ANOVAb
Model Sum of Squares df Mean Square F Sig.
1 Regression 437764,706 1 437764,706 ,387 ,551a Residual 9043235,294 8 1130404,412
Total 9481000,000 9
a. Predictors: (Constant), SH-Tanah b. Dependent Variable: PR
Coefficientsa
Model
Unstandardized Coefficients
Standardized
a. Dependent Variable: PR
Lampiran 44. Analisis Regresi Berganda Karakteristik Agroekologi Dengan
Produksi
Model Summaryb Mo
del
R R
Square
Adjusted R Square
Std. Error of the Estimate
Durbin-Watson
1 ,884a ,782 ,578 2439,73742 1,822
a. Predictors: (Constant), S.Tanah, Mg, P.Daun, N.Daun, c-0rganik, pH, Kedalaman efektif, K.Daun, S.Udara, K. Lahan, P, K, N, K.Tempat
ANOVAb
Model Sum of
Squares
df Mean Square F Sig.
1 Regression 3,195E8 14 22819888,821 3,834 ,007a Residual 89284779,876 15 5952318,658
Total 4,088E8 29
a. Predictors: (Constant), S.Tanah, Mg, P.Daun, N.Daun, c-0rganik, pH, Kedalaman efektif, K.Daun, S.Udara, K. Lahan, P, K, N, K.Tempat
b. Dependent Variable: Potensi Produksi
Coefficientsa
Model Unstandardized Coefficients Standardized Coefficients a. Dependent Variable: Potensi Produksi
Lampiran 45. Analisis Regresi Stepwise Status Hara Tanah Dengan Potensi
Produksi
Model Summaryb Mode
l
R R Square Adjusted R Square
Std. Error of the Estimate
Durbin-Watson
1 ,491a ,241 ,214 3328,55679 1,114
a. Predictors: (Constant), ST b. Dependent Variable: P
ANOVAb
Model Sum of
Squares
df Mean Square F Sig.
1 Regression 98543095,078 1 98543095,07 8
8,894 ,006a
Coefficientsa Model Unstandardized
Coefficients
8339,588 3,94
5
a. Dependent Variable: P
Lampiran 46. Analisis regresi stepwise status hara daun dengan potensi produksi
Model Summaryb Mode
a. Predictors: (Constant), N_daun b. Dependent Variable: PR
ANOVAb
Model Sum of Squares df Mean Square F Si
g. 1 Regressi
on
50366744,139 1 50366744,139 3,9 35
,05 7a Residual 3,584E8 28 12799874,258
Total 4,088E8 29
a. Predictors: (Constant), N_daun b. Dependent Variable: PR
Coefficientsa
Model Unstandardized Coefficients Standar dized Coeffici ents
t Sig. Collinearity Statistics
B Std. Error Beta Toleranc
e VIF
1 (Constant) 6582,190 1002,380 6,567 ,000
N_daun 1167,974 588,795 ,351 1,984 ,057 1,000
1,000
Lampiran 47. Analisis Regresi Stepwise Faktor Lingkungan Dengan Potensi
Produksi
Model Summaryb Mode
l
R R Square Adjusted R Square
Std. Error of the Estimate
Durbin-Watson
1 ,491a ,241 ,214 3328,55679 1,114
a. Predictors: (Constant), ST b. Dependent Variable: P
ANOVAb
Model Sum of
Squares
df Mean Square F Sig
.
1 Regression 98543095,078 1 98543095,078 8,894 ,00 6a Residual 3,102E8 28 11079290,296
Total 4,088E8 29
a. Predictors: (Constant), ST b. Dependent Variable: P
Coefficientsa
Model Unstandardized Coefficients Standardize d Coefficients
t Sig. Collinearity Statistics
B Std. Error Beta Tolerance VIF
1 (Constant) 32895,797 8339,588 3,945 ,000
ST -1076,933 361,103 -,491 -2,982 ,006 1,000 1,000
Lampiran 48. Hubungan Karakteristik Agroekologi Dengan Potensi Tinggi
Correlations produksi C_organik Nitrogen Fosfor Kalium Magnesium
Kedalaman_ Produksi Pearson
Correlation
1
C_organik Pearson Correlation
,384 1
Nitrogen Pearson Correlation
,586 ,879** 1
Fosfor Pearson Correlation
-,460 ,018 -,086 1
Kalium Pearson Correlation
,479 ,295 ,474 -,348 1
Magnesium Pearson Correlation
Nitrogen_daun Pearson Correlation
-,070 ,279 ,351 ,048 -,394 ,479 -,261 -,280 1
Fosfor_daun Pearson Correlation
,023 -,393 -,381 -,145 -,458 -,298 ,072 ,485 -,156 1
Kalium_daun Pearson Correlation
Suhu_udara Pearson Correlation
-,200 -,295 -,437 ,084 -,520 -,053 -,845** -,264 ,037 ,297 -,353 -,637* -,109 1
Suhu_tanah Pearson Correlation
-,279 -,294 -,265 ,071 -,556 ,346 -,575 -,780*
*
,653* -,150 -,339 -,749* -,283 ,431 1
Lampiran 49. Hubungan Karakteristik Agroekologi Dengan Potensi Sedang
C-organik Pearson Correlation
N.daun Pearson Correlation
P.daun Pearson Correlation
,343 -,217 -,271 -,212
,064 -,016 ,006 ,723* -,206 1
Lampiran 50. Hubungan Karakteristik Agroekologi Dengan Potensi Rendah
N.Daun Pearson Correlation
P.Daun Pearson Correlation
K.daun Pearson Correlation