Abstract—Tuberculosis (TB) is one of the killing diseases in the developed countries. World Health Organization (WHO) has declared that Tuberculosis Disease can cause global warming. So, TB must be solved especially in prediction and vaccination. In this model, there are vaccinated populations, a vaccinated exposed population, and recovered individual can reinfection then be infected individual. There are four populations in this model, the population are Vaccinated, Exposed, Infected, and Treated. The type of TB Spreading in this model is exogenous reinfection. This paper explains about equilibrium point, and analyzing of stability endemic model
Index Terms—Equilibrium point, tuberculosis, vaccination, VEIT.
I. INTRODUCTION
The disease of tuberculosis is an influence disease which is caused by Mycobacterium tuberculosis (MTB) bacteria. This disease influences and springs out by the air that is small particles which is coming from tuberculosis called “droplet nucleus” [1]. If it does not solved, everyone with tuberculosis will be active infect about ten until fifteen persons in each of year.
Someone who got tuberculosis that could not required the characteristics infection of tuberculosis, but exactly the Mtb bacteria have been in the patient’s body and doesn’t active yet, we called by the Latent tuberculosis patient. It caused by there are immunity (body protector) which could stop the development of the bacteria. The latent tuberculosis patient can develop to be active tuberculosis whether the live contact to an active tuberculosis patient. This happened because the bacteria in laten tuberculosis patient increase significantly by its contact were. Therefore, if a person got the tuberculosis, then it couldn’t only seen by the main caution of factors which is causing tuberculosis disease, but also the possibility of exogenous reinfection happening [2].
One of the approaches to explain solution from the problems happened in real world is translating the problems to mathematics vocabularies. By translating the problems into mathematics vocabularies, will get a mathematics model that is the result which described the problems that would be found its solution. The Mathematics model can be applied to know the infection of the tuberculosis disease, expected by the model of mathematics gotten, it could be helped to find the solution how could be solved about the infection of Manuscript received December 12, 2014; revised June 1, 2015. This work was supported in part by the International affair and partnerships Yogyakarta State University, Indonesia.
The authors are with the Department of Mathematics Education, Faculty of Mathematics and Natural Science, Yogyakarta State University, Indonesia (e-mail: [email protected], [email protected], [email protected], [email protected]).
tuberculosis disease which has a complex increasing [3]. This paper will discuss about the forming and analyzing mathematics model to tuberculosis virus infection. The way of the model forming takes a focus about the infection by exogenous reinfection or there’re more contact to active tuberculosis one. From the model forming, will be analyzed the behavior of solution around equilibrium point, so that it can analyze the equilibrium point is stabile or not. Finally, we will know how to solve this tuberculosis disease, and then it would give back.
In 2004, Carlos Castillo created a journal by the titled “Dynamical Models of Tuberculosis and Their Applications” [4]. Its paper explained about how the dynamic works and TB control specifically. The earliest mathematics model in 1960 discussed about the approach of TB dynamic and focused to the model of prediction, not only for giving warning by a simulation but also a carefully of analysis dynamic by the most up to date knowledge from dynamic system. While the form of the model are used in TB controlling that is control strategic, controlling by vaccination optimally., the approach to TB elimination course in USA, the TB infection came back by HIV/AIDS, medicine anti TB, response from from immune system, etc. The model equations include the various area of mathematics like the ODE (Ordinary Differential Equation), PDE (Partial Differential Equations), differential equation system, etc.
In 2009, Juan Pablo Aparicio and his team explained about the strengthness and restriction of homogeneous and heterogeneous mixes in epidemic model, explained in a TB dynamic transmission [5]. The focus at three model types, that are a model of homogeneous in normal incident, a model of non-homogeneous mixing where add household contact/ and age structure model. A model is parameter by using demography and epidemic data, also general pattern which is comparated next.
And then, Susilo Nugroho in his essay discussed about the modeling of disease spread by the vaccination influences using SIR model [6]. This essay decrease back SIR model by taking care the birth and death factors. Then, Lisa Prihutami, a student of Diponegoro University explained about the stability in the TB spread model. The model of TB spread can be solved by numeric and stimulated [7].
In 2011, by Journal of Theoretical Biology, Sylvain Goutelle and team created by the titled “Mathematical Modeling of Pulmonary Tuberculosis therapy: Insights from a Prototype Model with Rifampin” [8]. The purpose of that paper is to build or create a prototype model of mathematics about TB threat by rifampin, based on the pharmacokinetic, pharmacodynamic, and disease sub model. A model is created or builded by qualitative and quantitative activities of bacteria from rifampin observation in clinical data.
Mathematical Model for Vaccinated Tuberculosis Disease
with VEIT Model
In 2012, Jonner Nainggolan and team presented a paper by the titled “The Optimal Controlling of Epidemiology Vaccination Model by SIR Type” [9]. The paper reviews about the Optimal Vaccination controlling from epidemiology model by SIR type by reinfecting. The optimal controlling of vaccination is done to know the effectiveness of vaccine in a spread prevention for a infectious disease. In this model also, would be determined the basic reproduction number, equilibrium point of endemic and non endemic. Next, it would be given by the calculation of numeric by using Matlab programming to illustrate the vaccination controlling influences to infected compartment.
And then, K. Queena Fredlina and team created a paper in mathematics e-journal about the SIR model of TB disease spread [10]. In that paper, analyze the stability points, eigen value and basic reproduction ratio. And then, stimulation starting by using Runge-Kutta 4 order method to test the parameter analysis. From the anlysis results would be required the most influence parameter in TB spread that are infection and recovery rates. Therefore, the spread of TB
A person who is a latent Tuberculosis could be changed to be an active tuberculosis one, where its change caused by one of two these factors [1] below:
1) Less or low of latent TB’s body protector or immunity, so that the bacteria there is growing up be an active bacteria (endogenous reactivation).
2) The person who exposed required a new infection caused by doing a direct contact back to TB active one (exogenous reinfection).
In this paper would like to discuss about the infection of tuberculosis disease by exogenous reinfection.
The TB patient who has got an effective cure and stated as a health one clinically, otherwise the TB bacteria is still in their body in less and low sum. Therefore, the immunity or body protector of a human is still can pressed or limited the bacteria to growing up well. In a certain condition, whether the patient who got well or better could be infected also after doing a direct contact with TB active one. Thus, an effective controlling for active TB patient’s population is more important, so that if one region or environment with infection level is high, this would cause more difficult to solve the infection of TB disease on that region.
The changing of many citizens in a region is influenced by the infection of TB epidemic by exogenous reinfection. This spring out TB epidemic by exogenous reinfection mathematically can be described as a nonlinear differential equation system.
B. Diagram Epidemic Model and Symbols
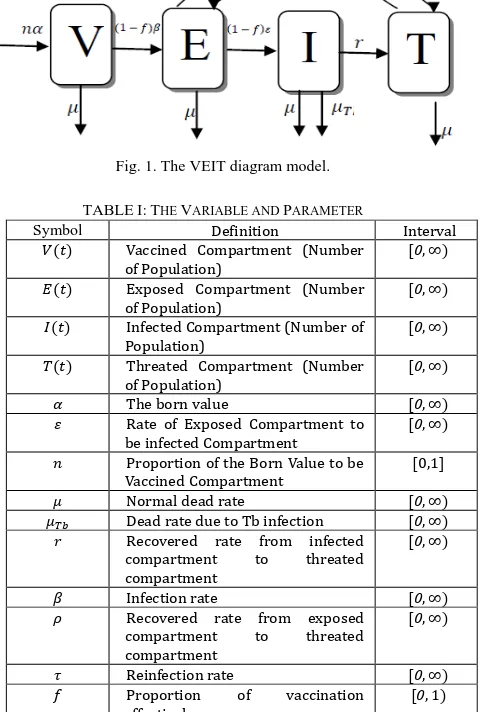
Diagram epidemic model is made to make easier in modeling process as shown in Fig 1. There are four compartments in this model. Those are Vaccined, Exposed,
Infected, and Threated.
On Fig. 1, we can see the diagram model that explains about compartments and their rate. And variable and parameter explanation showed on Table I.
Fig. 1. The VEIT diagram model. TABLEI:THE VARIABLE AND PARAMETER
Symbol Definition Interval
Vaccined Compartment (Number
Proportion of the Born Value to be Vaccined Compartment
Normal dead rate
Dead rate due to Tb infection
Recovered rate from infected compartment to threated compartment
Infection rate
Recovered rate from exposed compartment to threated
From the total number of births, there are some people who follow the vaccination program. This vaccine can reduce the impact or effect of virus infection Tb. The vaccine only works until exposed compartment. Individuals infected and recovered individuals cannot receive the vaccine. Exposed compartment can be individually recovering threatened as well as individuals who recover threatened can be re-infected and exposed individuals. Every compartment has the same rate of natural mortality. While the compartment infected individuals can die cause Tb diseases.
1) The change in the number of individual are susceptible be vaccinated to the time (t)
1) If the number of susceptible individual increasing as big
3) If the rate of natural death from individual is susceptible be vaccinated per unit of time as big as , then will
2) The change in the number of latent individual be vaccinated to time
Suppose that state that the number of latent individual were be vaccinated when , then the interval of time will be happened the change in the number of individual latent be vaccinated which influenced by :
1) If the rate of the infection is as big as and the number of proportion in vaccinated susceptible individual become vaccinated latent as big as and the proportion of the effectivity in vaccine is as big as , then will be increased as big as . 2) If the rate of individual who recovered from TBC threat (treated) become latentindividual (exposed) , then will increase .
3) If the rate of latent individual become active TB individual as big as and the proportion of effecivity in vaccine as big as , then will be decreased as big as .
4) If the rate of change in latent individual become recover individual be threated as big as and the proportion of effectivity vaccine as big as , then will be decreased as big as .
5) If the rate of natural death from latent TB individual per unit of time is as big as , then will be decreases as big as .
Therefore, the mathematics model from the change in the number of latent individual non vaccinated to time is as
3) The change in the number of active TB individual to the time
become recover individual were threated in TB as big as
r then will be decreased as big as .
3) If the death rate of active TB individual is as big as , then will be decreased as big as .
4) If the rate of natural death from active TB individual per unit of time is as big as , then will be decreased as
4) The recover individual were be threated in TB to the time (t)
Suppose that state that the number of recover individual were be threated from TB when t, then on the interval will be happened the change in recover individual from TB which is influenced by :
1) If the rate of treatment from active TB individual become individual who recover from TB per unit of time as r, then will be increased as big as .
2) If the number of individual who recover from TB threat become latent individual non vaccinated (exposed) , then will be decreased .
4) If the rate of natural death from individual who recover from TB threat is as big as , then will be decreased as big as t
Therefore, the mathematics model from the change in thenumber of individual who recover from TB threat to the time (t) is like the following below : formulas epidemic which consist of four differential equations, our model is thus given by :
From the model, we obtain two equilibrium points that disease free and endemik where there is as follows:
I T
(5)
And
I T
(6)
Then we find the liniear of models
This paper just explains about disease free equilibrium. From the point, we will be shown eigen values, From the model we can obtain a jacobian matrix.
After that, substitute the matrix jacobian J to disease free equilibrium (5).
We can obtained eigenvalues as follows:
If the eigenvalues are obtained which is not positive, then the system model is not stable. Meanwhile, if there is a zero eigenvalues then we can not determined the stability of the system. And if all eigenvalues are negative then the system is stable asymstotic.
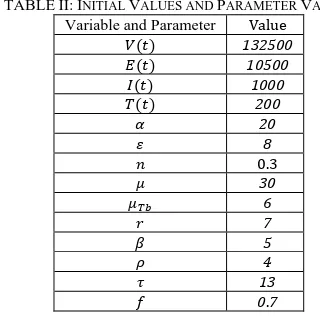
C. Numerical Simulation
The simulations were being used to see field plot of the model. Table II contained the intial values and parameter values of the model for numerical simulation.
TABLEII:INITIAL VALUES AND PARAMETER VALUES stable result. Stability condition of the equilibrium point in simulation is asymptotically stable, that mean the vaccinated compartment will increase while infected compartment will disappear. Fig. 2a, Fig. 2b, Fig. 2c, Fig. 2d, Fig. 2e, is showed field plot of respectively to the simulation
(a)
(b)
(c)
(d)
(e)
(f) Fig. 2. 2D field plot.
And Fig. 2a, Fig. 2b, Fig. 2c, Fig. 2d showed 3D field plot of respectively to the simulation , as Fig. 3 below.
(a)
(c)
(d). Fig. 3. 3D field plot.
IV. DISCUSSION AND CONCLUSION
Model of vaccinated Tuberculosis with exogenous reinfection have two equilibrium points, there is disease free and endemic. Eigen value of disease free always negative so the stability of system is stable asymptotic at disease free point.
ACKNOWLEDGMENT
Our deep appreciations go to The Rector of Yogyakarta State University, The Dean, and Bureaucracy Faculty who have supported us fully to be able to work and thank International Affairs and Partnership of Yogyakarta State University for supporing funds. The authors also wish to thank the reviewers for their helpful recommendations.
REFERENCES
[1] Setiawan, “Optimal controf of Tuberculosis Epidemic with Exogenous reinfection,” thesis, University of Indonesia, Depok, Indonesia, 2012. [2] S. A. Egbetade et al., “On exixtence of a vaccination model of
Tubercolusis disease pandemic,” International Journal of Engineering and Science, vol. 2, no. 7, pp. 41-44, 2013.
[3] M. O. Ibrahim et al., “A mathematical model for the Epidemiology of Tuberculosis with estimate of the basic reproduction number,” IOSR Journal of Mathematics, vol. 5, no. 5, pp. 46-52, 2013.
[4] C. C. Chavez and B. J. Song, “Dynamical models of tuberculosis and their applications,” Mathematical Biosciences and Engineering, vol. 1, no. 2, pp. 361-404, 2004.
[5] J. P. Aparicio and C. C. Chavez, “Mathematical modelling of tuberculosis epidemics,” Mathematical BioSciences and Engineering, vol. 6, no. 2, pp. 209-237, 2009.
[6] N. Susilo, “Vaccination influence to disease epidemic with SIR edemi model,” thesis, Surakarta State University, Surakarta, Indonesia, 2009. [7] P. Lisa, “Stability analyzing of tuberculosis epidemic model,” thesis
Diponegoro State University, Semarang, Indonesia, 2009.
[8] G. Sylvain et al., “Mathematical modeling of pulmonary tuberculosis therapy: Insights from a prototype model with rifampin,” Journal of Theoretical Biology, 2011.
[9] N. Jonner et al., "Vaccinated optimal control of epidemology model type SIR. T-10," in Proc. the Semnas Matematika dan Pend. Matematika, MIPA UNY. Yogyakarta, Indonesia, 2012.
[10] F. K. Queena et al., "Model for tuberculosis epidemic," E-Journal Matematika, vol. 1, no. 1, 1995.
Muhammad Rifki Taufik is a graduate at Yogyakarta State University. He was born in Jakarta, in 1993. Now, he studies at Mathematic Education Department of Yogyakarta State University. D. I. Yogyakarta, Indonesia. His major is mathematics which focuses in applied mathematics.
Muhammad Rifki Taufik is ever a leader of mathematics student association and a leader of FMIPA student executive association. He has presented his paper in some conference, some of them is Role of Teacher and Mathematical Concept to Build Student’s Character by Using ‘Everyone is Teacher’ Method at 3rd Basic Science International Conferences, Malang, Indonesia, and Mathematics Modeling in Interval Irrigation System of Rice Plant to Optimize Water Using and Time Effectively at International Conferene on Inovation in Engineer and Technology International Conference on Innovation in Engineering and Technology (ICIET), Bangkok, Thailand. He received student award in reasoning sector in 2014. And he has been a best volunteer in International Leader Festival.
Dwi Lestari was born in Klaten, in 1985. She graduated with bachelor degree from Yogyakarta State University in 2007 and graduated with master degree from Gadjah Mada University in 2010. She is a lecturer at Mathematics Education Department, Mathematics and Natural Science Faculty, Yogyakarta State University, Indonesia since 2010 until now.
Her research interests include applied mathematics such as mathematical modelling especially mathematical biology. Besides, her publication about mathematical modelling and operation research that is optimization.
Dwi Lestari owns membership of Indonesian Mathematics Society (IndoMs) since 2011.