Full Terms & Conditions of access and use can be found at
http://www.tandfonline.com/action/journalInformation?journalCode=vjeb20
Journal of Education for Business
ISSN: 0883-2323 (Print) 1940-3356 (Online) Journal homepage: http://www.tandfonline.com/loi/vjeb20
Principles Course Assessment, Accreditation, and
the Depreciation of Economic Knowledge
Joanne M. Doyle & William C. Wood
To cite this article: Joanne M. Doyle & William C. Wood (2005) Principles Course Assessment, Accreditation, and the Depreciation of Economic Knowledge, Journal of Education for Business, 80:3, 165-171, DOI: 10.3200/JOEB.80.3.165-171
To link to this article: http://dx.doi.org/10.3200/JOEB.80.3.165-171
Published online: 07 Aug 2010.
Submit your article to this journal
Article views: 18
ccrediting agencies recently have increased their expectations for assessment of general education courses, including business prerequisites. Al-though assessment of learning already takes place in every course’s grading, separate assessments are being consid-ered by a number of schools reviewed by the Association to Advance Collegiate Schools of Business (AACSB) Interna-tional. Their objective is to use prerequi-sites to prepare students more uniformly for upper level work in business. In this study, we used the microeconomic Test of Understanding of College Economics for additional assessment of economic knowledge at James Madison Universi-ty’s College of Business.
The Importance of Prerequisites
The purpose of courses prerequisite to upper level study is simple: to ensure that students are prepared for the required upper level work (Carlson, Cohn, & Ramsey, 2002). If prerequisites always worked as intended, upper level instructors could assume certain compe-tencies and proceed without reteaching them. But when reality intrudes, upper level instructors become uncertain about their students’ level of preparation. The following issues may emerge:
• There may be imperfect enforce-ment of prerequisites.
• Prerequisites may have poorly defined objectives.
• Even with well-defined objectives, instructors of prerequisites may not have taught them well and students may not have learned them well.
• Students may have incentives to understate their level of retention of pre-requisite material, which would necessi-tate its review.
• Students may learn material for the final exam of a prerequisite class but then forget it as knowledge depreciates over time (Kipps & Kohen, 1984).
Business programs can employ at least two strategies to ensure that students retain important knowledge from prereq-uisites. The first is called “administrative push.” This strategy sets up mechanisms
such as prerequisite checks during enroll-ment and assessenroll-ment of student learning. Students are “pushed” to comply admin-istratively.
The second strategy is “graduation pull.” Under this strategy, upper level instructors teaching courses required for graduation simply proceed as if all par-ticipants had completed the prerequisites successfully. Students then do whatever it takes to achieve at their desired level of performance; such activities can range from intensive independent study to doing nothing. The requirements of the class pull students along.
At most programs, a combination of administrative push and graduation pull is employed. Graduation pull has advan-tages in its use of individual incentives and its relative immunity to students’ strategic complaints of not having seen material before. However, administra-tive push has advantages in its visibility, the message that it sends, and the greater ease that it provides in documenting stu-dent readiness for accreditors.
Integrated Business Studies and Economic Prerequisites
Partly to improve instruction and part-ly to enhance continued accreditation prospects, James Madison University’s College of Business adopted a major curriculum change in 1996. The goal,
Principles Course Assessment,
Accreditation, and the Depreciation
of Economic Knowledge
JOANNE M. DOYLE WILLIAM C. WOOD
James Madison University Harrisonburg, Virginia
A
ABSTRACT. In this article, the authors report on the results of an assessment of economic knowledge among students who are entering upper level business study. Using the stan-dardized Test of Understanding of Col-lege Economics, they found small but statistically significant effects of eco-nomic knowledge in upper level busi-ness grades. The standardized test score proved to be a statistically significant predictor even when extensive variables from student records were added to the predicting equation. However, the authors show that the standardized test score is not likely to be a cost-effective supplement for admissions decisions to upper level business study.
which had an ambitious scope, was greater integration of business disci-plines (Hartenian, Schellenger, & Fred-erickson, 2001). Third-year students’ core business courses were replaced with a 12-hour course, Integrated Func-tional Systems. Although the course was divided into separately graded manage-ment, marketing, finance, and operations components, the course was to be taught and taken as a whole.
The results of the curriculum change were favorable, but review of the course highlighted a common instructor com-plaint: Students were able to perform few of the tasks presumably taught in prereq-uisite courses. When marketing students were asked to apply elasticity of demand, some said that they did not remember covering the topic in Principles of Micro-economics. Finance students professed ignorance about applying income state-ments even though their core accounting sequence had significant coverage.
When the College of Business (COB) was reviewed by AACSB International in 2001–2002, the visiting team understood the importance of prerequisites to Inte-grated Functional Systems. In response to the team’s recommendations, the COB intensified its administrative push strate-gy in economics, accounting, and quanti-tative methods.
The Integrated Functional Systems faculty members reviewed the Test of Understanding of College Economics (TUCE) and determined that the micro-economics portion of the TUCE covered the relevant skills for the integrated course. The micro TUCE was adminis-tered to two large sections of Integrated Functional Systems early in the spring and summer terms of 2003. The instruc-tors informed the students in advance and entered the micro TUCE grade as a quiz score, partly to motivate achievement. With informed consent, we obtained additional data from student records. Our objective was to study the determinants of student performance in Integrated Func-tional Systems, with particular attention to students’ economics background.
Data Description and Empirical Results
Our sample included 203 students enrolled in Integrated Functional
Sys-tems (course number COB 300). The data set consisted of each student’s final grade on a 100-point scale in the four components of COB 300 (Management, Marketing, Finance, and Operations) and each student’s TUCE score, mea-sured as the number of correctly answered questions out of the 33 ques-tions on the exam, as well as their grades on a 4-point scale in all prerequi-site courses. These courses included Principles of Microeconomics, Princi-ples of Macroeconomics, Statistics, Business Law, Interpersonal Skills, Accounting I and II, and Quantitative Methods. Additional data included each student’s overall grade point average at the start of COB 300; verbal plus math SAT scores; the number of credit hours enrolled during that semester; and stu-dent gender, age, race, and major.
To check for differences based on race, we created three dummy variables for White, Black, and Hispanic. The baseline group was Asian/Pacific Islander. To capture differences based on major, we created six dummy vari-ables for management, hospitality, international business, computer
infor-mation systems, finance, and account-ing. The baseline major was marketaccount-ing. There was only one student majoring in economics and one in operations, and we dropped both of these students from the sample because of missing data on other variables.
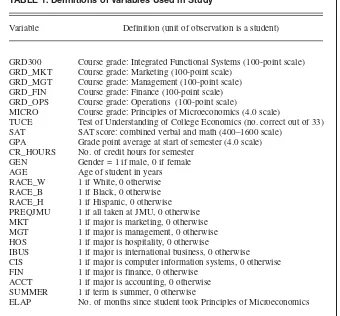
Although the initial sample included 203 students, missing data reduced the sample sizes to fewer than 203. In Table 1, we provide a complete list of the vari-ables that we used in this study, along with their definitions. We show descrip-tive statistics for the sample of data in Table 2.
Students received separate grades in the four COB 300 courses. We initially averaged these four grades to arrive at an overall grade for COB 300 (GRD300). We then used this grade as the dependent variable in a regression model of student performance.
The independent variables captured available information on the students before their enrollment in COB 300. These data included SAT scores, GPA, credit hours, gender, race, major, whether the student took all the prereq-uisite courses at JMU (PREQJMU), the
TABLE 1. Definitions of Variables Used in Study
Variable Definition (unit of observation is a student)
GRD300 Course grade: Integrated Functional Systems (100-point scale) GRD_MKT Course grade: Marketing (100-point scale)
GRD_MGT Course grade: Management (100-point scale) GRD_FIN Course grade: Finance (100-point scale) GRD_OPS Course grade: Operations (100-point scale)
MICRO Course grade: Principles of Microeconomics (4.0 scale)
TUCE Test of Understanding of College Economics (no. correct out of 33) SAT SAT score: combined verbal and math (400–1600 scale)
GPA Grade point average at start of semester (4.0 scale) CR_HOURS No. of credit hours for semester
GEN Gender = 1 if male, 0 if female AGE Age of student in years RACE_W 1 if White, 0 otherwise RACE_B 1 if Black, 0 otherwise RACE_H 1 if Hispanic, 0 otherwise PREQJMU 1 if all taken at JMU, 0 otherwise MKT 1 if major is marketing, 0 otherwise MGT 1 if major is management, 0 otherwise HOS 1 if major is hospitality, 0 otherwise
IBUS 1 if major is international business, 0 otherwise CIS 1 if major is computer information systems, 0 otherwise FIN 1 if major is finance, 0 otherwise
ACCT 1 if major is accounting, 0 otherwise SUMMER 1 if term is summer, 0 otherwise
ELAP No. of months since student took Principles of Microeconomics
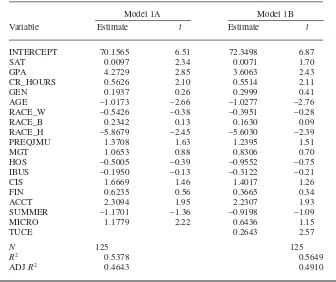
student’s grade in Principles of Micro-economics (MICRO), and the student’s TUCE score. To ascertain whether the TUCE provided new information, we ran the model with and without the TUCE score. We show the results of these regressions in Table 3.
Using a 10% level of significance, we found that GPA, SAT scores, credit hours, age, Hispanic race, accounting major, and Principles of Microeconom-ics grade were all statistically signifi-cant. Interestingly, when we added TUCE to the model, the MICRO course score lost its significance, most likely because of multicollinearity.
Although the TUCE score was signif-icant, it did not have a large quantitative effect on GRD300. For a student who answers one additional question cor-rectly on the TUCE (out of 33 total), GRD300 is predicted to increase by only 0.26 points on a 100-point scale. The model with the TUCE score explained 56% of the variation in the COB 300 scores, up from 54% when TUCE was omitted.
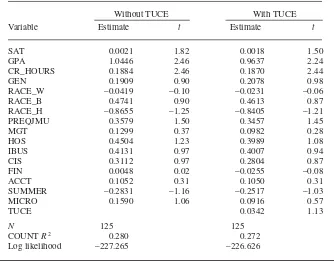
For business educators, separate stu-dent achievement in management, mar-keting, finance, and operations is important. Therefore, we estimated separate models for each of the four areas. For these models, we used actual letter grades rather than a numerical translation to a 100-point scale; there-fore, an ordered probit approach was appropriate.
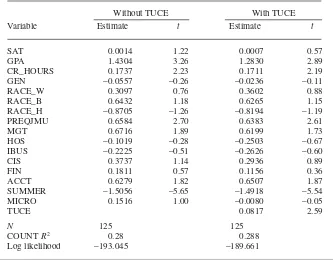
We show the results of the ordered probit models in Tables 4 through 7. In these tables, positive coefficients indi-cate a higher probability of a high grade; however, the magnitudes do not directly measure the size of the effect of the corresponding independent vari-able on course grade. We found that the TUCE improved predictive perfor-mance of the models for finance and operations, with p values better than .01. The TUCE was marginally impor-tant for management: It was statistical-ly significant with a pvalue of .07.
As a measure of goodness of fit, we examined the Count R2measure, which
measures the percentage of correct pre-dictions for course grade produced by the estimated model. We found that TUCE improved the percentage of correct pre-dictions fairly significantly for
manage-ment. The number of correct predictions increased from 38.4% to 42.4% when TUCE was added to the ordered probit
model for management. For finance, it increased only slightly, from 28.8% to 31.2%. For operations and marketing, TABLE 2. Descriptive Statistics of Sample
Variable n M SD
GRD300 201 81.9322 5.0268
GRD_MKT 202 81.4614 6.5510
GRD_MGT 201 83.2019 3.7179
GRD_FIN 201 78.9939 8.0206
GRD_OPS 201 84.0286 6.8198
MICRO 146 2.2493 0.8527
TUCE 203 15.0296 4.2285
SAT 189 1116.0320 109.4990
GPA 197 2.8931 0.3351
CR_HOURS 203 12.9557 1.6023
GEN 203 0.4877 0.5011
AGE 203 21.3332 1.2538
RACE_W 184 0.8315 0.3753
RACE_B 184 0.0707 0.2569
RACE_H 184 0.0217 0.1462
PREQJMU 203 0.5616 0.497
MKT 203 0.3350 0.4731
MGT 203 0.1133 0.3177
HOS 203 0.0690 0.2540
IBUS 203 0.0493 0.2169
CIS 203 0.1379 0.3457
FIN 203 0.1576 0.3653
ACCT 203 0.1084 0.3116
SUMMER 203 0.3547 0.4796
ELAP 148 13.1351 10.5355
TABLE 3. OLS Regressions: Dependent Variable GRD300
Model 1A Model 1B
Variable Estimate t Estimate t
INTERCEPT 70.1565 6.51 72.3498 6.87
SAT 0.0097 2.34 0.0071 1.70
GPA 4.2729 2.85 3.6063 2.43
CR_HOURS 0.5626 2.10 0.5514 2.11
GEN 0.1937 0.26 0.2999 0.41
AGE –1.0173 –2.66 –1.0277 –2.76
RACE_W –0.5426 –0.38 –0.3951 –0.28
RACE_B 0.2342 0.13 0.1630 0.09
RACE_H –5.8679 –2.45 –5.6030 –2.39
PREQJMU 1.3708 1.63 1.2395 1.51
MGT 1.0653 0.88 0.8306 0.70
HOS –0.5005 –0.39 –0.9552 –0.75
IBUS –0.1950 –0.13 –0.3122 –0.21
CIS 1.6669 1.46 1.4017 1.26
FIN 0.6235 0.56 0.3665 0.34
ACCT 2.3094 1.95 2.2307 1.93
SUMMER –1.1701 –1.36 –0.9198 –1.09
MICRO 1.1779 2.22 0.6436 1.15
TUCE 0.2643 2.57
N 125 125
R2 0.5378 0.5649
ADJ R2 0.4643 0.4910
there was virtually no change in the per-centage of correct predictions.
We have found that the TUCE score had a statistically significant effect on student performance in COB 300 com-ponents. In fact, for models in which
both TUCE and Principles of Microeco-nomics grade appear, TUCE was signifi-cant, but the Micro grade was not. This may be partially a result of multi-collinearity. To deal with this problem, we first estimated an ordinary least
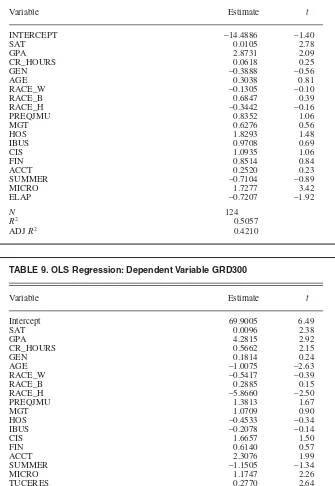
squares equation using TUCE as the dependent variable. We used a similar set of independent variables and included the number of months that had elapsed since the students took Principles of Microeconomics. We then used the resid-uals from this regression in place of TUCE in the regressions of COB 300 performance. This “TUCE residual” measures new information that is con-tained in the TUCE scores but not in the Principles of Microeconomics scores and other variables. In Table 8, we show the results of the TUCE regression, and in Table 9 we show the results of using the residuals from the TUCE regression in a model of COB 300 performance.
Not surprisingly, we found that MICRO had a statistically significant effect on students’ micro TUCE perfor-mance. In Table 8, the coefficient esti-mate on MICRO predicts that the differ-ence between a C and a B in Principles of Microeconomics translates into less than 2 additional questions answered correctly on the TUCE. This model also shows that SAT, GPA, and elapsed time were all statistically significant at 10% or better. The variable on elapsed time (ELAP) enters the model logarithmical-ly and is statisticallogarithmical-ly significant at a 10% level, implying a geometrically declining rate of depreciation of eco-nomic knowledge.
In Table 9, the regressions for COB 300 performance estimated through use of the residuals from the TUCE regres-sion, instead of the TUCE itself, show this TUCE residual to be significant. The MICRO grade was now significant, in contrast to its insignificance in the regression in Table 3 when TUCE was added. Clearly, the results in Tables 3 through 9 demonstrate that the TUCE score had predictive power for our mod-els of performance in the upper level business course.
We now ask the question, What does the TUCE measure? If it measures knowledge, why is it still significant when included with the student’s MICRO grade (Table 9)? One reason may be that students have different rates of knowl-edge depreciation (different levels of retention). For our data, the students took the TUCE 13 months (on average) after completing their Microeconomics Princi-ples course. A student who earned an A in TABLE 4. Ordered Probit: Dependent Variable Management Grade
Without TUCE With TUCE
Variable Estimate t Estimate t
SAT 0.0027 2.19 0.0022 1.73
GPA 1.2164 2.73 1.0918 2.42
CR_HOURS –0.0456 –0.59 –0.0485 –0.62
GEN 0.3531 1.60 0.3823 1.73
RACE_W 0.5381 1.31 0.5796 1.40
RACE_B 0.2553 0.47 0.2435 0.45
RACE_H –0.9413 –1.32 –0.9019 –1.26
PREQJMU 0.1879 0.77 0.1632 0.66
MGT 0.6787 1.87 0.6352 1.75
HOS 0.6718 1.77 0.5837 1.52
IBUS 0.6513 1.45 0.6417 1.43
CIS 0.6705 1.99 0.6243 1.85
FIN 0.1960 0.60 0.1480 0.45
ACCT 0.3075 0.88 0.3023 0.86
SUMMER 0.3401 1.36 0.3995 1.58
MICRO 0.2999 1.91 0.1895 1.12
TUCE 0.0568 1.81
N 125 125
COUNTR2 0.384 0.424
Log likelihood –160.233 –158.587
TABLE 5. Ordered Probit: Dependent Variable Marketing Grade
Without TUCE With TUCE
Variable Estimate t Estimate t
SAT 0.0021 1.82 0.0018 1.50
GPA 1.0446 2.46 0.9637 2.24
CR_HOURS 0.1884 2.46 0.1870 2.44
GEN 0.1909 0.90 0.2078 0.98
RACE_W –0.0419 –0.10 –0.0231 –0.06
RACE_B 0.4741 0.90 0.4613 0.87
RACE_H –0.8655 –1.25 –0.8405 –1.21
PREQJMU 0.3579 1.50 0.3457 1.45
MGT 0.1299 0.37 0.0982 0.28
HOS 0.4504 1.23 0.3989 1.08
IBUS 0.4131 0.97 0.4007 0.94
CIS 0.3112 0.97 0.2804 0.87
FIN 0.0048 0.02 –0.0255 –0.08
ACCT 0.1052 0.31 0.1050 0.31
SUMMER –0.2831 –1.16 –0.2517 –1.03
MICRO 0.1590 1.06 0.0916 0.57
TUCE 0.0342 1.13
N 125 125
COUNTR2 0.280 0.272
Log likelihood –227.265 –226.626
Principles of Microeconomics may have retained very little of the knowledge, making the course grade in Principles less significant. It may also be that the TUCE captures a student’s current level of motivation better than course grades
from the past. Grades in general are a combination of motivation and knowl-edge. When assessment instruments are administered at the start of the upper level courses, the results identify those stu-dents who are currently motivated to do
well. Overall, our results suggest that assessment scores make a positive but modest contribution to understanding upper level course performance.
Use of Economics Assessment for Business Admissions Decisions
This assessment study raised the pos-sibility of administrators’ use of an eco-nomics assessment test, with tests of other business prerequisites, to make business admissions decisions. At some colleges and universities, students study “prebusiness” subjects for 2 years, and there is a separate admissions process before 3rd-year business work. If faculty members and administrators could have confidence in standardized tests, they could make admissions decisions inde-pendently of student grades.
Consider the implications of such decisions in the chart shown in Table 10. In Cells (A) and (D), the standardized test scores and grades are congruent. These are the easy calls.
In Cell (B), a student achieves acceptable grades but is not qualified according to the standardized test. This student may be denied admission to upper level study—but on the force of a single multiple-choice test and against the evidence of a course grade that involved multiple testing opportunities and more diverse testing formats. It would be uncomfortable to sustain such a call, especially if the prerequisite course grades were high.
In Cell (C), a student does not have acceptable grades but does well on the standardized test. There are several pos-sible reasons for this outcome, includ-ing greater accuracy of the standardized test at measuring learning and greater facility for students with multiple-choice questions.
If there are large numbers of students in the shaded cells, Cells (B) and (C), the decision becomes important. However, if most students fall in the unshaded cells, Principles course grades are supe-rior. Because course grades must be given anyway in the normal course of operations, and giving the standardized test entails potentially significant costs for licensing and administration, prereq-uisite course grades have the edge. TABLE 6. Ordered Probit: Dependent Variable Finance Grade
Without TUCE With TUCE
Variable Estimate t Estimate t
SAT 0.0027 2.24 0.0019 1.53
GPA 1.2388 2.86 1.0565 2.41
CR_HOURS 0.2136 2.78 0.2159 2.80
GEN –0.0252 –0.12 0.0194 0.09
RACE_W –0.2625 –0.66 –0.2150 –0.54
RACE_B –0.0091 –0.02 –0.0229 –0.04
RACE_H –1.3354 –1.98 –1.3053 –1.93
PREQJMU 0.2530 1.06 0.2254 0.95
MGT 0.0637 0.18 –0.0332 –0.10
HOS –0.9331 –2.47 –1.1380 –2.97
IBUS –0.4109 –0.97 –0.4666 –1.10
CIS 0.2578 0.81 0.1635 0.51
FIN 0.4666 1.47 0.3863 1.21
ACCT 1.3225 3.74 1.3880 3.87
SUMMER 0.4282 1.75 0.5310 2.15
MICRO 0.3542 2.32 0.1757 1.08
TUCE 0.0989 3.16
N 125 125
COUNTR2 0.288 0.312
Log likelihood –220.511 –215.446
TABLE 7. Ordered Probit: Dependent Variable Operations Grade
Without TUCE With TUCE
Variable Estimate t Estimate t
SAT 0.0014 1.22 0.0007 0.57
GPA 1.4304 3.26 1.2830 2.89
CR_HOURS 0.1737 2.23 0.1711 2.19
GEN –0.0557 –0.26 –0.0236 –0.11
RACE_W 0.3097 0.76 0.3602 0.88
RACE_B 0.6432 1.18 0.6265 1.15
RACE_H –0.8705 –1.26 –0.8194 –1.19
PREQJMU 0.6584 2.70 0.6383 2.61
MGT 0.6716 1.89 0.6199 1.73
HOS –0.1019 –0.28 –0.2503 –0.67
IBUS –0.2225 –0.51 –0.2626 –0.60
CIS 0.3737 1.14 0.2936 0.89
FIN 0.1811 0.57 0.1156 0.36
ACCT 0.6279 1.82 0.6507 1.87
SUMMER –1.5056 –5.65 –1.4918 –5.54
MICRO 0.1516 1.00 –0.0080 –0.05
TUCE 0.0817 2.59
N 125 125
COUNTR2 0.28 0.288
Log likelihood –193.045 –189.661
There is even a question as to whether, administratively, a decision to favor a one-time standardized test over course grades is sustainable. What does the administrator say to a parent whose son or daughter achieved a B average in coursework, failed to make the cut on the standardized test, and “has always had trouble with standardized tests”? If the answer is that an excep-tion will be made in this case, then course grades are effectively the only important criterion for students achiev-ing high grades. The value of the stan-dardized test then lies in admitting high-ability students who nonetheless did poorly in coursework.
Conclusion
We have shown how, at considerable resource cost, a business program can slightly improve the accuracy of its pre-dictions of student performance in upper level work. We have also shown that it would be difficult to expand the use of assessment tests to admit students to upper level courses. At this point, the logical academic-economic conclusion would be that the additional assessment would not be worth its considerable cost. However, in a world where accredita-tion is important—and valued as a goal (Yunker, 2000) separate from its possi-ble contribution to quality—the decision is not so simple. Having a costly assess-ment program is visible evidence that a program takes seriously its accreditors’ recommendation to “do more assess-ment.” Having an administrative-push system for enforcing prerequisites demonstrates a costly commitment that accreditors value. Therefore, the use of additional prerequisite course assess-ment is far more likely to be driven by accreditation considerations than by its inherent usefulness.
ACKNOWLEDGMENT
We would like to thank Kenneth C. Williamson and Jennifer Frazier for help with data collection and handling for this article.
REFERENCES
Carlson, J. L., Cohn, R. L., & Ramsey, D. B. (2002, Spring). Implementing Hansen’s proficiencies. Journal of Economic Education, 33, 180–191. Hartenian, L. S., Schellenger, M., & Frederickson,
P. (2001, January/February). Creation and
TABLE 8. OLS Regressions: Dependent Variable TUCE
Variable Estimate t
INTERCEPT –14.4886 –1.40
SAT 0.0105 2.78
GPA 2.8731 2.09
CR_HOURS 0.0618 0.25
GEN –0.3888 –0.56
AGE 0.3038 0.81
RACE_W –0.1305 –0.10
RACE_B 0.6847 0.39
RACE_H –0.3442 –0.16
PREQJMU 0.8352 1.06
MGT 0.6276 0.56
HOS 1.8293 1.48
IBUS 0.9708 0.69
CIS 1.0935 1.06
FIN 0.8514 0.84
ACCT 0.2520 0.23
SUMMER –0.7104 –0.89
MICRO 1.7277 3.42
ELAP –0.7207 –1.92
N 124
R2 0.5057
ADJ R2 0.4210
TABLE 9. OLS Regression: Dependent Variable GRD300
Variable Estimate t
Intercept 69.9005 6.49
SAT 0.0096 2.38
GPA 4.2815 2.92
CR_HOURS 0.5662 2.15
GEN 0.1814 0.24
AGE –1.0075 –2.63
RACE_W –0.5417 –0.39
RACE_B 0.2885 0.15
RACE_H –5.8660 –2.50
PREQJMU 1.3813 1.67
MGT 1.0709 0.90
HOS –0.4533 –0.34
IBUS –0.2078 –0.14
CIS 1.6657 1.50
FIN 0.6140 0.57
ACCT 2.3076 1.99
SUMMER –1.1505 –1.34
MICRO 1.1747 2.26
TUCERES 0.2770 2.64
N 124
R2 0.5591
ADJ R2 0.4835
TABLE 10. Chart: Admission Decisions With Respect to Student Qualifications
Standardized test status
Grade status Qualified Not qualified
Qualified Admit to upper-level study (A) Questionable (B) Not qualified Questionable (C) Deny admission to
upper-level study (D)
assessment of an integrated business course: One college’s experience. Journal of Education for Business, 76, 149–159.
Kipps, P. H., & Kohen, A. K. (1984, Winter). The
depreciation of human capital over time: The case of economic knowledge revisited.Journal of Economic Education, 15, 90–91.
Yunker, J. A. (2000, July/August). Doing things
the hard way—Problems with mission-linked AACSB accreditation standards and sugges-tions for improvement. Journal of Education for Business, 75, 348–353.