Short communication
Microsatellite based genetic structuring reveals unique identity of Banni
among river buffaloes of Western India
B.P. Mishra
a,⁎
, R.S. Kataria
a, P. Kathiravan
a, K.P. Singh
b, D.K. Sadana
a, B.K. Joshi
aaNational Bureau of Animal Genetic Resources, Karnal, Haryana, India
bDept. of Animal Genetics and Breeding, College of Veterinary Science and Animal Husbandry, SDAU, Sardarkrushinagar, Gujarat, India
a r t i c l e
i n f o
a b s t r a c t
Article history: Received 22 May 2009
Received in revised form 24 August 2009 Accepted 12 September 2009
Genetic structure of Banni buffaloes vis-à-vis four other river buffalo breeds of Western India was assessed using short tandem repeat markers. The total number of alleles varied between 115 and 127 acrossfive buffalo breeds. The mean estimates of globalF-statistics over all loci were 0.330 forFIT, 0.145 forFSTand 0.216 forFISrespectively. Analysis of molecular variance
revealed that 14.33% of the total genetic variation was being explained by between breed differences. The phylogenetic tree constructed using chord distance estimates revealed the distinctness of Banni and Jaffarabadi buffaloes from other river buffalo breeds of the region. Multi dimensional scaling display of pair-wise FSTvalues revealed the close proximity of
Mehsana, Surti and Murrah buffaloes while Banni and Jaffarabadi buffaloes were placed separately. The results of principal components analysis based on pair-wise chord distance estimates between individual animals were consistent with the observation based on multidimensional scaling (MDS) analysis. This genetic structure was further supported by Bayesian clustering analysis which revealed three inferred clusters with Banni and Jaffarabadi forming separate clusters each while the remaining three breeds viz. Mehsana, Surti and Murrah together formed a single cluster. The results of the present study thus revealed the genetic uniqueness of Banni buffalo among other buffalo breeds of the region.
© 2009 Elsevier B.V. All rights reserved. Keywords:
Genetic relationship Banni buffalo
Multi dimensional scaling Principal components analysis Bayesian analysis
1. Introduction
River buffaloes (Bubalus bubalis) are the mainstay of Indian dairy industry playing a major role, by contributing approx. 56% of total milk production. Among the 10 well defined river buffalo breeds of India (Nivsarkar et al., 2000), buffaloes especially from Northern and Western parts of the country have been traditionally evolved for high milk production. Among the three well defined breeds of Western India, Jaffarabadi is the heaviest of all the Indian breeds of buffalo with good genetic potential for high milk and fat production (Cockrill, 1974). Surti buffalo is a lightly built animal which consumes less feed and thrives well under extensive system of management (Nivsarkar et al., 2000), while Mehsana is
presumed to be a breed developed by crossbreeding Murrah and Surti buffaloes (Olver, 1938). These buffaloes are well reputed for regularity in breeding and persistency in milk production (Singh, 1992). Apart from these three breeds, buffaloes in the Banni region (Kachchh district of Gujarat state) are good producers of milk with mean peak yield as high as 15.7 ± 0.1 l/day (Mishra et al., 2008) and their production potential is comparable to Murrah (Sadana et al., 2006). Banni buffaloes were evolved by“Maldharis”a traditional livestock rearing community of the region whose livelihood largely depends on these animals.
Increased interests in sustainable livestock production systems may cause preferential shift from improved breeds to adapted breeds that are more biologically fit in low input systems and harsh environment (FAO, 1999; Drucker et al., 2001). The importance of such adapted breeds increases when they have good potential for certain production traits. Banni buffaloes are important in this respect as they are adapted to
–
⁎Corresponding author. Tel.: +91 184 2267918; fax: +91 184 2267654. E-mail address:[email protected](B.P. Mishra).
1871-1413/$–see front matter © 2009 Elsevier B.V. All rights reserved. doi:10.1016/j.livsci.2009.09.011
Contents lists available atScienceDirect
Livestock Science
harsh dry conditions of the Kachchh region and are primarily maintained under extensive management system. The genetic structure analysis and resolving the genetic relationship of domesticated livestock is a complex process, because of continuous geneflow among different breeds. However, short tandem repeat (microsatellite) markers have been successfully used in many livestock species to unravel the genetic differentiation among different breeds/populations (Kumar et al., 2006; MacNeil et al., 2007). In case of riverine buffaloes of Western India, the genetic relationship between Jaffarabadi, Surti and Mehsana has been reported earlier byKumar et al. (2006) and Vijh et al. (2008). However, Banni buffalo, an important breed of Western India with good potential for milk production was not included in these studies. We earlier reported the physical and morphometric characteristics, management practices, production performance and basic diversity indices of Banni buffalo (Mishra et al., 2008). Further, microsatellite analysis of Banni and Murrah buffaloes indicated genetic differentiation, which were earlier presumed to be related due to their resemblance in morphology and production potential (Mishra et al., 2009). However, the genetic structure of Banni buffaloes vis-à-vis other buffalo breeds of the region is poorly understood. In this study, we have attempted to quantify genetic relationship of Banni with other riverine breeds of the region using heterologus bovine microsatellite markers.
2. Materials and methods
2.1. Blood sample collection and DNA extraction
Blood samples were collected from jugular vein of 230 animals fromfive different buffalo breeds. The number of individuals sampled included 47 from each of the Banni, Surti and Mehsana, 41 from Jaffarabadi and 48 from Murrah. Although no parentage records were available in thefield, to ensure unrelatedness, animals were selected from different villages after interviewing the farmers in detail. Genomic DNA was isolated from blood samples as described by
Sambrook and Russell (2001).
2.2. Microsatellite genotyping
A total of 24 bovine specific microsatellite markers were chosen for the present study. All these markers were selected based on their reported level of polymorphism in terms of heterozygosity and allele numbers (Kathiravan et al., 2009). The PCR amplification was carried out in 25 µl reaction volume containing 1.5 mM MgCl2, 200 µM dNTPs, 50 ng of each of forward and reverse primer, ~100 ng of genomic DNA and 0.5 U of Taq DNA polymerase (Bangalore Genei, India). PCR was carried out in PTC—200 Thermal cycler (MJ Research, Inc, MA, USA) using cycling conditions: 2 min at 94 °C followed by 30 cycles of 1 min at 94 °C, 1 min at precise annealing temperature, 1 min at 72 °C and for 10 min at 72 °C. The PCR products were resolved on 6% denaturing polyacrylamide gels (Sequi GT system, Bio-Rad, USA) and sized using a 10 bp ladder (Invitrogen, Life Technologies, CA, USA). In order to compare the allele size across different breeds, comparative analysis of samples containing different alleles was performed for each of the investigated loci. Gels were stained by silver staining (Bassam et al., 1991) and genotypes scored manually.
2.3. Statistical analysis
Various diversity indices like mean observed and effective number of alleles per locus, mean observed and expected heterozygosity were computed using POPGENE software package (Yeh et al., 1999). The globalF-statistics (Weir and Cockerham, 1984), heterozygosity deficiency and test for linkage disequilibrium were performed using FSTAT version 2.9.3.2 (Goudet, 2002). Geneflow, defined as the number of reproductively successful migrants among populations was calculated from Nei's coefficient of gene differentiation as described inSlatkin and Barton (1989). Analysis of molecular variance was performed using ARLEQUIN version 3.0 (Excoffier et al., 2005). The relationship among different breeds of buffaloes was analyzed using two different approaches. Firstly, genetic divergence between the breeds was estimated accord-ing toCavalli-Sforza and Edwards (1967)using MICROSATEL-LITE ANALYZER version 3.15 (Dieringer and Schlotterer, 2003). Pair-wise chord distances among breeds were utilized to derive dendrogram and radiation tree respectively using PHYLIP version 3.5 (Felsenstein, 1993) and the tree was visualized using TREEVIEW version 1.6.6 (Page 1996). Bootstrap resam-pling (n=10,000) was performed to test the robustness of the topologies.
Secondly, the geometric relationship between different buffalo breeds was examined using two ordination techniques viz. multidimensional scaling and principal components anal-ysis. Pair-wiseFSTvalues between all possible breed pairs were displayed by multidimensional scaling (MDS) using SPSS version 10.5. Pair-wise chord distance measures between individual animals were utilized to perform principal compo-nents analysis using SPSS version 10.5. Breed differentiation was further investigated using Bayesian clustering approach as implemented in STRUCTURE program (Pritchard et al., 2000). Individual animals were assigned to different clusters based on their multilocus genotypes. Admixture model was used with a burn in period of 1,000,000 iterations and 100,000 Markov Chain Monte Carlo (MCMC) repetitions to calculate the probable number of genetic clusters.
3. Results and discussion
0.189 (Banni-Murrah). The global F-statistics revealed the meanFSToverall loci as 0.145, while the global heterozygosity deficit was found to be 0.216. Estimation of genetic sub-division showed that the average proportion of genetic differentiation among breeds as 14.3% (P< 0.01). This is higher than that of reported for eight Indian buffalo breeds byKumar et al. (2006), while it is comparable to that reported for two North Indian buffalo breeds viz. Tarai and Bhadawari (Arora et al., 2004). The geneflow between different pairs of buffalo populations varied between 2.02 (Banni-Murrah) and 3.96 (Surti-Mehsana) while the global geneflow across different breeds overall loci was found to be 1.674. The estimates of geneflow between Banni and other buffalo breeds were found to be lowest among all the pair-wise estimates for different buffaloes of the region. Similarly the estimates for Jaffarabadi were also found to be less except with that of Surti. These estimates of geneflow give indications regarding the geographic and reproductive isola-tion of Banni and Jaffarabadi buffaloes. However, these indirect estimates of geneflow need to be looked cautiously as they have many underlying assumptions which may not be realistic in actual populations (Whitlock and Mccauley, 1999).
Cavalli-Sforza and Edwards (1967) was utilized to
construct the phylogenetic trees offive buffalo breeds and pair-wise distance values are presented in Table 1. The smallest chord distance was found to be between Murrah and Mehsana (0.310), while the highest distance was found between Jaffarabadi and Mehsana (0.435). The dendrogram constructed based on pair-wise chord distance measures following UPGMA revealed the clustering of Mehsana and Murrah at a single node (Fig. 1). Surti joined the cluster later followed by Jaffarabadi and Banni. This is understandable, as Mehsana is presumed to be developed by crossbreeding Murrah and Surti animals and its characteristics are interme-diate of these two buffalo breeds (Olver, 1938). This is also supported by the higher geneflow estimates (3.08 to 3.96) observed between these three breeds.
Further, multidimensional scaling (MDS) and principal components analysis (PCA) were utilized to predict the genetic structure among different buffalo breeds. The main applications of both these techniques are to reduce the number of variables and to detect structure in the relationship between variables. The multidimensional scaling display of pair-wiseFSTvalues showed the close proximity of Mehsana, Surti and Murrah while Banni and Jaffarabadi were found to form distinct clusters each separately (Fig. 2). The stress value was found to be 0.00053. Principal component analysis based on pair-wise chord distance estimates demonstrated that the first three principal components together explained 42.01% of the total variance, which was lower than that reported byBaumung et al. (2006)although it is comparable to the reports ofde Oliviera et al. (2007). The lower proportion of variance explained by the
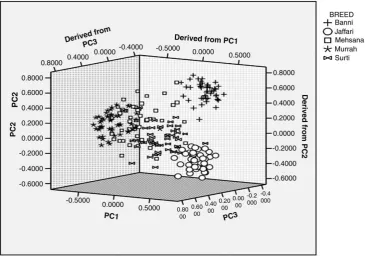
first three principal components could be attributed to comparatively more number of principal components (22) having eigen values greater than one. The three dimensional scatter gram obtained after principal components analysis showed the intermingling of Mehsana animals between Murrah and Surti, while Banni and Jaffarabadi individuals clustered separately (Fig. 3). The distinctness of Jaffarabadi buffaloes obtained in the present study is consistent with the results ofKumar et al. (2006). Distinctness of Banni buffalo indicated a separate lineage which could have evolved around the Banni grasslands of Kachchh region.
To test the validity of the clustering obtained by phyloge-netic and ordination analysis, AMOVA (analysis of molecular Table 1
FSTestimates and Cavalli-Sforza and Edwards chord distances between each
pair offive Indian buffalo breeds.
Banni Surti Jaffarabadi Mehsana Murrah
Banni 0 0.138 0.155 0.167 0.189
Surti 0.368 0 0.115 0.101 0.128
Jaffarabadi 0.379 0.368 0 0.180 0.185 Mehsana 0.365 0.342 0.435 0 0.107 Murrah 0.372 0.358 0.409 0.310 0
FST—above diagonal values; Cavalli-Sforza and Edwards chord distances—
below diagonal values.
Table 2
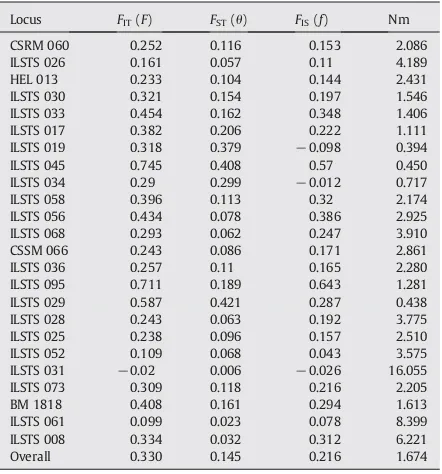
GlobalF-statistics and geneflow (Nm) for each of 24 microsatellite loci analyzed acrossfive breeds of buffaloes.
Locus FIT(F) FST(θ) FIS(f) Nm
CSRM 060 0.252 0.116 0.153 2.086
ILSTS 026 0.161 0.057 0.11 4.189
HEL 013 0.233 0.104 0.144 2.431
ILSTS 030 0.321 0.154 0.197 1.546
ILSTS 033 0.454 0.162 0.348 1.406
ILSTS 017 0.382 0.206 0.222 1.111
ILSTS 019 0.318 0.379 −0.098 0.394
ILSTS 045 0.745 0.408 0.57 0.450
ILSTS 034 0.29 0.299 −0.012 0.717
ILSTS 058 0.396 0.113 0.32 2.174
ILSTS 056 0.434 0.078 0.386 2.925
ILSTS 068 0.293 0.062 0.247 3.910
CSSM 066 0.243 0.086 0.171 2.861
ILSTS 036 0.257 0.11 0.165 2.280
ILSTS 095 0.711 0.189 0.643 1.281
ILSTS 029 0.587 0.421 0.287 0.438
ILSTS 028 0.243 0.063 0.192 3.775
ILSTS 025 0.238 0.096 0.157 2.510
ILSTS 052 0.109 0.068 0.043 3.575
ILSTS 031 −0.02 0.006 −0.026 16.055
ILSTS 073 0.309 0.118 0.216 2.205
BM 1818 0.408 0.161 0.294 1.613
ILSTS 061 0.099 0.023 0.078 8.399
ILSTS 008 0.334 0.032 0.312 6.221
Overall 0.330 0.145 0.216 1.674
variance) was performed. When no grouping was assumed, 85.21% of the total variation was found to be within breeds while the remaining 14.79% was found to be among different breeds (P< 0.01). When the buffalo breeds were grouped according to geographical location and gross morphology (Cockrill, 1974), among group variation was not significant statistically (P> 0.05) with the values of 1.24% and close to zero respectively. However, when the breeds were grouped based on the clusters obtained from MDS display and UPGMA tree (Group I: Murrah, Mehsana and Surti; Group II: Jaffarabadi;
Group III: Banni), among group variation was found to be significantly higher with the value of 5.07% (P< 0.05). Further, Bayesian clustering analysis was performed to assign indivi-duals to different clusters using STRUCTURE program. Several independent runs were performed for each KwithK= 2 to
K=7 in order to identify the appropriateKand to verify the consistency of the estimates across runs (Evanno et al., 2005). Three inferred clusters were obtained fromfive breeds (Fig. 4). Suti, Mehsana and Murrah formed thefirst cluster with 90.7%, Fig. 2. Multidimensional scaling plot of pair-wise FST values between
different buffalo breeds (stress value—0.00053).
Fig. 3.Scattergram showing relative position of individual animals offive buffalo breeds as defined by three largest principal component scores; First three PCs contribute to 42.01% variance.
96% and 98% of the sampled individuals from the respective populations contributing to this cluster. The second cluster has predominant contribution from Banni buffaloes while only 3% each of Surti and Mehsana breeds contributed to this cluster. The third cluster showed majority contribution from Jaffarabadi buffaloes, while 6% of Surti buffaloes also contributed to this cluster. Thus, the Bayesian analysis with noa prioriinformation confirmed the genetic uniqueness of Banni buffalo among the river buffalo breeds of the region.
4. Conclusion
Banni buffaloes, with a population of 0.52 million, have assumed significance in recent years owing to their high production potential in a unique grassland ecosystem (Singh, 2009). The present study revealed the genetic uniqueness of these buffaloes vis-à-vis other buffalo breeds available in the region which will be the basis for establishment of further conservation and selection strategies in Banni buffalo.
Acknowledgement
We thank the Director, NBAGR, Karnal for providing all the necessary facilities in carrying out the present study. Thanks are due to Sh. Naresh Kumar Yadav for technical assistance.
References
Arora, R., Lakhchaura, Prasad, R.B., Tantia, M.S., Vijh, R.K., 2004. Genetic diversity analysis of two buffalo populations of northern India using microsatellite markers. J. Anim. Breed. Genet. 121, 111–118. Bassam, B.J., Coetano-Anolles, G., Gressho, P.M., 1991. Fast and sensitive
silver staining of DNA in polyacrylamide gels. Anal. Biochem. 196, 80–83. Baumung, R., Cubric-Curik, V., Schwend, K., Achman, R., Solkner, J., 2006. Genetic characterization and breed assignment in Austrian sheep breeds using microsatellite marker information. J. Anim. Breed. Genet. 123, 265–271.
Cavalli-Sforza, L.L., Edwards, A.W.F., 1967. Phylogenetic analysis: models and estimation procedures. Am. J. Hum. Genet. 19, 233–257.
Cockrill, W.R., 1974. The husbandry and health of domestic buffalo. Food and Agriculture Organization, Rome, p. 24.
de Oliviera, J.D., de Paiva Igarshi, M.L.S., Machado, T.M.M., Miretti, M.M., Ferro, J.A., Contel, E.P.B., 2007. Structure and genetic relationships between Brazilian naturalized and exotic purebred domestic goat (Capra hircus) breeds based on microsatellite data. Genet. Mol. Biol. 30, 356–363.
Dieringer, D., Schlotterer, C., 2003. MICROSATELLITE ANALYZER (MSA): a platform independent analysis tool for large microsatellite data sets. Mol. Ecol. Notes 3, 167–169.
Drucker, A.G., Gomez, V., Anderson, S., 2001. The economic valuation of farm animal genetic resources: a survey of available methods. Ecol. Econ. 36, 1–18.
Excoffier, L., Laval, G., Schneider, S., 2005. Arlequin ver. 3.0: an integrated software package for population genetics data analysis. Evol. Bioinfor-matics Online 1, 47–50.
Evanno, G., Regnaut, S., Goudet, J., 2005. Detecting the number of clusters of individuals using the software structure: a simulation study. Mol. Ecol. 14, 2611–2620.
FAO, 1999. The global strategy for the management of farm animal genetic resources: executive brief. Food and Agriculture Organization of the United Nations, Initiative for Domestic Animal Diversity, Rome. Felsenstein, J., 1993. PHYLIP: phylogeny inference package, version 3.5.
Department of Genetics, Washington University, Seattle, Washington. Goudet, J., 2002. FSTAT version 2.9.3.2. Department of Ecology & Evolution.
University of Lausanne, CH.
Kathiravan, P., Mishra, B.P., Kataria, R.S., Sadana, D.K., 2009. Evaluation of genetic architecture and mutation drift equilibrium of Marathwada buffalo population in Central India. Livest. Sci. 121, 288–293. Kumar, S., Gupta, J., Niraj, K., Dikshit, K., Navani, N., Jain, P., Nagarajan, M.,
2006. Genetic variation and relationships among eight Indian riverine buffalo breeds. Mol. Ecol. 15, 593–600.
MacNeil, M.D., Cronin, M.A., Blackburn, H.D., Richards, C.M., Lockwood, D.R., Alexander, L.J., 2007. Genetic relationship between Feral cattle from Chirikof Island, Alaska and other breeds. Anim. Genet. 38, 193–197. Mishra, B.P., Singh, K.P., Chavan, D.B., Sadana, D.K., Kataria, R.S., Kathiravan,
P., Ahlawat, S.P.S., 2008. Characterization of Banni buffalo of Western India. Anim. Genet. Resour. Info. 44, 77–86.
Mishra, B.P., Kataria, R.S., Kathiravan, P., Bulandi, S.S., Singh, K.P., Sadana, D.K., 2009. Evaluation of genetic variability and mutation drift equilibrium of Banni buffalo using multi locus microsatellite markers. Trop. Anim. Health Prod.doi:10.1007/s11250-008-9301-8.
Nivsarkar, A.E., Vij, P.K., Tantia, M.S., 2000. Animal genetic resources of India: cattle and buffalo. Directorate of Information and Publications of Agriculture, ICAR, New Delhi, p. 206.
Olver, A., 1938. In a brief survey of some of the important breeds of cattle in India, Delhi. Imperial Council of Agricultural Research, Miscellaneous Bulletin No. 17.
Page, R.D., 1996. TREEVIEW: an application to display phylogenetic trees on personal computers. Comp. Appl. BioSci. 12, 357–358.
Pritchard, J.K., Stephens, M., Donnelly, P., 2000. Inference of population structure using multilocus genotype data. Genet. 155, 945–959. Sadana, D.K., Kataria, R.S., Mishra, B.P., 2006. Buffalo genetic resources of
India-Murrah. Monograph No. 25, NBAGR, Karnal, India.
Sambrook, J., Russell, D.W., 2001. Molecular cloning: a laboratory manual, 3rd ed. Cold Spring Harbour Laboratory Press, Cold Spring Harbour, New York.
Singh, D.V., 1992. Breed characterization of Mehsana buffaloes and strategies for their genetic improvement. Ph. D thesis, NDRI Deemed University, Karnal, Haryana, India.
Singh, K.P., 2009. Identification of new germplasm with special reference to Banni buffalo. Proceedings of National Symposium on “Livestock Biodiversity Conservation and Utilization: Lessons from Past and Future Perspectives”at Karnal on February 12–13, 2009.
Slatkin, M., Barton, N.H., 1989. A comparison of three indirect methods for estimating average levels of geneflow. Evolution 43, 1349–1368. Vijh, R.K., Tantia, M.S., Mishra, B., Bharani Kumar, S.T., 2008. Genetic
relationship and diversity analysis of Indian water buffalo (Bubalus bubalis). J. Anim. Sci. 86, 1495–1502.
Weir, B.S., Cockerham, C.C., 1984. EstimatingF-statistics for the analysis of population structure. Evol. 38, 1358–1370.
Whitlock, M.C., Mccauley, D.E., 1999. Indirect measures of geneflow and migration: FST # 1/(4Nm + 1). Heredity 82, 117–125.