Frequency Response Measurement of a
Power Transformer
W. G. Ariastina, I N. S. Kumara, C. G. Indra Partha, I G. Dyana Arjana,
I W. Arta Wijaya, A. A. N. Amrita, and I. A. D. Giriantari
Department of Electrical and Computer Engineering Udayana University
Bali-80362, Indonesia
Abstract—This paper presents a field experience in condition monitoring of a power transformer using SFRA technique. A design based comparison approach of the SFRA test results is discussed in the paper. In order to verify the latest condition of the transformer, the SFRA test was complemented with DGA and PD tests. The SFRA test results indicated that there is an abnormality within the transformer windings. The PD test results confirmed this interpretation, where very large ultrasonic impulses were detected. A series of DGA tests have showed that there is an early stage degradation of the insulating paper, which may be associated with fault within the transformer windings. The field experience showed that the monitoring approach has been very useful in indicating the possible occurrence of failure within the transformer structure.
Keywords—core and winding fault; power transformer; condition monitoring; SFRA
I. INTRODUCTION
Power transformers play major roles in delivering the electrical energy. Unpredictable major events such as earthquake and external short circuit may affect the initial position of transformer windings and core. Winding deformation and displacement may be occurred accordingly, which further may cause the torn of insulating paper and pressboard. This condition obviously may affect the insulation integrity of the transformer. Damage on the transformer insulation may lead to an insulation failure, hence causing interruption of power delivery. In order to assure the good condition of a transformer, an immediate inspection of the insulation condition after those major events should be carried out. The inspection should also be carried out after relocation and transportation of a transformer.
Sweep frequency response analysis (SFRA) has been used widely for determination of transformer windings and core condition. This technique utilises the electrical transfer functions of the transformer windings over a wide range of frequency. The low voltage with a variable frequency signal is injected into one winding terminal and the response signal is measured at the other terminal. The frequency response measured from a particular winding then is compared to the available reference response data. The frequency response appearance of a particular transformer is greatly affected by the relationship of the resistance, inductance and capacitance
within its winding structure. Because the frequency response is unique for a particular transformer, thus a response signature of an individual transformer can be developed for future measurement reference [1,2].
Recently, advanced research in SFRA technology has successfully implemented an online monitoring, a step forward from a conventionally offline monitoring technique. The online monitoring approach utilises appropriate network models for a particular transformer. The impedance of the measuring equipment thus must be included in the model, to achieve a proper response. This technique has been implemented for frequency response measurements in different size of transformers [3,4].
To date, the SFRA condition monitoring techniques have successfully assisted engineers to detect abnormalities in transformers, including winding deformation and displacement, shorted or open turns, faulty grounding, core movement, as well as other internal structure and connection problems. However, given the fact that the frequency response is also very much affected by many factors within the transformer, thus further investigations are still required to look at the possible affecting parameters, such as: core residual magnetism, oil and winding temperature, moisture level, and the winding structure [5-7].
This paper presents a field experience in condition monitoring of a power transformer using SFRA technique. The analysis is carried out by comparing the frequency response from one winding to another (i.e. design based comparison). This approach was considered the best option due to unavailability of SFRA reference data of the particular transformer type. In addition to the SFRA test, complementary tests of DGA and PD were also carried out.
II. SFRAMEASUREMENT
causing any changing in the structure of the transformer, will change any quantity of the circuit resistances, inductances and the capacitances. Consequently, the frequency response of the transformer will alter accordingly. This fact has become a development foundation of the SFRA monitoring technique.
The frequency response measurement of a transformer is carried out by injecting a low voltage with a variable frequency signal into one winding terminal and measuring the response signal at the other terminal. If the injected voltage is denoted by Vin and the response signal is denoted by Vout, thus the
attenuation of voltage magnitude (denoted by K) can be expressed as [1,4]:
K = 20 log10 (Vout/Vin) dB (1)
The frequency for SFRA measurement usually ranges from 20 Hz to 2 MHz, although frequencies up to 25 MHz have been used by some researchers [2]. The response magnitude K is commonly depicted in Bode diagram, where the horizontal and vertical axes represent the input frequency and the response magnitude, respectively [1].
The overall measuring frequency range can be divided into different sections, at which the frequency response is sensitive to defect on particular components of the winding structure. It is common to divide the entire frequency range into 3 sections, which are [8]:
• Low frequency range (up to 20 kHz). Within this range, the frequency response is mainly determined by inductance of the circuit.
• Mid frequency range (between 20 kHz to 400 kHz). Within this frequency range, the response is determined by combination of circuit inductance and capacitance, thus may initiate multiple resonances.
• High frequency range (above 400 kHz). The circuit capacitance dominates the winding response within this frequency range.
Some investigators divide the measurement frequency range into four narrower frequency bands. It is intended to look at more details on the sensitivity of a particular frequency range to an associated fault within core and winding [5].
The frequency response is analysed by comparing the appearance of measured response to the available reference response data. The comparison can be done based on the following approaches [1,2]:
• Time based; the latest SFRA measurement results from a particular transformer is compared to those of previous results. Significant changing in the SFRA signature from time to time may indicate a progressing defect within the winding structure.
• Type based; the SFRA measurement results from a particular transformer are compared to those from another transformer of the same type. Although the SFRA signature is unique for an individual transformer, the frequency responses of the transformers of the same type are usually somewhat similar.
• Design based; the SFRA signatures from three different phases of a transformer are compared one to another. Due to similarity in their structure, the trace of the frequency responses from a transformer is comparably similar between one winding to another. This approach is usually sufficient for analysis in case reference data is unavailable.
To achieve appropriate comparison results, factors affecting measurement results such as core magnetism, tap setting, and terminal connection, must be similar for one measurement to another. The comparison of measured frequency response data can be further analysed using statistical indices. The correlation coefficient and standard deviation have been found to be very useful for interpretation of the frequency response data. In this work, magnitude difference and cross correlation of the frequency responses are explored [2,4].
III. RESULTS AND DISCUSSION
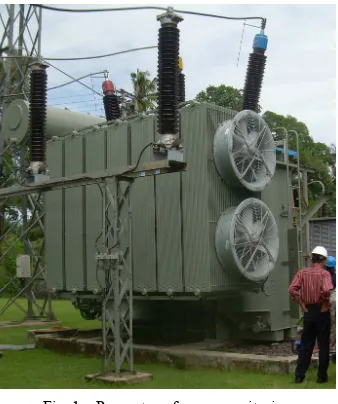
The SFRA test was conducted on a 150/20 kV, 60 MVA power transformer, as demonstrated in Fig. 1. The SFRA measurement was carried out for individual winding of the primary (HV) and the secondary (LV). During the SFRA measurement, the primary and the secondary winding connections were opened, while that of the tertiary winding was short circuited.
Fig. 1. Power transformer monitoring
The applied frequency range of the SFRA test was 20 Hz – 2 MHz. The frequency trace was set in a logarithmic scale. No previous data was available at the time of measurement, hence design based comparison would be the best option for comparison of the measured frequency responses.
primary windings, large differences between phase frequency responses can be noticed at 20 – 40 kHz (within mid frequency range) and above 500 kHz (within high frequency range). This situation can also be observed for frequency responses of secondary windings at above 20 kHz.
Fig. 2. Frequency response of the transformer
Fig. 2 demonstrates that within low frequency range, anti-resonances for HV and LV windings occur around a frequency of 500 Hz. There are two resonances occur within this frequency range. At a higher frequency range however; a high ripple occurs on the traces. Parameters of magnitude difference and cross correlation are implemented for analysis. The magnitude difference and the statistical cross correlation are calculated by software of the measurement instrument. The software compares two frequency response traces from two different phases at a time.
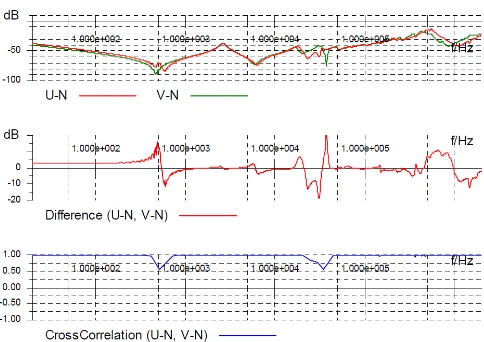
Fig. 3 illustrates the comparison of frequency response from phase U and V of HV windings. It can be seen that there is a large discrepancy between the two traces at around 500 Hz (low frequency range). This is indicated by a large deviation on the magnitude difference and a reduced value of cross correlation between the two. Any abnormality within the low frequency band may be associated with the core deformation, open or shorted turns, and residual magnetism [8]. Within the low frequency band, the frequency response of the U winding comprises two minima, while that of V winding comprises a single minima (see Fig. 2 for details). This discrepancy is associated to a difference in magnetic flux path within the core of phase U and V windings. The winding of middle core usually poses a slightly different response at around anti-resonance frequency then that of windings of outer core [2].
Fig. 3 also shows that within the mid frequency range (20 kHz to 400 kHz), there is an increased in trace discrepancy at around 20-40 kHz. The mid frequency range is sensitive to main or tap winding deformation [8]. An increased in discrepancy of the frequency response within this frequency band may indicate abnormality in the windings. This circumstance also occurs within the high frequency band (above 400 kHz), which may signify an abnormality within the main winding.
Fig. 3. SFRA responses from phase U and V of HV windings
A comparison of frequency responses from phase W and U of primary windings is demonstrated in Fig. 4. It is clear that within the low frequency band (up to 20 kHz), the two traces of the frequency response possess a high similarity. The two windings are constructed at outer core hence similar frequency response is expected. Within the mid and high frequency bands however, comparable characteristics to those in Fig. 3 are observed.
Fig. 4. SFRA responses from phase W and U of HV windings
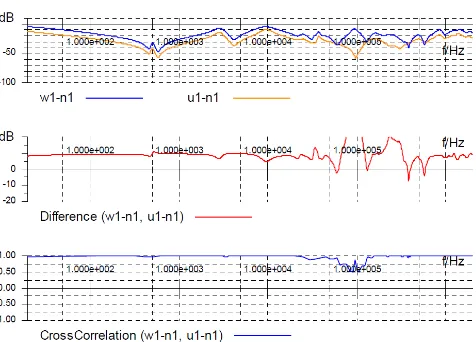
Fig. 5 shows the comparison of frequency response from phase u1 and v1 of secondary (LV) windings. It can be observed that the traces of the two frequency responses are quite similar, but the position of the u1 trace is much lower than that of the v1. This is indicated by a large magnitude difference over the measurement frequency range as depicted in the middle graph of Fig. 5. Similar phenomenon related to the anti-resonances at low frequency band as demonstrated in Fig. 3, is also observed. Similar reason thus can be explained for this fact. A low cross correlation between the two traces can be observed at frequencies of 20 to 100 kHz (within mid frequency range). This again may indicate an abnormality in the LV winding. A comparatively similar interpretation to that from Fig. 5 can also be observed from Fig. 6, where there is a large difference in response magnitude over the measurement frequency range. Note also that the cross correlation between Low frequency range Mid frequency range High frequency
the two comparison is reasonably similar, except for that within the low frequency range.
Fig. 5. SFRA responses from phase u1 and v1 of LV windings
Fig. 6. SFRA responses from phase w1 and u1 of LV windings
The cross correlation of the frequency responses is presented in Table 1. The analysis indicates that there is an abnormality in the transformer windings, most possibly at LV side. A comparative analysis of the frequency responses shows that the trace from winding u1 poses a lower magnitude than those from the other two LV windings, which indicates an increase in losses. The increasing losses may be caused by dielectric leakage current or winding connection fault [8].
TABLE I. CROSS CORRELATION OF THE FREQUENCY RESPONSES
Structure HV Windings LV Windings
U-V V-W W-U u1-v1 v1-w1 w1-u1
Core 0.5448 0.5861 0.9781 0.129 0.1493 0.9768
Winding 0.5651 0.8757 0.8258 0.4653 0.1949 0.478
In relation to the diagnosis status verification of the transformer, the SFRA tests were complemented with DGA and PD tests. The PD test results confirmed the interpretation here, where very large ultrasonic impulses were detected. A series of DGA tests have showed that there is an early stage
degradation of the insulating paper. Details on the PD and the DGA test results are discussed in [9] and [10].
IV. CONCLUSIONS
The SFRA measurement on a power transformer has been carried out. The test results indicated that there is an abnormality within the transformer windings, most probably at LV side. The SFRA test results also showed that there is increasing losses in the LV winding. The increasing losses may be caused by dielectric leakage current or failure in the winding connection. In order to obtain a better interpretation of the SFRA test results, a type based and the time based comparisons have been planned for future monitoring.
Previously published PD test results confirmed the interpretation of the SFRA results. Large ultrasonic impulses were detected during the test. Series of DGA tests have showed that there is an early stage degradation of the insulating paper, which may be associated with a winding fault within the transformer.
ACKNOWLEDGMENT
The authors would like to express their high appreciation to the manager and staffs of the PT PLN (Persero) Transmission and Load Dispatch Centre of East Java and Bali for facilitating the undergoing research collaboration on the condition monitoring of high voltage apparatus.
REFERENCES
[1] S. A. Ryder, “Diagnosing Transformer Faults Using Frequency
Response Analysis”, IEEE Elect. Insul. Mag., Vol. 19, No. 2, pp. 16-22, Mar/Apr 2003.
[2] A. Kraetge, M. Krüger, J. L. Velásquez, “Experiences with the practical application of Sweep Frequency Response Analysis (SFRA) on power transformers”, Proc. of the 16th ISH, Johannesburg, Paper D-45, 2009.
[3] V. Behjat, A. Vahedi, A. Setayeshmehr, H. Borsi, and E. Gockenbach, “Diagnosing Shorted Turns on the Windings of Power Transformers Based Upon Online FRA Using Capacitive and Inductive Couplings”, IEEE Trans. on Power Deliv., Vol. 26, No. 4, pp. 2123-2133, Oct 2011. [4] M. Bagheri, M. S. Naderi and T. Blackburn, “Advanced Transformer
Winding Deformation Diagnosis Moving from Off-line to On-line”, IEEE Trans. on DEI, Vol. 19, No. 6; pp. 1860-1870, Dec. 2012.
[5] E. Al Murawwi, R. Mardiana, C. Q. Su, “Effects of Terminal
Connections on Sweep Frequency Response Analysis of Transformers”, IEEE Elect. Insul. Mag., Vol. 28, No. 3, pp. 8-13, May/Jun 2012.
[6] M. Bagheri, B. T. Phung, and T. Blackburn, “Transformer Core
Influence on Frequency Response Spectrum Oscillations”, I Proc. of the 18th ISH, Seoul, Paper OF2-03, pp. 1772-1777, Aug. 2013.
[7] M. Bagheri, B. T. Phung and T. Blackburn, “Influence of Temperature and Moisture Content on Frequency Response Analysis of Transformer Winding”, IEEE Trans. on DEI, Vol. 21, No. 3; June 2014.
[8] A. Abu-Siada, N. Hashemnia, S. Islam, and M. A. S. Masoum,
“Understanding Power Transformer Frequency Response Analysis Signatures”, IEEE Elect. Insul. Mag., Vol. 29, No. 3, pp. 48-56, May/Jun 2013.
[9] W. G. Ariastina, et al., “Application of an Integrated Diagnostic Technique on Power Transformer for Reliable Electrical Energy Supply”, Proc. of the 1st Int. Conf. on Sust. Tech. Developt., Bali, pp.
E46 – E53, Oct. 2010.