12. PERBANDINGAN ANTAR KABUPATEN DI KALIMANTAN
TENGAH/Comparison Among Regency in Kalimantan Tengah
PETUNJUK TEKNIS
TECHNICAL NOTES
1. Pertumbuhan ekonomi merupakansuatu indikator dari dampak kebijaksanaan pembangunan yang dilaksanakan khususnya dalam bidang ekonomi.
1. Economic growth is an indicator of the impact of development policies are implemented, especially in the economic field.
2. Menurut UNDP, Indeks Pembangunan Manusia didefinisikan sebagai proses perluasan pilihan bagi penduduk (a process of enlarging the choice of people). IPM mengukur pencapaian hasil pembangunan dari suatu daerah/ wilayah dalam tiga dimensi dasar pembangunan yaitu: lamanya hidup, pengetahuan/ tingkat pendidikan, dan standar hidup layak.
2. According to the UNDP, Human Development Index (HDI) is defined as a process of enlarging the choice of people. HDI measures the achievement of development of an area/ region in three basic dimensions of development, namely: the length of life, knowledge/ level of education, and decent living standards.
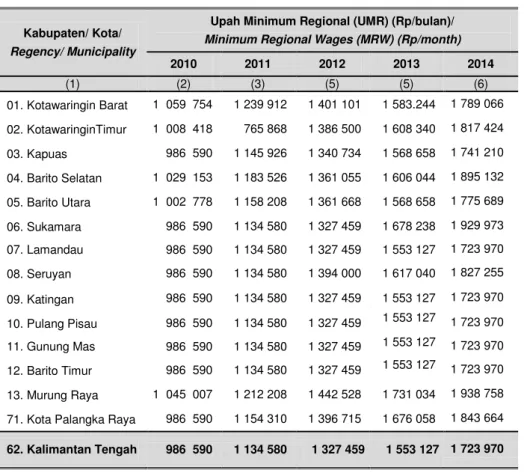
3. Tingkat Upah mengacu pada tingkat upah minimum dan lainnya, seperti yang telah ditentukan dalam peraturan atau hukum mengenai upah.
3. Wage/salary is based on minimum wages and the others, as a rule or law about wage.
4. Upah Minimum adalah upah terendah (termasuk tunjangan teratur tetapi tidak termasuk upah lembur) yang dibayarkan kepada karyawan (per jenis jabatan/ pekerjaan).
4. Minimum Wage is the lowest wage (including regular allowances but excluding overtime) paid to employees (per type of position / job).
5. Inflasi merupakan persentase kenaikan harga sejumlah barang dan jasa yang secara umum dikonsumsi rumah tangga. Ada barang yang harganya naik dan ada yang tetap. Namun, tidak jarang ada barang/ jasa yang harganya justru turun. Hitungan perubahan harga tersebut tercakup dalam suatu indeks harga yang dikena dengan Indeks Harga
5. Inflation is the percentage of increase in price of goods and services which are generally consumed by households. There are goods whose prices rise and there are fixed. However, it is not rare if goods / services whose prices declined. Count of price changes is reflected in the price index were to be shot by the Consumer Price Index (CPI).
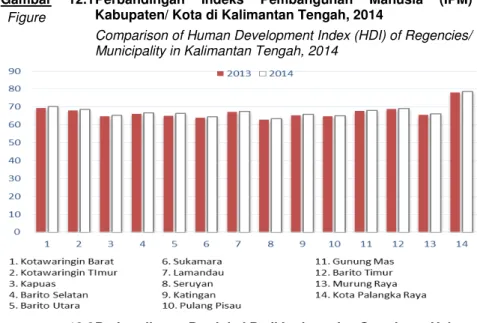
Gambar Figure
12.1 Perbandingan Indeks Pembangunan Manusia (IPM) Kabupaten/ Kota di Kalimantan Tengah, 2014
Comparison of Human Development Index (HDI) of Regencies/ Municipality in Kalimantan Tengah, 2014
Gambar Figure
12.2 Perbandingan Produksi Padi Ladang dan Sawah per Hektar menurut Kabupaten/ Kota di Kalimantan Tengah (Kw/Ha), 2014
Comparison Production of Wet Land Paddy and Dry Land Paddy per Hectare by Regencies/Cities in Kalimantan Tengah (Kw/Ha), 2014
Tabel
Table 12.1. Luas Wilayah, Jumlah Penduduk, dan Kepadatan Penduduk Menurut Kabupaten/ Kota, 2014
Regional Area, Population and Population Density by Regency/ Municipality, 2014 Kabupaten/ Kota/ Regency/ Municipality Luas/ Area (Km2) Penduduk/ Population (Jiwa/Person) Kepadatan Penduduk/ Population Density (Jiwa/Km2) (1) (2) (3) (4) 1. Kotawaringin Barat 10 759 269 629 25 2. Kotawaringin Timur 16 496 416 151 25 3. K a p u a s 14 999 344 955 23 4. Barito Selatan 8 830 130 609 15 5. Barito Utara 8 300 126 494 15 6. Sukamara 3 827 53 190 14 7. Lamandau 6 414 71 798 11 8. Seruyan 16 404 167 621 10 9. Katingan 17 800 157 654 9 10. Pulang Pisau 8 997 124 015 14 11. Gunung Mas 10 804 107 467 10 12. Barito Timur 3 834 110 446 29 13. Murung Raya 23 700 107 724 5 14. Palangka Raya 2 400 252 105 105 Kalimantan Tengah 153 564 2 439 858 16
Sumber : Badan Pusat Statistik Provinsi Kalimantan Tengah Source : BPS – Statistics of Kalimantan Tengah Province
326 Murung Raya in Figures 2015
COMPARISON AMONG REGENCIES
Tabel
Table
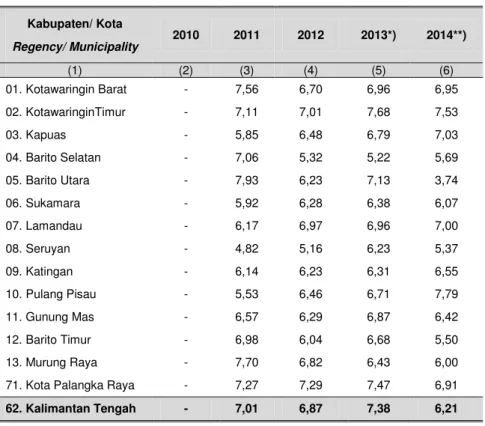
12.2. Laju Pertumbuhan Produk Domestik Regional Bruto Atas Dasar Harga Konstan (2010=100) Beberapa Kabupaten/ Kota Menurut Harga Konstan di Kalimantan Tengah (Persen), 2010 – 2014
Growth of Gross Domestic Regional Based on Constant Price (2010=100) Product in Regencies/ Municipality by Constant Price in Kalimantan Tengah (percentage), 2010 – 2014 Kabupaten/ Kota Regency/ Municipality 2010 2011 2012 2013*) 2014**) (1) (2) (3) (4) (5) (6) 01. Kotawaringin Barat - 7,56 6,70 6,96 6,95 02. KotawaringinTimur - 7,11 7,01 7,68 7,53 03. Kapuas - 5,85 6,48 6,79 7,03 04. Barito Selatan - 7,06 5,32 5,22 5,69 05. Barito Utara - 7,93 6,23 7,13 3,74 06. Sukamara - 5,92 6,28 6,38 6,07 07. Lamandau - 6,17 6,97 6,96 7,00 08. Seruyan - 4,82 5,16 6,23 5,37 09. Katingan - 6,14 6,23 6,31 6,55 10. Pulang Pisau - 5,53 6,46 6,71 7,79 11. Gunung Mas - 6,57 6,29 6,87 6,42 12. Barito Timur - 6,98 6,04 6,68 5,50 13. Murung Raya - 7,70 6,82 6,43 6,00
71. Kota Palangka Raya - 7,27 7,29 7,47 6,91
62. Kalimantan Tengah - 7,01 6,87 7,38 6,21
Sumber : Badan Pusat Statistik Provinsi Kalimantan Tengah Source : BPS – Statistics of Kalimantan Tengah
*) Data Sementara/ Preliminary Data
Tabel
Table 12.3. Persentase Penduduk Miskin Menurut Kabupaten/ Kota di Kalimantan Tengah, 2009 – 2014
Percentage of Poor People Some of Regencies/ Municipality in Kalimantan Tengah, 2009– 2014 Kabupaten/Kota Regency/ Municipality 2009 2010 2011 2012 2013 2014 (1) (2) (3) (4) (5) (6) (7) 01. Kotawaringin Barat 6,87 6,27 6,19 5,64 5,44 … 02. KotawaringinTimur 8,21 8,22 7,43 6,91 6,85 … 03. Kapuas 6,34 5,82 6,28 6,11 6,19 … 04. Barito Selatan 8,14 7,07 7,56 7,26 6,26 … 05. Barito Utara 6,43 6,34 6,33 6,1 5,98 … 06. Sukamara 5,91 6,61 5,90 5,37 4,56 … 07. Lamandau 5,57 5,35 5,18 4,66 4,87 … 08. Seruyan 8,84 10,58 8,82 7,92 8,77 … 09. Katingan 7,00 6,65 6,47 6,1 6,55 … 10. Pulang Pisau 6,23 5,22 5,45 5,25 5,45 … 11. Gunung Mas 7,43 7,19 7,12 6,56 6,90 … 12. Barito Timur 9,24 9,89 9,27 8,53 8,83 … 13. Murung Raya 6,94 6,55 6,30 5,78 6,44 …
71. Kota Palangka Raya 4,76 5,24 4,69 4,24 3,94 … 62. Kalimantan Tengah 7,01 6,77 6,64 6,19 6,23 … Sumber : Badan Pusat Statistik Kabupaten Murung Raya
328 Murung Raya in Figures 2015
COMPARISON AMONG REGENCIES
Tabel
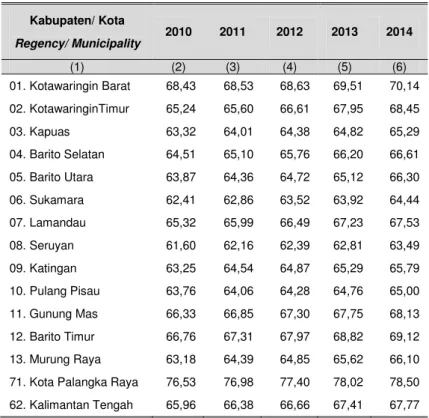
Table 12.4. Indeks Pembangunan Manusia (IPM) menurut Kabupaten/ Kota di Kalimantan Tengah, 2010 – 2014
Human Development Index (HDI) by Regencies/ Municipality in Kalimantan Tengah, 2010 – 2014 Kabupaten/ Kota Regency/ Municipality 2010 2011 2012 2013 2014 (1) (2) (3) (4) (5) (6) 01. Kotawaringin Barat 68,43 68,53 68,63 69,51 70,14 02. KotawaringinTimur 65,24 65,60 66,61 67,95 68,45 03. Kapuas 63,32 64,01 64,38 64,82 65,29 04. Barito Selatan 64,51 65,10 65,76 66,20 66,61 05. Barito Utara 63,87 64,36 64,72 65,12 66,30 06. Sukamara 62,41 62,86 63,52 63,92 64,44 07. Lamandau 65,32 65,99 66,49 67,23 67,53 08. Seruyan 61,60 62,16 62,39 62,81 63,49 09. Katingan 63,25 64,54 64,87 65,29 65,79 10. Pulang Pisau 63,76 64,06 64,28 64,76 65,00 11. Gunung Mas 66,33 66,85 67,30 67,75 68,13 12. Barito Timur 66,76 67,31 67,97 68,82 69,12 13. Murung Raya 63,18 64,39 64,85 65,62 66,10 71. Kota Palangka Raya 76,53 76,98 77,40 78,02 78,50 62. Kalimantan Tengah 65,96 66,38 66,66 67,41 67,77 Sumber : Badan Pusat Statistik
Tabel
Table
12.5. Upah Minimum Provinsi (UMP) menurut Kabupaten/ Kota di Kalimantan Tengah (Rp/Bulan), 2010 – 2014
Minimum Regional Wages (MRW) by Regencies/ Municipality in Kalimantan Tengah, 2010 – 2014
Kabupaten/ Kota/ Regency/ Municipality
Upah Minimum Regional (UMR) (Rp/bulan)/ Minimum Regional Wages (MRW) (Rp/month)
2010 2011 2012 2013 2014 (1) (2) (3) (5) (5) (6) 01. Kotawaringin Barat 1 059 754 1 239 912 1 401 101 1 583.244 1 789 066 02. KotawaringinTimur 1 008 418 765 868 1 386 500 1 608 340 1 817 424 03. Kapuas 986 590 1 145 926 1 340 734 1 568 658 1 741 210 04. Barito Selatan 1 029 153 1 183 526 1 361 055 1 606 044 1 895 132 05. Barito Utara 1 002 778 1 158 208 1 361 668 1 568 658 1 775 689 06. Sukamara 986 590 1 134 580 1 327 459 1 678 238 1 929 973 07. Lamandau 986 590 1 134 580 1 327 459 1 553 127 1 723 970 08. Seruyan 986 590 1 134 580 1 394 000 1 617 040 1 827 255 09. Katingan 986 590 1 134 580 1 327 459 1 553 127 1 723 970 10. Pulang Pisau 986 590 1 134 580 1 327 459 1 553 127 1 723 970 11. Gunung Mas 986 590 1 134 580 1 327 459 1 553 127 1 723 970 12. Barito Timur 986 590 1 134 580 1 327 459 1 553 127 1 723 970 13. Murung Raya 1 045 007 1 212 208 1 442 528 1 731 034 1 938 758 71. Kota Palangka Raya 986 590 1 154 310 1 396 715 1 676 058 1 843 664 62. Kalimantan Tengah 986 590 1 134 580 1 327 459 1 553 127 1 723 970
Sumber : Dinas Tenaga Kerja dan Transmigrasi Provinsi Kalimantan Tengah Source : Regional office of Transmigration and Man Power of Kalimantan Tengah
330 Murung Raya in Figures 2015
COMPARISON AMONG REGENCIES
Tabel
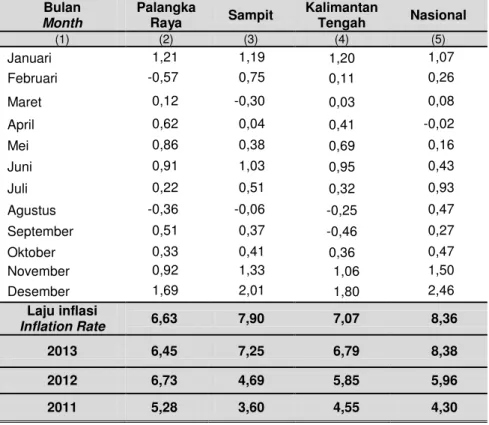
Table
12.6. Laju Inflasi Kota Palangka Raya, Sampit, Kalimantan Tengah dan Nasional Menurut Bulan, 2014
Inflation Rate in Palangka Raya, Sampit, Kalimantan Tengah and National by Month, 2014
Bulan Month Palangka Raya Sampit Kalimantan Tengah Nasional (1) (2) (3) (4) (5) Januari 1,21 1,19 1,20 1,07 Februari -0,57 0,75 0,11 0,26 Maret 0,12 -0,30 0,03 0,08 April 0,62 0,04 0,41 -0,02 Mei 0,86 0,38 0,69 0,16 Juni 0,91 1,03 0,95 0,43 Juli 0,22 0,51 0,32 0,93 Agustus -0,36 -0,06 -0,25 0,47 September 0,51 0,37 -0,46 0,27 Oktober 0,33 0,41 0,36 0,47 November 0,92 1,33 1,06 1,50 Desember 1,69 2,01 1,80 2,46 Laju inflasi Inflation Rate 6,63 7,90 7,07 8,36 2013 6,45 7,25 6,79 8,38 2012 6,73 4,69 5,85 5,96 2011 5,28 3,60 4,55 4,30
Sumber : Badan Pusat Statistik Provinsi Kalimantan Tengah Source : BPS - Statistics of Kalimantan Tengah Province
Tabel
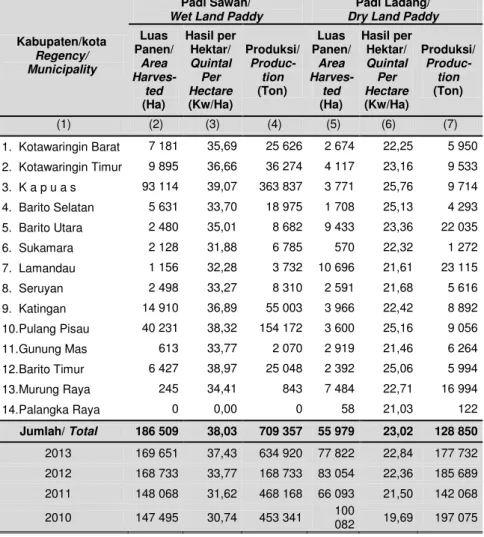
Table
12.7. Luas Panen dan Produksi Padi Ladang dan Padi Sawah Menurut Kabupaten/Kota di Kalimantan Tengah, 2014
The Harvested Area and Production of Wet Land Paddy and Dry Land Paddy by Regencies in Kalimantan Tengah Province, 2014
Kabupaten/kota Regency/ Municipality
Padi Sawah/ Wet Land Paddy
Padi Ladang/ Dry Land Paddy Luas Panen/ Area Harves-ted (Ha) Hasil per Hektar/ Quintal Per Hectare (Kw/Ha) Produksi/ Produc-tion (Ton) Luas Panen/ Area Harves-ted (Ha) Hasil per Hektar/ Quintal Per Hectare (Kw/Ha) Produksi/ Produc-tion (Ton) (1) (2) (3) (4) (5) (6) (7) 1. Kotawaringin Barat 7 181 35,69 25 626 2 674 22,25 5 950 2. Kotawaringin Timur 9 895 36,66 36 274 4 117 23,16 9 533 3. K a p u a s 93 114 39,07 363 837 3 771 25,76 9 714 4. Barito Selatan 5 631 33,70 18 975 1 708 25,13 4 293 5. Barito Utara 2 480 35,01 8 682 9 433 23,36 22 035 6. Sukamara 2 128 31,88 6 785 570 22,32 1 272 7. Lamandau 1 156 32,28 3 732 10 696 21,61 23 115 8. Seruyan 2 498 33,27 8 310 2 591 21,68 5 616 9. Katingan 14 910 36,89 55 003 3 966 22,42 8 892 10. Pulang Pisau 40 231 38,32 154 172 3 600 25,16 9 056 11. Gunung Mas 613 33,77 2 070 2 919 21,46 6 264 12. Barito Timur 6 427 38,97 25 048 2 392 25,06 5 994 13. Murung Raya 245 34,41 843 7 484 22,71 16 994 14. Palangka Raya 0 0,00 0 58 21,03 122 Jumlah/ Total 186 509 38,03 709 357 55 979 23,02 128 850 2013 169 651 37,43 634 920 77 822 22,84 177 732 2012 168 733 33,77 168 733 83 054 22,36 185 689 2011 148 068 31,62 468 168 66 093 21,50 142 068 2010 147 495 30,74 453 341 100 082 19,69 197 075
332 Murung Raya in Figures 2015
COMPARISON AMONG REGENCIES
Lanjutan Tabel/Continued Table 12.7
Kabupaten/Kota Regency/ Municipality
Jumlah Padi Sawah dan Ladang/ Total of Wet and Dry Land Paddy Luas Panen/ Area Harvested (Ha) Hasil per Hektar/ Quintal Per Hectare (Kw/Ha) Produksi/ Production (Ton) (1) (8) (9) (10) 1. Kotawaringin Barat 9 855 32,04 31 576 2. Kotawaringin Timur 14 012 32,69 45 807 3. K a p u a s 96 885 38,56 373 551 4. Barito Selatan 7 339 31,70 23 268 5. Barito Utara 11 913 25,78 30 717 6. Sukamara 2 698 29,86 8 057 7. Lamandau 11 852 22,65 26 847 8. Seruyan 5 089 27,36 13 926 9. Katingan 18 876 33,85 63 895 10. Pulang Pisau 43 831 37,24 163 228 11. Gunung Mas 3 532 23,60 8 334 12. Barito Timur 8 819 35,20 31 042 13. Murung Raya 7 729 23,08 17 837 14. Palangka Raya 58 21,03 122 Jumlah/ Total 242 488 34,57 838 207 2013 247 473 32,84 812 652 2012 251 787 30,01 755 507 2011 214 161 28,49 610 236 2010 247 577 26,27 650 416
Sumber : Badan Pusat Statistik Provinsi Kalimantan Tengah dan Dinas Pertanian dan Peternakan Provinsi Kalimantan Tengah
Source : BPS-Statistics of Kalimantan Tengah Province and Agricultural and Farming Service of Kalimantan Tengah Province
Tabel
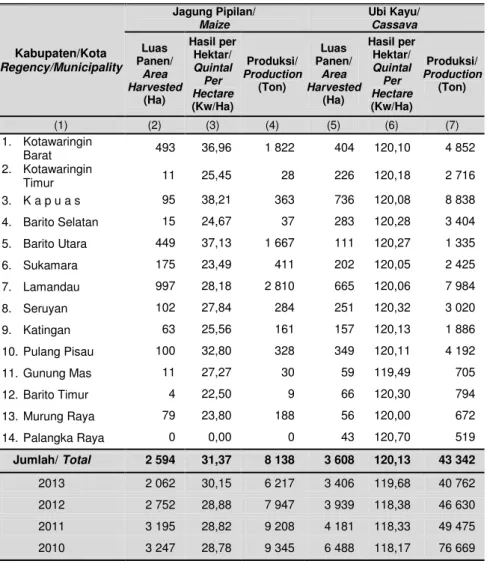
Table
12.8. Luas Panen dan Produksi Jagung, Ubi kayu. Dan Ubi Jalar Menurut Kabupaten/Kota di Kalimantan Tengah, 2014
The Harvested Area and Production of Maize, Cassava, and Sweet Potatoes by Regency/ Municipality in Kalimantan Tengah Province, 2014
Kabupaten/Kota Regency/Municipality Jagung Pipilan/ Maize Ubi Kayu/ Cassava Luas Panen/ Area Harvested (Ha) Hasil per Hektar/ Quintal Per Hectare (Kw/Ha) Produksi/ Production (Ton) Luas Panen/ Area Harvested (Ha) Hasil per Hektar/ Quintal Per Hectare (Kw/Ha) Produksi/ Production (Ton) (1) (2) (3) (4) (5) (6) (7) 1. Kotawaringin Barat 493 36,96 1 822 404 120,10 4 852 2. Kotawaringin Timur 11 25,45 28 226 120,18 2 716 3. K a p u a s 95 38,21 363 736 120,08 8 838 4. Barito Selatan 15 24,67 37 283 120,28 3 404 5. Barito Utara 449 37,13 1 667 111 120,27 1 335 6. Sukamara 175 23,49 411 202 120,05 2 425 7. Lamandau 997 28,18 2 810 665 120,06 7 984 8. Seruyan 102 27,84 284 251 120,32 3 020 9. Katingan 63 25,56 161 157 120,13 1 886 10. Pulang Pisau 100 32,80 328 349 120,11 4 192 11. Gunung Mas 11 27,27 30 59 119,49 705 12. Barito Timur 4 22,50 9 66 120,30 794 13. Murung Raya 79 23,80 188 56 120,00 672 14. Palangka Raya 0 0,00 0 43 120,70 519 Jumlah/ Total 2 594 31,37 8 138 3 608 120,13 43 342 2013 2 062 30,15 6 217 3 406 119,68 40 762 2012 2 752 28,88 7 947 3 939 118,38 46 630 2011 3 195 28,82 9 208 4 181 118,33 49 475
334 Murung Raya in Figures 2015
COMPARISON AMONG REGENCIES
Lanjutan Tabel/Continued Table 12.8
Kabupaten/ Kota Regency/ Municipality Ubi Jalar Sweet Potatoes Luas Panen/ Area Harvested (Ha)
Hasil per Hektar/ Quintal Per Hectare (Kw/Ha) Produksi/ Production (Ton) (1) (8) (9) (10) 1. Kotawaringin Barat 130 70,77 920 2. Kotawaringin Timur 55 70,55 388 3. K a p u a s 114 75,44 860 4. Barito Selatan 127 70,79 899 5. Barito Utara 74 71,76 531 6. Sukamara 140 70,07 981 7. Lamandau 316 70,85 2 239 8. Seruyan 96 71,25 684 9. Katingan 51 71,18 363 10. Pulang Pisau 85 70,82 602 11. Gunung Mas 13 71,54 93 12. Barito Timur 21 70,48 148 13. Murung Raya 35 71,14 249 14. Palangka Raya 13 70,00 91 Jumlah /Total 1 270 71,24 9 048 2013 1 292 71,27 9 208 2012 1 339 71,14 9 525 2011 1 205 71,12 8 570 2010 1 350 70,99 9 583
Sumber : Badan Pusat Statistik Provinsi Kalimantan Tengah dan Dinas Pertanian dan Peternakan Provinsi Kalimantan Tengah
Source : BPS-Statistics of Kalimantan Tengah Province and Agricultural and Farming Service of Kalimantan Tengah Province
Tabel
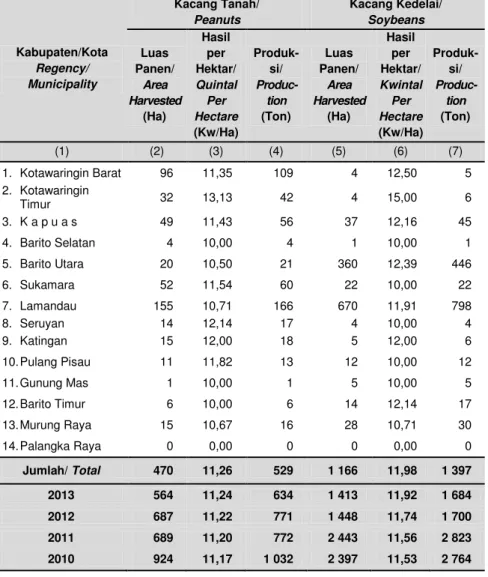
Table
12.9. Luas Panen dan Produksi Kacang Tanah, Kacang Kedelai, dan Kacang Hijau Menurut Kabupaten/Kota di Kalimantan Tengah, 2014
The Harvested Area and Production of Peanuts,
Soybeans, and Mung Beans by Regency/ Municipality in Kalimantan Tengah Province, 2014
Kabupaten/Kota Regency/ Municipality Kacang Tanah/ Peanuts Kacang Kedelai/ Soybeans Luas Panen/ Area Harvested (Ha) Hasil per Hektar/ Quintal Per Hectare (Kw/Ha) Produk-si/ Produc-tion (Ton) Luas Panen/ Area Harvested (Ha) Hasil per Hektar/ Kwintal Per Hectare (Kw/Ha) Produk-si/ Produc-tion (Ton) (1) (2) (3) (4) (5) (6) (7) 1. Kotawaringin Barat 96 11,35 109 4 12,50 5 2. Kotawaringin Timur 32 13,13 42 4 15,00 6 3. K a p u a s 49 11,43 56 37 12,16 45 4. Barito Selatan 4 10,00 4 1 10,00 1 5. Barito Utara 20 10,50 21 360 12,39 446 6. Sukamara 52 11,54 60 22 10,00 22 7. Lamandau 155 10,71 166 670 11,91 798 8. Seruyan 14 12,14 17 4 10,00 4 9. Katingan 15 12,00 18 5 12,00 6 10. Pulang Pisau 11 11,82 13 12 10,00 12 11. Gunung Mas 1 10,00 1 5 10,00 5 12. Barito Timur 6 10,00 6 14 12,14 17 13. Murung Raya 15 10,67 16 28 10,71 30 14. Palangka Raya 0 0,00 0 0 0,00 0 Jumlah/ Total 470 11,26 529 1 166 11,98 1 397 2013 564 11,24 634 1 413 11,92 1 684 2012 687 11,22 771 1 448 11,74 1 700
336 Murung Raya in Figures 2015
COMPARISON AMONG REGENCIES
Lanjutan Tabel/Continued Table 12.9
Kabupaten/Kota Regency/ Municipality Kacang Hijau/ Mung Beans Luas Panen/ Area Harvested (Ha)
Hasil per Hektar/ Quintal Per Hectare (Kw/Ha) Produksi/ Production (Ton) (1) (8) (9) (10) 1. Kotawaringin Barat 4 7,50 3 2. Kotawaringin Timur 1 10,00 1 3. K a p u a s 1 10,00 1 4. Barito Selatan 2 10,00 2 5. Barito Utara 10 8,00 8 6. Sukamara 1 10,00 1 7. Lamandau 47 8,30 39 8. Seruyan 0 0,00 0 9. Katingan 4 10,00 4 10. Pulang Pisau 0 0,00 0 11. Gunung Mas 0 0,00 0 12. Barito Timur 0 0,00 0 13. Murung Raya 0 0,00 0 14. Palangka Raya 0 0,00 0 Jumlah/ Total 70 8,43 59 2013 127 8,27 105 2012 210 8,24 173 2011 125 8,24 103 2010 206 8,25 170
Sumber : Badan Pusat Statistik Provinsi Kalimantan Tengah dan Dinas Pertanian dan Peternakan Provinsi Kalimantan Tengah
Source : BPS-Statistics of Kalimantan Tengah Province and Agricultural and Farming Service of Kalimantan Tengah Province