Introduction
This research pursue the uniqueness of In-donesia Initial Public Offering (IPO) that can not be accurately explained by previous studies conducted in developed countries. Theories and empirical findings on IPO cover many issues such as asymmetric information (Baron, 1982), shareholders wealth maximization (Aggarwal et al, 2002), asymmetric information and sign-aling by high quality firms (Ritter and Welch, 2002), decision of percentage of shares to be of-fered (Zheng et al, 2005), high initial return but low long-run return (Georgen, 2007), and also
many other empirical reports. However, this re-search offers modified approaches to adopt spe -cific Indonesia context.
The discussion of Indonesia IPO is started with how the allotment rules for IPO shares are implemented.1 The underwriters were allowed
to separate issued shares into two kinds of allot-ments, namely fixed allotment which is a much larger proportion of around 98% of the total new shares, and pooling allotment which is only 2% of the total shares. The fixed allotment shares are usually offered to institutional inves-tors during the book building before the offer-ing period, and the shares of pooloffer-ing allotment
Post-IPO Stock Return: Empirical Study on Jakarta Stock
Exchange 2009-2012
Sugeng Purwanto*
Paramadina Graduate School of Business, Indonesia
Ritter and Welch (2002) explain there are two types of IPO firms, namely higher quality firms and lower quality firms. This research propose the third type, namely bad IPO firms which manipulate and force IPO underpricing. Bad IPO firms are subset of lower quality IPO firms that force false signal as higher quality firms. The false signal was hidden by managing post-IPO trading. Trading management are indirectly funded by using balance sheet cash. Hypothesis testing with the empirical model 1 was to confirm the role of CashRatio as the moderating variable that interact DER to affect IPO underpricing which originally was not. The findings support the predictions that interactive variable DER*CashRatio affect IPO underpricing. A managed trading had a non negative profits constraint so that selective post-IPO trading was conducted to cause trading imbalance observable as skewed trading volume (Skewness). Subsequent tests with the empirical model 2 was to confirm the role of Skewness as the moderating variable that interact VolRatio to affect post-IPO stock return (RGM) which originally was not. The findings support the predictions that interactive variable LnVolRatio*Skew affect RGM. Both findings confirm this research predictions on the possibility of manipulated IPO trading in Indonesia IPO 2009-2012.
Keywords: CashRatio, DER, Initial Return, Skewness, Underpricing, VolRatio
* The Energy 22nd, SCBD Lot 11A Jl. Jend. Sudirman Kav. 52-53, Jakarta, Indonesia, 12190. Email:
would be allocated to retail investors. Fixed allotment would be a guaranteed purchase or-ders through the underwriters; these are bidding commitments so that the demand for the fixed allotment will be known before the second and final filling to the regulator.
On the contrary, demand by retail inves-tors of pooling allotment shares would only be known after the offering period; it could not be known in advance.
After the offering period, it would also be known whether the number of shares demanded exceed the number of shares allocated on the pooling allotment. At this stage, news of ei-ther over-subscribe or under-subscribe will be known by public; which was actually refer to the pooling allotment only. Fixed allotment would not be changed, an order cancellation of the fixed allotment was not an option.
On the other side, new demands by institu-tional investor was also possible. However, the underwriter would only fulfil the new demands by selling reserves from the fixed allotment if the underwriter had planned to do so. Fulfil -ment of new demands of institutional investors from the pooling allotment is not preferable because of the risks of decreasing number of public investors.2
There are two expected good news of IPOs : (1) Over-subscribe, and (2) IPO underpricing.2
Logically, an over-subscribe IPO would be fol-lowed by an IPO underpricing. But it is not
al-ways the case.
It is also important to note that unlike in New York Stock Exchange or other developed stock exchanges, there is no market maker in Indonesia Stock Exchange (IDX).
As explained, pooling account is merely small portion of the IPO. This is the root of op-portunity for manipulation why over–subscrip-tion along with IPO underpricing can be created as signal of successful IPOs.
If manipulated IPO trading exists, then the funding is needed. There should be role of founder shareholders to force top management of IPO firms to allow indirect utilization of bal -ance sheet cash. Other than this, subsequent
manipulation in the form of managed post-IPO trading should be done to hide the false signal of IPO underpricing. But there is a constraint of non-zero profits during the market operations which create certain trading pattern.
With regard to the above preliminary ob -servations, this research name the IPO firms which conducted manipulated trading as bad IPO firms.
The research problem is whether the pres-ence of bad IPO firms can be explained by fac -tors related to balance sheet cash and post-IPO trading volume pattern.
There are two research questions: (1) What factors and whether the ratio of the balance sheet cash to the IPO proceed affect IPO under-pricing in Indonesia, and (2) What factors and whether the volume trading skewness affect post-IPO stock return.
The objective of this study is to find the an -swer of the possible existence of bad IPO firms that manipulated IPO underpricing and man-aged post-IPO trading.
Basically, the newness and main contribu-tions of this research are : 1). Modification of the IPO firms concept of Ritter and Welch (2002) and raising the concept of so called bad IPO firms, 2). Application of moderating vari -able related to balance sheet cash that explain IPO underpricing, 3). Application of moderat-ing variable related to post-IPO tradmoderat-ing volume that explain post-IPO stock return, 4). A method that bad IPO firms can be empirically observed and explained.
Literature Review
Previous reports of IPO studies consider many important things which are more appli-cable to the developed capital markets. Some of previous IPO studies are the explanation of percentage of shares to be offered, IPO pric-ing, and future stock performance. Zheng et al (2005) state that during an IPO, several im-portant factors are considered imim-portant which include the percentage of shares offered, IPO pricing, and IPO underpricing. Other than these,
long-run trading liquidity is one of the founder shareholders objectives. Georgen (2007) reem-phasize the past empirical evidences of two main anomalies on the IPO, notably high initial return but poor long-run return.
Other objective of IPO underpricing is the long-run founder shareholders wealth maximi-zation as explained by Aggarwal et al (2002), and Ang and Brau (2003) as cited by Zheng et al (2005).
Empirical studies also provide evidences of IPO underpricing according with finance literature that provide theoretical explanation including asymmetric information as reported by Baron (1982), Rock (1986), Welch (1989), Grinblatt and Hwang (1989), Faulhaber (1989), and Balvers et al (1993). IPO firms deliber -ately underprice their shares to create signal of a good quality. However, to create signals the IPO firms should bear the cost of underpricing; they sell the shares lower than fair market price. Booth and Chua (1996) explain IPO under -pricing will induce investors to provide infor-mation to the IPO firms and eventually will lead to IPO over-subscribing.
Ritter and Welch (2002) explain asymmetric information on IPO that higher quality firms de -liberately underprice their shares to deter lower quality firms from imitating their actions. Theo -retical framework of this research is built and based on the IPO signaling theory. But modifi -cations are developed to accommodate the In-donesia context. The main difference of argu-ments of this research compared with Ritter and Welch (2002) is lower quality IPO firms may be able to imitate signal by higher quality IPO firms by creating false signal of manipulated IPO underpricing and managed post-IPO trad-ing. The false signal might not be known by in-vestors during the period of price management and operations.
Aggarwal and Wu (2006) explain variety ways of stock price manipulation that can also be taken by corporate insiders. It is explained how insiders may manage stock price and ing volume with the objective of creating trad-ing profits.
Chen et al (2001) report the relation of stock market return, trading volume, and volatility in
nine major stock markets and found that trad-ing volume provides information to the stock index.
The arguments of Ritter and Welch (2002) on IPO underpricing as signaling imply: (1) IPO firms hold superior information relative to the investors regarding the future prospects of the firms, (2) There exist lower quality of IPO firms try mimicking the signal of higher quality IPO firms by IPO underpricing but could not to do so because IPO underpricing is costly.
This research build arguments for signaling concept of IPO underpricing as follow:
1. Higher quality IPO firms send true signal and the investors believe it. This is a real IPO underpricing.
2. Higher quality IPO firms send true signal. But investors do not believe it. IPO under-pricing may not exist.
3. Lower quality IPO firms which can not send signal be honest, there is no IPO underpric-ing.
4. Some lower quality IPO firms send false sig -nal and force IPO underpricing. These types of firms are named bad IPO firms.
Bad IPO firms were able manipulating IPO underpricing by utilizing balance sheet cash indirectly. They manipulate the trading by uti-lizing founder shareholders shares which is much larger than the pooling allotment shares that only 2% of the total IPO shares. Founder shareholders had to manage and negotiate with investors that hold significant fixed allotment shares not to sell their shares in order to avoid stock price down. In Indonesia case, it is pos-sible if IPO float is not large and the respec -tive investors are within the group of founder shareholders. IPO trading manipulation should be continued until post-IPO to hide the false signal. Funding requirements were facing a non negative profits constraint so that selective post-IPO trading activities had to be employed. This constraint may create trading imbalance observable as skewed post-IPO trading volume. If the investors do not know the signal was ac-tually false, then the trading support by bad IPO firms would be minimal.
manipulated IPO underpricing and managed post-IPO trading. Lower quality IPO firms are defined as firms with high debt-to-equity ratio (DER) and/ or negative operating cash flow. A bad IPO firms are defined as a subset of lower quality firms with these following additional ar -guments:
High DER alone may not cause IPO un -derpricing. But DER moderated by CashRatio will positively affect IPO underpricing. The operational variable is the interactive variable DER*CashRatio to affect IPO underpricing. It is the necessary condition.
VolRatio which is measured as the ratio be -tween first-day trading volume and the mean of post-IPO trading volume may not affect stock return. But VolRatio moderated by post-IPO volume trading skewness may have significant effect to post-IPO stock return. Interactive vari-able of Volratio*Skew to negatively affect post-IPO stock return. It is the sufficient condition.
Research Methods
Hypotheses of IPO underpricing
IPO underpricing is measured as Initial Re -turn. The main focus of the model 1 is the varia-ble of CashRatio which moderate DER to affect Initial Return. DER should not affect Initial Re -turn; as well as CashRatio should not. But DER moderated by CashRatio should affect Initial Return in order to confirm a manipulated IPO underpricing to exist. Interaction variable of DER and CashRatio, namely DER*CashRatio is predicted to positively affect Initial Return. Mendez (2011) found the higher the floating the lower the underpricing. The higher the IPO underpricing the higher the price-to-earning-ratio (PER) of the IPO firms ceteris paribus, so that difference of IPO firms PER and sub-sec -tor PER should positively influence the degree of IPO underpricing. Return on equity (ROE) measures the management performance with respect to the founder shareholders equity; the higher the ROE the better the performance and the higher the firm quality. DER should posi -tively affect initial return.
Habib and Ljungqvist (2001) using
Loga-rithmic age as proxy of ex-ante uncertainty that affect IPO underpricing. Loughran and Ritter (2004) using calendar year of IPO minus cal-endar year of incorporation as measurement of variable that also affect IPO underpricing. Derrien and Womack (2003) show the effect of market conditions to IPO underpricing.
The alternate hypotheses statements:
H1.1.: Debt-to-equity ratio moderated by CashRatio affect Initial Return.
H1.2.: Volume of floating affect Initial Return. H1.3.: Difference of price-to-earning-ratio affect
Initial Return.
H1.4.: Difference return-to-equity affect Initial Return.
H1.5.: Sales affect Initial Return.
H1.6.: Age of IPO firm affect Initial Return. H
1.7.: Listing board affect Initial Return.
H1.8.: Five-day market return affect Initial Re -turn.
Hypotheses of post-IPO stock return
Higher quality IPO firms let the liquidity (volume), price, and stock return determined by the market post-IPO trading. On the oppo-site, bad IPO firms have to continue managing and supporting the post-IPO trading for certain trading period with the objective to continue imitating and confirming signal as higher qual -ity firms. A manipulated but smooth trading may be too costly if not followed by many in-vestors participating in the trading. With non negative profits as the constraint, there will be less liquid post-IPO trading volume relative to the first-day IPO trading. Hence, skewed trad -ing volume may exists. The prediction is that post-IPO stock return is affected by volume ratio which is moderated by volume trading skewness.
Ibbotson (1975) reported negative effect of initial return to long-term performance. How-ever, in the presence of bad IPO firms initial re -turn is the basis of the re-turn management. This research predict initial return positively affect post-IPO return.
manage-able to bad IPO firms if the number of stocks issued were smaller.
Pre-IPO balance sheet cash in the form CashRatio had been predicted to affect initial return in model 1. Post-IPO balance sheet cash will also be tested in model 2 whether it affect post-IPO stock return.
Schultz and Zaman (1994) show aftermarket support of an IPO is necessary to avoid stock price decline. Robinson et al (2004) explain the role of underwriters that the greater the stock retention the lower the probability of required after market price support.
The alternate hypotheses statements: H
2.1.: VolRatio moderated by skewness affect
post-IPO stock return.
H2.2.: IPO initial return affect post-IPO stock return.
H2.3.: Volume of IPO floating affect post-IPO stock return.
H2.4.: Post-IPO cash affect post-IPO stock re-turn.
H2.5.: Market return affect post-IPO stock re-turn.
Empirical models
There are two empirical models adopted. Model 1 will be used to test factors that cause IPO underpricing, and model 2 will be used to test factors that cause post-IPO stock return.
Model 1. IPO underpricing
IR i = α + β1 DER*CashRatioi + β2 Vfloati
+ β3 DPERi + β4 DROEi
+ β5 LnSalesi + β6 LnMoi
+ β7 Dboardi + β8 RM5i + εi 1)
Model 2. Post-IPO stock return
RGM i = γ + δ1 VolRatio*Skewi + δ2 IRi
+ δ3 Vfloati + δ4 LnCashPostIPOi
+ δ5 RMGMi + υi 2)
Result and Discussion
Descriptive statistics, estimation output model 1, and estimation output model 2 are presented in Table 3, Table 4, and Table 5 re-spectively.
The sample is post financial crisis IPOs listed in IDX of four years 2009-2012. When the financial turmoil facing the US in 2008, many Indonesia IPOs were postponed due to low demand for new issues and low valuation. There were only eight Indonesia firms floating their shares during the difficult year. Financial market began to recover in 2009 so the firms start building confidence toward stock market. The sample is 82 IPO firms consist of 13 IPOs (2009), 23 IPOs (2010), 25 IPOs (2011) and 22 IPOs (2012). There are 46 IPOs listed in the
Table 1. Variable definition of model 1
Variable Explanation Measurement
IR First-day of trading return [P1-Po]/Po. P1: first-day closing price, Po: offer price
Vfloat First-day trading liquidity Ln(first-day trading volume/ IPO floating percentage)
DER*CashRatio Interactive Variable
CashRatio: moderating variable Debt-to-equity ratio multiplied with CashRatioCashRatio = Pre-IPO cash/ IPO proceed
DPER Difference of PER (Firm PER–Subsector PER mean)/Subsector PER mean
DROE Difference of ROE IPO book ROE – Previous year ROE
LnSales Sales Ln(total sales)
LnMo Age Ln(months of Age from incorporation to the date of IPO) Dboard Dummy variable for listing “1” : if the main board, ” 0” : if the development board
RM5 Last-week market return Five-trading-day geometric return up to IPO date
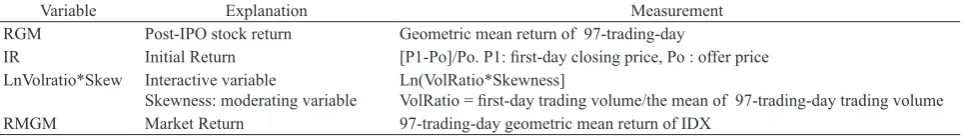
Table 2. Variable definition of model 2
Variable Explanation Measurement
RGM Post-IPO stock return Geometric mean return of 97-trading-day
IR Initial Return [P1-Po]/Po. P1: first-day closing price, Po : offer price
LnVolratio*Skew Interactive variable
Skewness: moderating variable
Ln(VolRatio*Skewness]
VolRatio = first-day trading volume/the mean of 97-trading-day trading volume
main board and 36 IPOs in the development board. The fundamental data were found from the IPO prospectus. Transaction data were col-lected from on-line trading provider.
The first IPO listing date was in 15 Janu -ary 2009 and the last date was in 19 December 2012. There are 70 IPOs underpricing, 11 IPOs overpricing, and one IPO neither underpricing nor overpricing (Table 3).
A window of 97-trading day is chosen so that the last trading day was in 14 May 2013 of the last IPO in 19 December 2012 IPO.4
Diagnostic tests.5
Test of multicollinearity for model 1 is con-ducted by using Variance Inflation Factor de -fined as VIF = 1/(1-ρ2) with a critical value of
10. There is no multicollinearity in the model 1. Test of heteroscedasticity for model 1 is con-ducted by using Glejser heteroscedasticity test with a critical value of │+/- 1.96│ at α=5%. There is no heteroscedasticity in the model 1.
There is also no multicollinearity on the model 2. Glejser heteroscedasticity test for model 2 provide the highest t-value of 2.72. However, there is no opportunity to take natu-ral logarithm on it because IR value could be negative. Other than this, standardization by taking the square root of negative numbers is not defined.6
Squared R and F-tests.
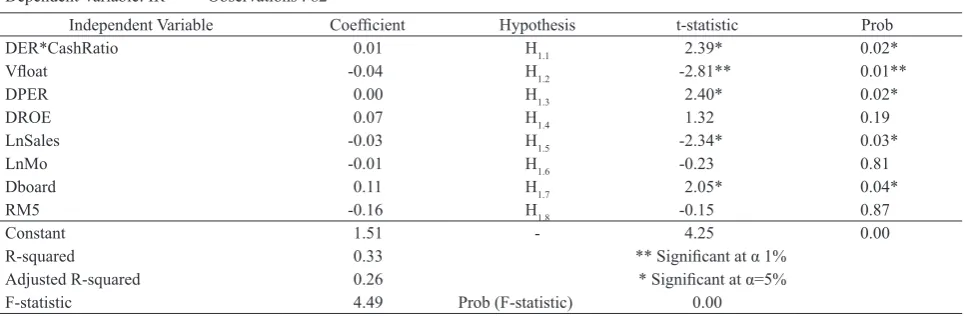
On the model 1, The R squared is 32.9% so that the variations of the dependent variable are only 32.9% explained by the variations of the independent variables. However, F-test of 4.49 is larger than the critical value of F-table of ~ 2.10 at α=5% (with degree of freedom of 8 for numerator and 72 for denominator) so that the null hypothesis of altogether β1 = β2 = β3 = β4 = β5 = β6 = β7 = β8 =0 should be rejected at α=5%. Model 1 is said to be valid.
On the model 2, the R squared is 22.5% so that the variations of the dependent variable are only 22.5% explained the variations of the in-dependent variables; while the other 77.5% are explained by the other factors do not included in the model. However the F-test with a null hypothesis of altogether δ1 = δ2 = δ3 = δ4 = δ5 = 0, with the degree-of-freedom of 5 for nu -merator and 76 for denominator at α=5% give a critical value ~ 2.37. The calculated F of 4.43
is larger than the critical value so that the null hypothesis should be rejected. The model 2 is also valid.
Analysis of IPO underpricing
Estimation of model 1 provide evidences IPO underpricing are explained by five explan -atory variables. But the other three variables do
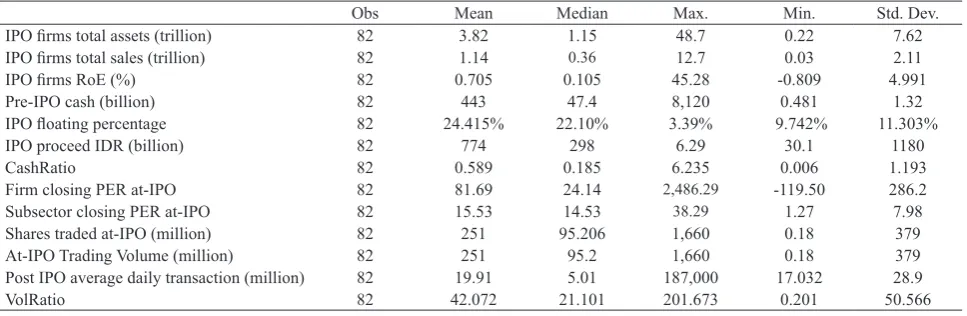
Table 3. Descriptive statistics of raw data
Obs Mean Median Max. Min. Std. Dev.
IPO firms total assets (trillion) 82 3.82 1.15 48.7 0.22 7.62
IPO firms total sales (trillion) 82 1.14 0.36 12.7 0.03 2.11
IPO firms RoE (%) 82 0.705 0.105 45.28 -0.809 4.991
Pre-IPO cash (billion) 82 443 47.4 8,120 0.481 1.32
IPO floating percentage 82 24.415% 22.10% 3.39% 9.742% 11.303%
IPO proceed IDR (billion) 82 774 298 6.29 30.1 1180
CashRatio 82 0.589 0.185 6.235 0.006 1.193
Firm closing PER at-IPO 82 81.69 24.14 2,486.29 -119.50 286.2
Subsector closing PER at-IPO 82 15.53 14.53 38.29 1.27 7.98
Shares traded at-IPO (million) 82 251 95.206 1,660 0.18 379 At-IPO Trading Volume (million) 82 251 95.2 1,660 0.18 379 Post IPO average daily transaction (million) 82 19.91 5.01 187,000 17.032 28.9
VolRatio 82 42.072 21.101 201.673 0.201 50.566
4 97-trading-day is arbitrary chosen that is sufficient to observe trading manipulations but not too long so that the observed pattern of post-IPO trading may be faded in the longer-term stock price movements.
5 There is no issue of serial correlation for cross-sectional data. Error is assumed normally distributed because sample is large enough.
not explain. The hypothesis testing is conduct-ed with null-hypothesis of βi = 0 at α=5% pro -vide a critical value of +/-1.96. The calculated t-statistics can be seen in the Table 4.
(a). DER*CashRatio.With regard to model 1, this research focus on the possible presence of bad IPO firms by investigating the role of CashRatio as the moderating variable. The esti -mated coefficient for DER*CashRatio is signif-icantly different from zero at α=5%. The con -clusion is DER*CashRatio positively explain Initial Return as expected. Other regression had been conducted that DER and CashRatio as two separate independent variables each does not explain Initial Return IR.
It is concluded that CashRatio has significant contribution to the causality of DER to Initial Return. DER*CashRatio is the interaction vari-able that affect IR. Test results of model 1 con -firm CashRatio as the moderating variable. The higher the DER*CashRatio the higher the IR (underpricing) the more favorable the IPO firms to the investors.
In relation with manipulated IPO underpricing, lower quality IPO firms with high DER with -out high CashRatio would not be able to force IPO underpricing and could not imitate signal as explained by Ritter and Welch (2002). But bad IPO firms were be able to do so by utiliz -ing the capacity of cash which is sufficiently available in the balance sheet. The higher the
DER*CashRatio which is in the same direction with the higher the ratio of balance sheet cash to the IPO proceed, the more power and confi -dence of bad IPO firms to finance the trading against shares from the pooling allotment.7
(b). Vfloat.The t-test for Vfloat is |-2.81| higher than critical value of |-1.96|; the null-hypothesis is rejected at α=5%. The conclusion is Vfloat
negatively affect initial return; the higher Vfloat the lower initial return. Recall that the measure -ment of Vfloat is the natural logarithm of the ra-tio of the first-day trading volume to the pecent -age of IPO floating. The expectation according to the theory is the higher the percentage of IPO float (denominator of the Vfloat measure-ment) the lower the IPO underpricing. How-ever, the result is the opposite. The possible ex-planation is in the case of bad IPO firms an IPO underpricing is a manipulation. The offer price was not underpriced and the first-day closing price was pushed upward; these activities were to create trading profits. In this case the higher the IPO float the higher the IPO underpricing in order to maximize manipulated trading profits.8
The results also imply the higher the first-day trading volume (numerator of Vfloat measure-ment) the lower the IPO underpricing. In the case of bad IPO firms, any involvement of fixed allotments investors outside the bad IPO firms group would affect manipulation activities. If the trading participation of these outside
in-7 It is also assumed that bad IPO firms had communicated with investors of fixed allotment shares with large ownership so that they would not destroy the plan.
8 Even if floating percentage is large, the total value of issued shares may be low in the case of bad IPO firms so that ma -nipulation management was still possible.
Table 4. Model 1 estimation output: Test for IPO underpricing
Dependent Variable: IR Observations : 82
Independent Variable Coefficient Hypothesis t-statistic Prob
DER*CashRatio 0.01 H1.1 2.39* 0.02*
Vfloat -0.04 H1.2 -2.81** 0.01**
DPER 0.00 H1.3 2.40* 0.02*
DROE 0.07 H1.4 1.32 0.19
LnSales -0.03 H1.5 -2.34* 0.03*
LnMo -0.01 H1.6 -0.23 0.81
Dboard 0.11 H1.7 2.05* 0.04*
RM5 -0.16 H1.8 -0.15 0.87
Constant 1.51 - 4.25 0.00
R-squared 0.33 ** Significant at α 1%
Adjusted R-squared 0.26 * Significant at α=5%
vestors along with pooling allotment investors were low, then the trading profits would be low because outsider participation volume were low. However, it was easier to push the price up to maximize trading profits. If the participa -tion were high which is observable as high first-day trading volume, then the IPO underpricing would be low because it was more difficult to push the price up. However, trading profits of bad IPO firms group might be high because out -sider participation volume were high. These are the explanations why Vfloat negatively affect initial return.
(c). DPER.Initial Return is positively affected by DPER at α=5%. Stock Price is determined by the earnings multiple PER and IPO firms earnings. If bad IPO firms exist, then logically they prefer managing a high PER rather than a high earnings. Earnings management is pos-sible. However, it is risky; earnings figure will be recorded as operating performance of bad IPO firms. On the other hand, a high PER is more subjective and determined by the market so that an upward bias is considered as market valuation.
(d). LnSales. The finding shows that LnSales negatively affect initial return. IPO underpric-ing is a signal (Ritter and Welch, 2002). Argu -ably, sales is also a signal of quality. The higher the sales the better the firms image. The higher the sales the lesser the degree of IPO under-pricing required as signal as good firms; ceteris paribus. The negative causality of LnSales to IPO initital return (underpricing) is as expected.
(e). Dboard. The findings show that DBoard positively affect IPO underpricing. Even if
there is no specific differences in treatments of trading in the two listing boards in IDX namely main board and development board, the listing in the main board is still considered more bona fide. Actually, to be listed in the main board in IDX is not a challenging task. Three main cri -teria are the year of incorporation, subsequent positive earnings, and the number of public in-vestors more than one thousand. When consid -ering IPO underpricing as a signal of a good firm quality, a listing in the main board should be preferable. Bad IPO firms prefer pursuing a main board listing to strengthen their false sig-nal. Hence, the positive effect of Dboard to Ini-tial Return is as expected.
(f). DROE, LnMo, and RM5. Three independ-ent variables namely : DROE, LnMo, and RM5 each do not affect initial return.
Analysis of post-IPO stock return
Hypothesis testing is conducted with sig-nificance level α=5% so that the critical value is +/- 1.96 to decide whether each independent variable to affect post-IPO stock return. The es-timated t-statistic can be seen in Table 5.
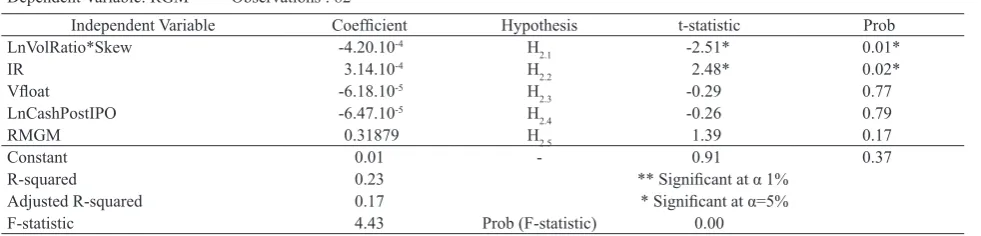
(a). LnVolRatio*Skew. The t-test show estimated t-value of |-2.509| is larger than critical value of |-1.96|; the null-hypothesis is rejected at α=5%. The conclusion is that LnVolRatio*Skew nega -tively affect RGM as expected.
Prior to the estimation of this regression, an-other estimation was conducted with stock re-turn as dependent variable against independent variables of VolRatio, Skewness, Vfloat, IR, LnCashPostIPO, and RMGM. Two separate independent variables VolRatio and skewness each does not affect stock return. The
causal-Table 5. Model 2 estimation output: Test of post-IPO stock return
Dependent Variable: RGM Observations : 82
Independent Variable Coefficient Hypothesis t-statistic Prob
LnVolRatio*Skew -4.20.10-4 H
RMGM 0.31879 H2.5 1.39 0.17
Constant 0.01 - 0.91 0.37
R-squared 0.23 ** Significant at α 1%
Adjusted R-squared 0.17 * Significant at α=5%
ity of VolRatio to stock return is significantly changed when Skewness is included in the form of interactive variable VolRatio*Skew. This finding support the prediction of this research. Skewness has significant contingent effect on the causality of VolRatio to post-IPO stock re-turn; the role of a moderating variable. When bad IPO firms manage post-IPO trading, they were facing a non negative constraint so that selective trading had to be adopted which cause skewed trading volume as predicted.
(b). IR. The results show a t-value of 2.48 so
that the null hypothesis of δ2 = 0 is rejected at at α=5%. Initial Return IR positively affect
post-IPO stock return; post-IPO firms which exhibits pos -itive IR will continue delivering positive
post-IPO return on the medium-term. In the case of bad IPO firms, the trading management will pursue positive post-IPO return to strengthen the false signal of IPO underpricing as long as non negative constraint is met.
(c). Vfloat. The result shows Vfloat do not af-fect post-IPO stock return. The indirect efaf-fect of Vfloat to medium-term stock return, if any, has already been captured by Initial Return IR on the test of model 1.
(d). LnCashPostIPO and RMGM. The result shows that LnCashPostIPO does not affect post-IPO stock return as expected. Stock valuation already consider post-IPO cash, there should be no surprise on this variable. The test on RMGM also shows no causality effect of RMGM as the control variable to post-IPO stock return.
Combined results of both models
The hypotheses testing of model 1 con-firm IPO underpricing is positively affected by DER*CashRatio with CashRatio as the moder
-ating variable.
The hypotheses testing of model 2 confirm post-IPO stock return is negatively affected by
LnVolRatio*Skew, with Skewness as the mod-erating variable.
Explanation of DER*CashRatio to initial return is the first or necessary condition to the presence of bad IPO firms which employ -ing the power of CashRatio to manipulate IPO underpricing. Further, the explanation of
LnVolRatio*Skew to post-IPO stock return is the second or sufficient condition for the pres -ence of bad IPO firms with skewed post-IPO trading volume to affect stock return.
Conclusion
The position of this research is to propose the concept of the presence of bad IPO firms. The first main finding is bad IPO firms could force IPO underpricing by utilizing the ratio of bal-ance sheet cash to the IPO proceed. The second main finding is non negative managed trading constraint would create skewed post-IPO trad-ing volume which affect post-IPO stock return. The first research questions can be answered that five factors, namely DER*CashRatio,
Vfloat, DPER, LnSales, and Dboard affect IPO underpricing. Particularly, CashRatio has sig-nificant contribution that interact to debt-to-eq -uity ratio to affect IPO underpricing. The sec-ond research question is also can be answered. Two factors, namely LnVolRatio*Skew, and IR
Aggarwal , R.K., Krigman, L., and Womack, K.L. (2002), Strategic IPO Underpricing, In -formation Momentum, and Lockup Expira-tion Selling, Journal of Financial
Econom-ics, 66: 105-107.
Aggarwal , R.K., and Wu, G., (2006), Stock Market Manipulations, Journal of
Business,University of Chicago, 79 (4): 1915-1953.
Ang, J.S., and Brau, J.C. (2003), Concealing and Confounding Adverse Signals : Insider Wealth-Maximizing Behavior in the IPO Process, Journal of Financial Economics, 73:149-172.
Balvers, R.J., and Affeck-Graves, J., Miller, R.E., and Scanlon, K. (1993), The Under -picing of Initial Public Offerings : A Theo-retical and Empirical Considerations of the Adverse Selection Hypothesis, Review of
Quantitative Finance and Accounting, 3: 221-239.
Baron (1982), A model of the Demand for In-vestment Banking Advising and Distribution Services for New Issues, Journal of Finance, 37: 955-976.
Chen, G.M., Firth, M., and Rui, O.M., (2001), The Dynamic Relation Between Stock Re -turns, Trading Volume, and Volatility, The
Financial Review, 38: 153-173.
Cooper, Donald R., and Schindler, Pamela S. (2014), Business Research Methods, Singa-pore: McGraw-Hill International Edition, 12th Edition, P.56.
Derrien F., Womack, K. (2003), Auction vs Book Building and the Control of Under -pricing in Hot IPO Markets, Review of
Fi-nancial Studies, 16: 31-61.
Faulhaber, Allen, F. (1989), Signaling by Un -derpricing in the IPO Market, Journal of
Fi-nancial Economics, 23: 303-323.
Fox, J. (1997), Applied Regression Analysis,
Linear Models, and Related Methods, Cali-fornia: Sage Publications, P.306.
Georgen, M., Khurshed, A., and Mudambi, R. (2007), The Long-Run Performance of UK IPO: Can It Be Predicted?, Emerald Group
Publishing Limited.
Green, William H. (2003), Econometric Analy-sis, New Jersey: Prentice Hall International
Edition, 5th Edition, P.56-60, 215-247. Grinblatt, M., Hwang (1989), Signaling and the
Pricing of New Issues, Journal of finance, 44: 393-420.
Gujarati, D. B., and Porter, D.C. (2009), Basic
Econometrics, Singapore: McGraw-Hill In-ternational Edition, 5th edition, P.320-346, 365-400.
Habib, M.A., and Ljungqvist, A.P. (2001), Un -derpricing and Entrepreneurial Wealth Loss -es in IPOs: Theory and Evidence, Review of
Financial Studies, 14:433–458.
Hilmer, C. E., and Michael J. H. (2014), Practi -cal Econometric, USA: McGraw-Hill Inter -national Edition, 1st Edition, P.264-278. Ibbotson, R.G. (1975), Price Performance of
Common Stock New Issue, Journal of
Fi-nancial Economics, 3: 235-272.
Loghran,T., Ritter, J.R. (2004), Why Has IPO Underpicing Changed Over Time?, Finan -cial Management, 33 (autumn): 5-37.
Mendez, and Jose, M. (2011), Underpricing of IPOs by Bulge-Bracket Underwriters Acting as Lead Managers and Sole Book Runners,
Journal of Business and Economic Research, Vol. 1 number 12: P 41-48.
Ritter, J.R. and Welch, I. (2002), A Review of IPO Activity, Pricing and Allocations,
Jour-nal of Finance, 57: 1795-1828.
Robinson, R. M., Robinson, M.A., and Peng, C.C. (2004), Underpricing and IPO Owner -ship Retention, Journal of Economics and Finance, 28: 132-146.
Rock, K. (1986), Why New Issues Are Under -priced, Journal of Financial Economics, 15: 187-212.
Schultz, P., and Zaman, M. (1994), Aftermarket Support and Underpricing of Initial Public Offering, Journal of Financial Economics, 35: 199-220.
Welch, I. (1989), Seasoned Offerings, Imitation Cost, and the Underpricing of Initial Public Offerings, Journal of Finance, 44: 421-449. WWW.bapepam.go.id, Bapepam’s regulation,
Zheng, S.X., Odgen, J., and Zen, F.D. (2005), Pursuing Value Through Liquidity in IPOs: Underpricing, Share Retention, Lockup, and