http://dx.doi.org/10.17503/Agrivita-2012-34-3-p239-250
CHANGE DETECTION OF CROPPING PATTERN IN PADDY FIELD USING MULTI
SPECTRAL SATELLITE DATA FOR ESTIMATING IRRIGATION WATER NEEDS
Rizatus Shofiyati1*), Satoshi Uchida2), Muhrizal Sarwani1) and Ishak H. Ismullah3)
1)
Indonesian Center for Agricultural Land Resources Research and Development (ICALRD) , Jl. Tentara Pelajar No. 12, Cimanggu, Bogor 16114, Indonesia
2)
Development Research Division, Japan International Research Center for Agricultural Science (JIRCAS) 1-1 Ohwashi, Tsukuba, Ibaraki 305-8686, Japan
3)
Faculty of Earth Science and Technology, Bandung Institute of Technology (ITB) of Indonesia Teknik Geodesi dan Geomatika ITB, Labtek IX C, Lt. 3, Jl. Ganesha No. 10, Bandung 40132
*) Corresponding author Phone : 62-251- 8323012 E-mail: [email protected]
Received: February 2, 2011/ Accepted: March 23, 2012
ABSTRACT
This paper investigates the use of multi spectral satellite data for cropping pattern monitoring in paddy field. The southern coastal of Citarum watershed, West Java Province was selected as study sites. The analysis used in this study is identifying crop pattern based on growth stages of wetland paddy and other crops by investi-gating the characteristic of Normalized Differen-ce Vegetation IndiDifferen-ces (NDVI) and Wetness of Tasseled Cap Transformation (TCT) derived from 14 scenes of Landsat TM date 1988 to 2001. In general, the phenological of growth stages of wetland paddy can be used to distinguish with other seasonal crops. The research results indicate that multi spectral satellite data has a great potential for identi-fication and monitoring cropping pattern in paddy field. Specific character of NDVI and Wetness can also produce a map of cropping pattern in paddy field that is useful to monitor agricultural land condition. The cropping pattern can also be used to estimate irrigation water needed of paddy field in the area. Expected implication of the information obtained from this analysis is useful for guiding more appropriate planning and better agricultural management. Keywords: cropping pattern, paddy field, multi
spectral satellite data, irrigation water needed
INTRODUCTION
Remote sensing technology has ability to record, produce, and analyze spatial data which
can be integrated with quantitative data and statistics. Some studies have identified paddy using optical satellite data which has been widely applied. Analysis by using logical knowledge and experience based on the spectral character can generate growth period of rice cropping calendar matrix. The result can be used to plan agricultural activities that are adapted to current rainfall conditions, cropping pattern, cropping intensity, and water supply.
Several methods have been developed by applying analysis based on assumption of rational (logical inference analysis) of growing period of paddy and vegetation greenness condition. Research conducted by Uchida (2007) using MODIS data with spatial resolution of 250 m, showed changes in NDVI values occurred in more than 0.2; 2 to 3 months. The same thing happened to change of wetness index (Normalized Difference Water Index - NDWI). P3TISDA-BPPT (2002), reported that curve of spectral could identify period of ripening. Result shows that spectral character of paddy during land preparation stage (0 days) until early vegetative growth (30 days) have no significant changes to a greenness color. Furthermore, differences in spectral values can be shown by significant color changes at the generative age of 50 days and when grain ready for harvest. Differences in spectral character were also shown in Landsat TM data at each growth
However, there is still a constraint in utilization of remote sensing technologies to detect paddy plants, namely the difficulty to distinguish appearance with some other seasonal crops and other land cover such as maize, grass, shrubs, and others. Combining two methods can eliminate difficulties of differentiation of paddy crop coverage. The specific character of NDVI (Tucker, 1979) and wetness of Tasseled Cap Transformation (TCT) developed by Crist dan Kauth (1986) can show the dynamic of paddy growing stage. The logical inference analysis of spectral characteristic based on knowledge of paddy growing stage can produce the crop calendar matrix.
The purpose of this study is to assess multi spectral satellite data for identifying paddy growth stage and classifying cropping pattern in paddy field. The map of cropping pattern can be used for estimating irrigation water needs. The results of this study are expected to contribute for developing agricultural management and planning.
MATERIALS AND METHODS
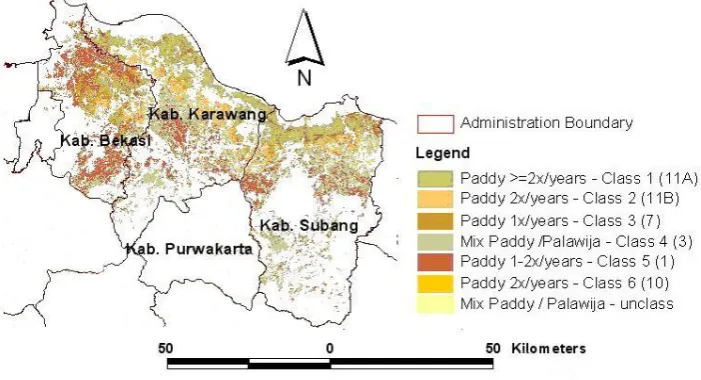
Bekasi, Karawang, and Subang District which are located in southern coastal of Citarum Watershed, West Java Province, were selected as study area. This region is situated at 106o58’
- 107o55’ East longitude and 5o55’- 6o47’ South latitude, as shown in Figure 1. The Citarum watershed is one of the main sources of irrigation water with significant contribution in national rice production.
Data Used
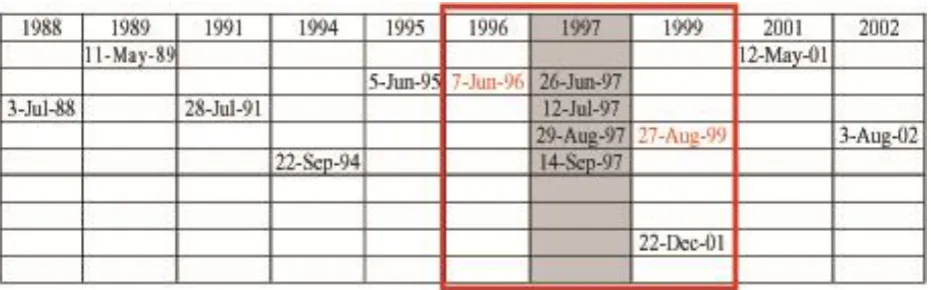
The 14 scenes of time series data of Landsat TM path/row 121/65, 122/64, and 122/65 were analyzed to get NDVI and Wetness of TCT. The acquisition date of data used is listed in Table 1. Other data used was Land Use Map of West Java Province produced by Local Government of West Java Province (2005).
Figure 1. Map of study area
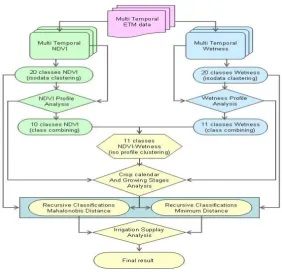
Research Method
The research procedure is presented in Figure 2. There were 4 main steps of analysis used in this study, i.e.: a) NDVI and Wetness value estimation, b) Isodata Unsupervised Classification for calculating separately NDVI and Wetness class of paddy growth stage , c) Supervised Classification for classifying paddy growth stage class using combination NDVI and Wetness, and d) NDVI-Wetness character analysis to recognize cropping pattern.
NDVI and Wetness of TCT calculation
The estimation of NDVI of Landsat TM is based on Toselli (1989), as follow:
NDVI = (Band 4 – Band 3) / (Band 4 – Band 3) where:
NDVI is between –1 to 1. While to calculate wetness of Landsat TM used formula of TCT by Crist dan Kauth (1986) :
Wetness = 0.1509B1 + 0.19731B2 + 0.3279B3 + 0.3406B4 - 0.7112B5 - 0.4572B7 where: B is band of Landsat TM.
Isodata Unsupervised Classification
Isodata Unsupervised Classification is a statistical "clustering" algorithms used to select spectral classes inherent to the data, more computer-automated. It has been used for calculating class of paddy growth stage by clustering NDVI and Wetness. It calculates class means evenly distributed in the data space then iteratively clusters the remaining pixels using minimum distance techniques. The iteration used was 3. Each iteration recalculated means and reclassifies pixels with respect to the new means. All pixels were classified to the nearest class unless a standard deviation or distance threshold was specified, in which case some pixels might be unclassified if they did not meet the selected criteria. This process continued until the number of pixels in each class changed by less than the selected pixel change threshold or the maximum number of iterations was reached.
Supervised Classification
In supervised classification, image analysis was done by supervising the selection of spectral classes that represented patterns or land cover features that the analyst could recognize. Classifi-cations used were Mahalonobis Distance and Minimum Distance. The Mahalanobis distance classification was a direction-sensitive distance classifier that used statistics for each class. It is similar to the Maximum Likelihood classification but assumes that all class covariance is equal and, therefore, a faster method. All pixels were classi-fied to the closest ROI class unless distance threshold was specified, in which case some pixels might be unclassified if they did not meet the threshold. The minimum distance technique uses the mean vectors of each end member and calculates the Euclidean distance of each pixel to the mean vector for each class. All pixels are classified to the nearest class unless a standard deviation or distance threshold is specified. In which case if some pixels do not meet the selected criteria, they may not be classified (Richards, characteristics. The results of profile similarity were used to regroup inital 11 classes into 6 final classes (11A, etc). Training areas were selected from these final classes to perform mahalanobis and mean distance classification.
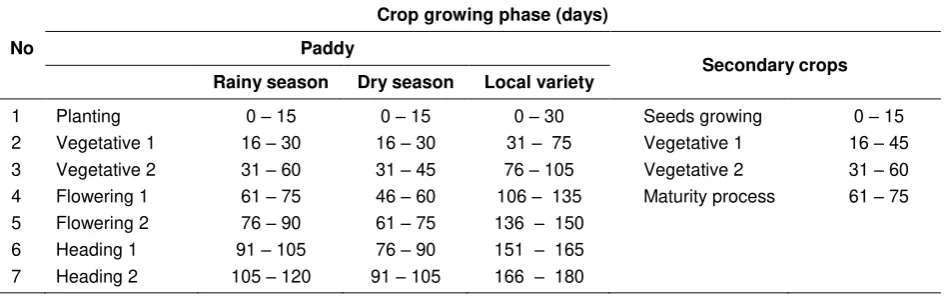
Evaluation of the result of mahaldist dan mindist, as the next analysis, was based on crop calendar and growing stages for classifying the class of cropping pattern. The results of two classification techniques were evaluated using available knowledge associated with crop ca-lendar and crop growing stages for recognizing cropping pattern, i.e., paddy >= 2 times a year, once paddy a year and other secondary crops for dry season, or mixture crops, etc. as presented in Table 2.
The evaluation of both NDVI and Wetness profiles were found useful because paddy growing stages required evaluation on both NDVI and Wetness characteristics through time. The use of NDVI and Wetness profiles was also useful to differentiate paddy from other seasonal crops, such as maize, cassava, soybean, etc. Wetness profile of TCT was used to discriminate paddy from other seasonal crops based on knowledge associated with availability of water on each phase of paddy growing period as harvesting, value of wetness was low. 3. If during planting period values of wetness
are always low, the cropping pattern should be recognized as secondary or other seasonal crop.
Table 2. The paddy and other seasonal crop growing phase period
No
Crop growing phase (days)
Paddy
Secondary crops Rainy season Dry season Local variety
RESULTS AND DISCUSSION
Cropping Pattern Identification
Multi temporal analysis of fourteen Landsat TM data has been applied to identify the pattern of spatial cropping in the study area. The data used were data from year 1988 to 2001, which had incomplete data series that represented every phase of paddy. Identification of cropping pattern to get information of crop calendar requires a complete data series which can identify growing stage of paddy, i.e. flooding, vegetative, flowering, heading, and harvesting in a year. The paddy growing phase period which is presented in Table 1 of methodology was used to identify the NDVI and wetness. The most probable sequence of data series which represented one growing period of paddy were in June, July, August, and September 1997.
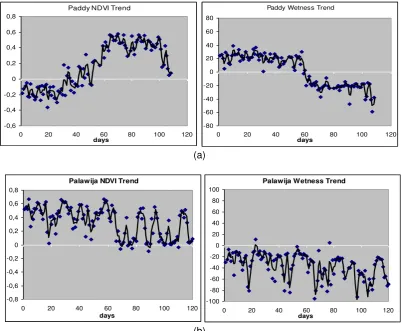
The analysis for identifying crop pattern was used scatter–graphs of NDVI and wetness as shown in Figure 3. The graphic shows that NDVI and wetness pattern of paddy growing period was different with secondary / other seasonal crops. The areas with high NDVI value could be used to recognize vegetated areas, i.e. phase vegetative of paddy, vegetable, secondary crops, or other seasonal crop, while those with low NDVI with high wetness value were recognized as paddy fields during a flooding period. During phase of flooding and vegetative1, the NDVIs had negative value. The NDVIs would increase around 30th day which was phase of vegetative 2 to 70th day, where flowering phase started. NDVIs were constant until 90th or 100th day and decreased during maturity process to harvest. While wetness had high and positive value value in other seasonal crops or secondary crops showed different pattern. The NDVI had no specific pattern as paddy and the wetness values were always low.
Based on scatter-graph presented in Figure 3, the temporal analysis was done to identify the cropping pattern in area of study. The results of NDVI and wetness analysis were derived from Landsat TM year 1988, 1989, 1991, 1994, 1995, 1996, 2001, and 2002 which is each one date, and four dates in 1997 and 2 dates in September. Class 2(11B) had different pattern of NDVI and wetness value(s). The NDVI was low (positive) in June, increased in July, and decreased in August and September. The wetness value slightly decreased as the lowest value. While data of May acquisition is not available, however the area could be interpreted as paddy in flooding phase or secondary crops. Class 3(7) was identified as secondary crops, whose NDVI values were high and slightly decreased and the wetness value was very low. Like class 4(5), class 3(7) was identified as secondary crop of different crop type of class 4(3), which was characterized by lower NDVI values than those of class 4(5). Class 5(1) was bare. They have very low wetness values and low NDVI value during this period.
Two kinds of supervised classification were used in the analysis, i.e. mahalanobis and planted by paddy in that period. The result of both classification methods showed that dates in year 2001 which represented 2 periods of growing phase were in 27 August 2001, class 1(11A) and 3(7) were recognized as vegetative1 phase of paddy and 22 December was flooding phase of paddy. However, class 2(11B) had different pattern. By using mahalonobis classification the pattern showed that the area had the same pattern with both class of 1(11A) and 3(7), other classification method has identified that the area was not planted with paddy. Classes 4(3) and 5(1) were identified as area planted by secondary or other seasonal crops.
class 2(11B), which was better identified by minimum distance supervised classification.
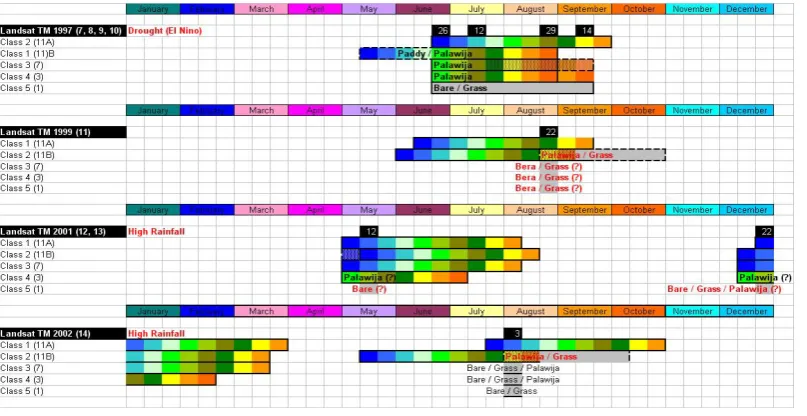
The logical inference analysis based on knowledge of paddy growing stage can produce the crop calendar matrix as shown in Figure 5. The Landsat TM data dated 26-Jun-97, 12-Jul-97, 29-Aug-97, and 14-Sep-97 is ideal for analyzing the crop calendar. However, year 1997 is indicated as severe drought year (El Nino) where the crop calendar is different from the normal years. Data dated 27-Aug-99 and 22-Dec-01 can also be used for analyzing in term of flooding phase in the area. The matrix shows that the area class 1(11A) has been planted with paddy more
than twice for a year or five times for 2 years (2.5 times per year). Class 2(11B) and 3(4) were planted with paddy twice per year, and class 4(3) was planted with paddy once per year, then during first dry season it was planted with a mixture of rice and secondary crop, and during drought season it was planted with secondary crops or other seasonal crops. It is similar to class 5(1). In year 1999 and 2002, only one date of the NDVI and wetness analysis was difficult the pattern crop to be recognized. Classes of pattern could be identify as secondary crops, heading2 phase of paddy, or harvested (Bare land with scattered shrub).
(a)
(b)
Figure 3. NDVI and Wetness trend of paddy (a) and secondary crops (b) growing cycle
Palawija NDVI Trend
-0,8 -0,6 -0,4 -0,2 0 0,2 0,4 0,6 0,8
0 20 40 60 80 100 120
days
Palawija Wetness Trend
-100 -80 -60 -40 -20 0 20 40 60 80 100
0 20 40 60 80 100 120
days
Paddy NDVI Trend
-0,6 -0,4 -0,2 0 0,2 0,4 0,6 0,8
0 20 40 60 80 100 120
days
Paddy Wetness Trend
-80 -60 -40 -20 0 20 40 60 80
0 20 40 60 80 100 120
Class 1(11A) Mahalanobis Distance
Class 2(11B) Mahalanobis Distanc
Class 3(7) Mahalanobis Distance
Class 5(1) Mahalanobis Distance Figure 4. Pattern of each class of paddy fields
Figure 5. Matrix of crop calendar in study area
Paddy Planted Area Classification
The analysis by integrating between pattern recognition of NDVI and Wetness analysis integrated with logical inference based on knowledge of paddy growing stage produced the map of paddy field type distribution (Figure 6). Considering some factors influencing agricultural condition can be prospective to develop the map of paddy field type. The paddy field level was derived from some parameters based on level of influence to agricultural land condition. The consideration of each factor was based on the Upland areas have identified as area planted with mixture crops (paddy and secondary crops). The area planted with paddy once for a year was in northern part of Bekasi area and also spread over area of Karawang and Subang.
Figure 6. Map of paddy field planted distribution
Figure 7. Group of irrigation schedule The results of evaluating transplantation
time on each class in the study area distinguish four specific patterns of crop calendar indicating three different dates of transplantation time. Figure 6 depicts these patterns. The first pattern
indicates that class 1(11A) has phase of land preparation about the middle and end of June in 1997 and 1999, particularly rice-fields in northern coastal of Karawang, Subang, and part of Bandung District (Figure 7).
The second and third pattern indicate transplanting date of around May and December in 2001 in class 1(11A), 2(11B), and 3(7) was in part of northern coastal area of Karawang and Subang and part of Bekasi District. The third
pattern characterizing a transplantation period was around July in 2002 in Class 1(11A).
to NDVI as an indicator of vegetation growing stages of paddy field condition, wetness data can be utilized for enhancing the analysis. The integration of NDVI and wetness can distinguish clearly paddy and secondary crops or other seasonal crops. These analyses accomplished the objective of recognizing the fluctuation of NDVI and wetness in representing each phase of paddy.
Irrigation Water Requirements Estimation Figure 7 shows that paddy fields which were planted with paddy twice a year was mostly located in Northern Irrigation Area, while the others were distributed in non irrigation area. However, the relationship between NDVI-Wetness pattern and both irrigation schedule-group region (Figure 7) were found inconsistent. It can be explained that the area is water discharge accumulation areas of rice fields located in higher elevations. The irrigation region is an area determined by management area like administrative area, so that it can not be determined by spectral data. Another explanation is that the irrigation group schedule data used is for year 2006/2007 (rainy season) and 2007 (dry season), while the image data used were acquisition from year 1988 to 2002. However, the information about growing stage can be used as guide to determine the schedule of irrigation as well as to estimate roughly irrigation demand.
The result demonstrates that a NDVI and wetness curves can be used to detect growing phases of paddy plantation. Once transplantation time is detected, one can roughly
estimate irrigation demand based on the amount of water required to irrigate rice-field during the first phase, second phase, and the last phase.
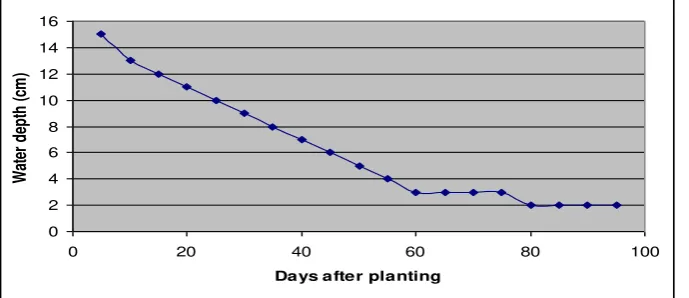
Based on the transplantation dates indicated by the patterns of NDVI, wetness curves, climate zone type, and the typical flooded water depth on rice field (Figure 8), a simple estimation of water demand for rice-fields on each cluster of class can be performed using the following assumption (Kristijono, 1999): 1. The initial depth of water flooding at the date
of transplantation is 15 cm.
2. The depth of water flooding linearly reduces up to 3 cm by the day of 55.
3. This depth continues to linearly decrease for the next 35 days, reaching 2 cm depth. 4. The depth of water is maintained at a level
of 2 cm until the day of harvesting.
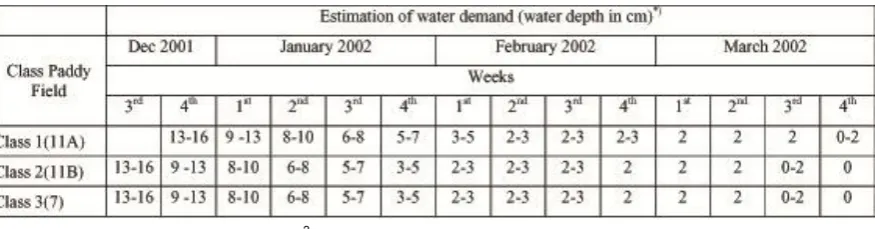
Based on matrix of crop calendar presented in Figure 5, the result such a simple estimation for period December 2001 - March 2002 is presented in Table 3. Note that the demands are expressed in cm depth of flooded water within one growing cycle.
Table 3 shows that based on crop calendar derived from Landsat TM data date 22 December 2001 and typical flooded water depth on paddy field (Figure 8), the irrigation water demand can be estimated roughly. Class 1(11A), which is interpreted as flooding phase of paddy, can be supplied around 13-16 cm of water for irrigation in the 4th week. At the same time, other classes, 2(11B) and 3(7), need only 9-13 cm. The volume of water demand can be estimated from water depth (Table 3) multiplied by area of paddy field.
Table 3. Rough estimation of irrigation water needed in Paddy field period December 2001 to March 2002 (Kristijono, 1999)
Figure 8. Typical flooded water depth on rice field (Kristijono, 1999)
Time series interpretation for some years can determine the pattern of cropping in such area. The cropping pattern can be used to estimate irrigation water needs for paddy field in study area. The estimation can be considered for generating the irrigation group of this area. Ground Checking
Identification of GPS captured during field survey which was held in 29 - 30 June 2007 and 4 – 5 July 2007 by using paddy field class and irrigation group which was clustered into 10 meters. GPS collected was only cover area irrigation group 1st and 2nd.
The GPS data collected was 59 points. Based on Landuse map produced by West Java Local Government, 36 points of GPS collected were identified as non paddy field and 23 points were paddy field. By comparing the 23-GPS-point taken during field checking and cropping pattern analysis derived from satellite data acquisition June 1996 and July 1997, the accuracy is 56.52%.
CONCLUSIONS
The results demonstrate that NDVI & Wetness of Tasseled Cap Transportation (TCT) have potential to identify growing stage period of paddy or secondary crops, and to generate a crop calendar map as well as to recognize the condition of cropping pattern.
Considering that NDVI and wetness are derived from Landsat TM data, which are available in each period of growing stage of paddy, the methodology can be used as a monitoring tool of rice crop growth as well as for estimating irrigation water needs.
ACKNOWLEDGEMENTS
Most sincere appreciation is expressed to the Indonesian Center of Agricultural Land Resources Research and Development (ICALRD), Indonesian Agency of Agricultural Research and Development (IAARD) of Indonesian Ministry of Agriculture for every support, opportunity and permission to conduct this study. The author would also like to extend gratitude to Japan International Research Center for Agricultural Science (JIRCAS) for providing a fellowship for entire stay and fees at Japan, thereby making this study possible, and also providing facilities, data and encouragement for this study.
REFERENCES
Chakraborty, M. , K.R Manjunath, S. Panigrahy, N. Kundu and J.S. Parihar.2005. Rice crop parameter retrieval using multi-temporal, multi-incidence angle Radar-sat SAR data. Space Applications Centre, ISRO. India
0 2 4 6 8 10 12 14 16
0 20 40 60 80 100
Days after planting
W
at
er
de
pt
h
(c
m
Crist, E.P. and R.J. Kauth.1986. The tasseled Cap De-Mystified. Photogrammetric Engineering and Remote Sensing 52(1): 81-86.
Kristijono, A. 1999. Using NOAA/AVHRR imagery for modeling rice crop irrigation demand model, In Hanggono, A and Agus, BS 1999 (eds). Remote sensing and geographic information systems yearbook 98/99. Agency for the Assessment and Application of Technology, Jakarta.
Local Government of West Java Province. 2005. Peta penggunaan lahan Provinsi Jawa Barat skala 1:250,000. Local Govern-ment of West Java Province. Bandung. Miyazato, M., E. Ishiguro, Y. Hidaka, M. Sato, S.
Yoshida, S. and J.Y. Chen. 1993. Esti-mation od the area of paddy field using satellite data: By Multi level slice method and band ratio method. Mem. Fac.Agr. Kagoshima Univ. 29: 113-119. P3TISDA-BPPT. 2002. Laporan akhir perkiraan
dini areal pertanian yang terancam ke-keringan menggunakan teknologi inde-raja. proyek pengembangan sta-tistik dan sistem informasi pertanian- Depar-temen Pertanian.
Richards, J.A. 1999. Remote sensing digital image analysis. Springer-Verlag, Berlin. pp. 240.
Shofiyati, R. 2009. Characterization of paddy rice planting. Proceedings of Workshop on JIRCAS-Indonesia Collaborative
Re-search Project “Enhancement of Remote Sensing and GIS Technology for Sustainable Utilization of Agricultural Resources in Indonesia”. Indonesian Center for Agri-cultural Land Resources Research and Development. Bogor. Toselli, F. 1989. Applications of remote sensing to
agrometeorology. Proceedings of a Course held at the Joint Research Centre of the Commission of the Eu-ropean Communities in the Framework of the ISPRA-Courses, Ispra, Verese. Italy.
Tucker, C.J. 1979. Red and photographic infra-red linear combinations for monitoring vegetation. Remote Sens. Environ. 8: 127-150.
Uchida, S. 2007. Monitoring of paddy rice planting with complex cropping pattern using satellite remote sensing data - a case of West Java, Indonesia. Procee-ding of The 28th Asian Conference on Remote Sensing ACRS 2007. Kuala Lumpur, 12-16 November 2007. Wahyunto, Widagdo and B. Heryanto. 2006.
Pendugaan produktivitas tanaman padi sawah melalui analisis citra satelit. In-formatika pertanian 15: 853-869. Badan Litbang Pertanian, Jakarta.