Design Development of Sprinkler Irrigation System
to Protect The Failed Harvest of C
itrus “
K
eprok 55”
In Dry Season
at Selorejo, Dau, Malang
Bambang Suharto1) and Liliya Dewi Susanawati2)
1,2) Lecturer of Agricultural Engineering Department, Agricultural Technology Faculty, University of Brawijaya, Malang, Indonesia.
E-mail : [email protected]
ABSTRACT
This study is a part of ongoing research to mainstay citrus productivity in Malang region. Therefore, the specific aim of this study is developing the design of sprinkle irrigation in field. Selorejois central location of citrus production called “KEPROK 55” in Dau -Malang. The cultivation requires maintenance of soil and plants, in addition the lower of citrus production especially in dry season thus indispensable an effort to increase the production. Application of technology using sprinkle irrigation is expected to create the increasing of Citrus production. Result on research study show that the coefficient of uniformity tends to have same value on all the treatment that is above 98%, where the average value of the coefficient of uniformity was 98.8%. The highest value of the coefficient of uniformity achieved at combination of treatment P1T1 (pressure of 1 bar with a riser pipe 50 cm height) that is equal to 99.78%. While the coefficient of uniformity was lowest at the combination of treatment P2T3 (pressure of 1.5 bar with a riser pipe 150 cm height) by 96.6%. The pressure effected to the coefficient of uniformity indicates that the greater pressure exerted, then the coefficient of uniformity will be higher. It indicated at the treatment of pressure P1, P2, and P3 (1 bar, 1.5 bar and 2 bar) that have the average coefficient of uniformity of 98.53%, 98.27%, and 99.64%.
Keyword: Citrus, Distribution Uniformity, Pressure, Sprinkle Irrigation.
INTRODUCTION
Design and technology engineering of sprinkle irrigation systemis possible to be adapted by farmer. Therefore, it required reliable design of sprinkle irrigation system. The advantage application of sprinkle irrigation system method can stimulate to the flowering system, beside the system is good forwatering method, it is also very effective to use as a fertilizing method, and effort to eliminate pest and plant disease (Herman, 1991; Merriam, 1991).
rainy season the citrus is capable to produce high quantity because the water in the soil was fulfilled, in other hand, the production was relatively smallin the long drought as result of insufficient water in the soil. In addition, the low production in the dry season is effected to the low quality of a the citrus. Another factor is the low price of a KEPROK 55 Citrus production (Prado et. al., 2007).
In general, the common problem for the farmers of KEPROK 55 Citrus is water, in this case, it depends only on the rainwater that it is not always the same water quantity in every year. Thus, in dry season, the lack of water availability resulted in decreasing of the number and quality of fruits as well as the decline of KEPROK 55 Citrus production drastically up to 40-45%, based on statistical data 2005. In other hand, in dry season, the price of KEPROK 55 Citrus is relatively high that it encourages the farmers of KEPROK 55 Citrus in Batu city to increase the production; however, it came up with the issue of the water availability (Prado et. al., 2007).
To solve those problems and to increase the production of the KEPROK 55 Citrus both in quantity and quality that able to compete in the future free market era, we need to introduce a new innovative technology application system that called sprinkle irrigation system, thus the use of the water can be efficient and effective, and the citrus production becomes stable in the end of the rainy season and dry season. This study is a part of ongoing research to mainstay
region. Therefore, the specific aim of this study is developing the design of sprinkle irrigation in KEPROK 55 citrus field.
RESEARCH METHODS
Design of sprinkle irrigation system was constructed in Laboratory of Natural Resources and Environmental engineering in Agricultural Technology Faculty, Brawijaya University and it was done simultaneously calibration on the respective nozzle. The experiment of precipitation irrigation system was being implemented in field of KEPROK 55 Citrus gardens belonging to farmers in the village of Selorejo, Dau, Malang. This research was carried out in three phases, i. e.: 1) laboratory experiments, 2) experiments with plants indicators using KEPROK 55 Citrus and, 3) evaluation of sprinkle irrigation systems.
The design used in this experiment is Randomized Block Design (RBD) with factorials was used in the research, there were two investigated factors, i.e.: 1) height of riser which consisted of three main levels and a control leve land 2) three different
Figure 1. Design of Sprinkler Irrigation of KEPROK 55 Citrus that will be Applied on the Field.
Picture 1. Sprinkle Irrigation System Installation from the Design Figure (Figure 1) in Laboratory.
Picture 2. Work Test of Sprinkle Irrigation System Installation.
RESULT & DISCUSSION
Analysis of The Soil and Organic Materials.
The results of soil analysis conducted in Soil Department, Agriculture Faculty, Brawijaya University revealed data as follow:
a. The Weight of Content (bi) and The Specific Gravity (bj).
effected by various factors such as: 1) land management, 2) organic substances, 3) soil solidification as result of rain or agricultural equipment tools, 4) texture, and 5) structure and content of water.
b. Porosity.
The porosity or pore space is volume of all pores in soil as whole, and it is showed in percentage. The largest value of porosity was 58.10 %, i.e. at the first point.
c. pF Value.
The pF value range between 0 to 7, in other words, the 0 value is defined for the ground withsaturated water and the value 7 is defined for absolute dry soil heated (105oC). The important of pF values for the growth of plants is from 2.54-4.20 range value. At pF 2 the water is too wet, limited air and the water starts seeping down.
The pF 2.54 or 0.33 atm state to the airy capasity, and pF 4.20 or 15 atm state to critical state, in this case, the root started to not absorb the water and began to wither permanently. The availability of water for plants is on the circumstances between pF 2.54-4.20. The highest pF 2.5 is 0.36 on the second point, and the highest pF 4.2 is 0.22 on the second point.
d. Organic Substance.
The analysis result of organic substance reveals data as follows:
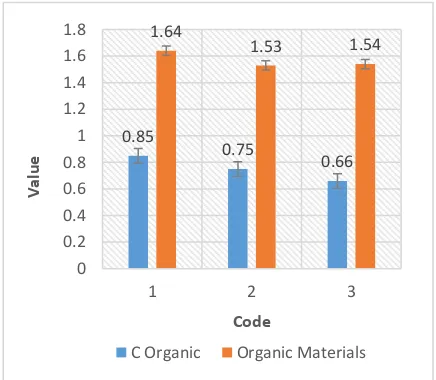
Table 1. Analysis Result of Soil Organic Material Substance of KEPROK 55 Citrus Field. Code COrganic (%) Organic
Source: Result of Test (2014).
Figure 2. Analysis Result of Soil Organic Material Substance of KEPROK 55 Citrus Field. The analysis result of the average organic matter obtained the average percentage score 0.75% for C organic and 1.57% for organic materials. Content of C organic at sample-1 is 0.85%, at sample-2 is 0.75%, and at sample-3 is 0.66%. Content of organic materials at sample-1 is 1.64%, at sample-2 is 1.53%, and at sample-3 is 1.54%.
Laboratory Experiments.
Picture 4. Discharge Volume Testing on.
Table 2. Test Result of Discharge Volume on Sprinkle Irrigation with 1 Bar Pressure in Laboratory
Riser Repetition
Average (L/H) U1(L/H) U2(L/H) U3(L/H) U4(L/H)
T1 100.35 102.00 100.54 100.00 100.72
T2 86.89 87.00 84.53 87.89 86.58
T3 63.53 63.12 62.4 63.23 63.01
Source: Result of Test (2014).
Information: T1=riser 50 cm height, T2=riser 100 cm height, T3=riser 150cm height, U1=1st repetition, U2=2nd repetition, U3 = 3rd repetition, U4 = 4th repetition, L/H = liter per hour.
The highest sprinkler discharge average was obtained 102.00 L/H in combination of pipe U2T1 riser 50 centimeters height, while the lowest was reached 62.4 L/H at combination of treatment U3T3 with riser 150 cm height. Based calculating result on the table of discharge, it concluded that the higher score of riser so it could be the smaller score of the discharge average was.
These are the following discharges were produced atvarious pressure i.e.: 1 bar (P1), 1.5 bar (P2), 2 bar (P3) and riser 50 cm height (T1), 100 cm height (T2) and 150 cm height (T3). The result tested with level of significance (BNT) 5% produced the relation between pressure, height of riser and discharge as shown in Table 3.
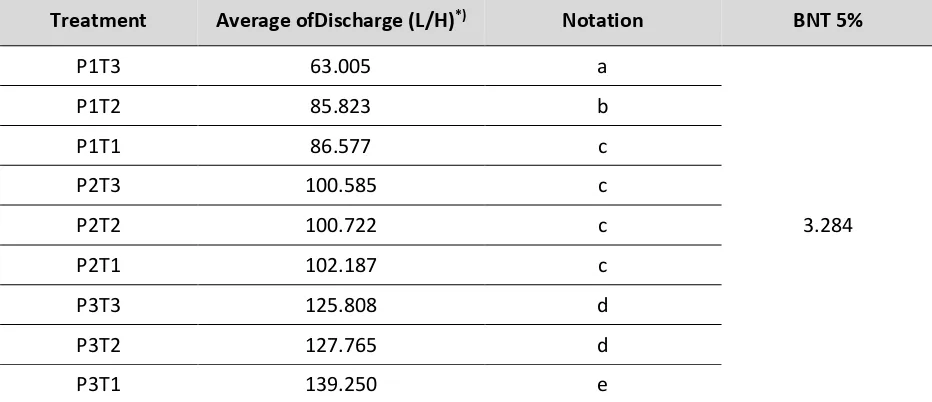
Table 3. Relationship Between Pressure, Height of Riser,and Average of Discharge (L/Hour).
Treatment Average ofDischarge (L/H)*) Notation BNT 5%
P1T3 63.005 a
3.284
P1T2 85.823 b
P1T1 86.577 c
P2T3 100.585 c
P2T2 100.722 c
P2T1 102.187 c
P3T3 125.808 d
P3T2 127.765 d
P3T1 139.250 e
Description: *) The average of discharge accompanied by the same letters have not significant different at 5 % level in real test.
to 1, or there was strong correlation.
Figure 3. The Influence of Treatment and Average of Discharge.
The Coefficient of Uniformity (CU).
The coefficient of uniformity is needed to know the value of various volume produced by the riser. The coefficient of uniformity (CU) above 98% is considered very good. If the coefficient of uniformity is between 95-98%, it is still could be accepted, meanwhile, if the coefficients uniformity is below 95%, the design must be changed, for example by means of shortening the length of pipe with a pipe or enlarge the pipe diameter (Cristiansen and Davis, 1987).
Figure 4. The Influence of Pressure on the Coefficient of Uniformity (%).
The small value of the coefficients of uniformity shows that the precipitation
irrigation system is not quite good, the amount of water is not given same to each plants, therefore, each plants receive water in different amount of water. The value of the coefficients of uniformity is influenced by the average value of discharge output and standart deviation. The less deviation standart value will increase the value of the coefficients of uniformity.
Figure 4 shows that the value coefficient of uniformity treatment tends to the same in all treatments or above 98%, where the value at intermediate the coefficient of uniformity is 98.8%. The highest value of coefficient of uniformity is obtained at treatment combination of P1T1 (1 barof pressure with riserpipe 50 cm height) about 99.78%. The lowest coefficient of uniformity is obtained at the combination treatment P2T3 (1.5 bar of pressure with riser pipe 150 cm height) about 96.6%. The influence of pressure on the coefficient of
P1T3 P1T2 P1T1 P2T3 P2T2 P2T1 P3T3 P3T2 P3T1
coefficients of uniformity average are 98.53%, 98.27%, and 99.65%.
Distribution Uniformity.
Distribution uniformity (DU) is evaluated from comparison average of the lowest quarter value of collected volume and collected average volume. Based on various calculations and analysis, the influence of treatment which pressure (P) and riser pipe height (T) against to the distribution uniformity (DU). In each treatment shows significant difference which influence to interactions among the treatment. The influence of treatment which pressure and riser pipe height against to the distribution uniformity is available as values shown in the Table 4. different at 5% level at the first test.
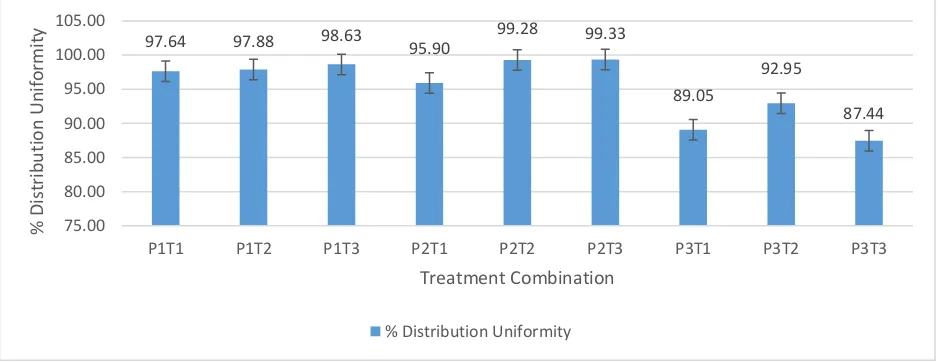
Table 4 showed the relation between pressure and riser height to distribution uniformity. BNT 5% test calculation showed the real difference between P3T1, P3T2 were notationedas a and b, P1T1 and P2T3were notationedas c and d. The large value of distribution uniformity show results that the treatment successfully effected in plants and being equitable distribution. If the water distribution evenly, so the each plant will get the same volume of water. But if the distribution rarely and not to all plants, it can be through in good growth. The percentage of each treatment indicated by
Figure 5. The average results was up to 85% of the distribution uniformity, it shows that water distribution is approximately same with the experiment results of sprinkle irrigation design at the laboratory.
Figure 5. The Influence of Pressure and Riser Pipe Height to Distribution Uniformity (%).
97.64 97.88 98.63 95.90 99.28 99.33
89.05
P1T1 P1T2 P1T3 P2T1 P2T2 P2T3 P3T1 P3T2 P3T3
The conclusion of research include as 98%, in which the value of intermediate a coefficient of uniformity is about 98.8%.
3. The highest value of coefficient of uniformityis about 99.78% at combination treatment of P1T1 (1 bar pressure with riser pipe 50 cm height), while the lowest value of coefficient of uniformity is about 96.6% at combination treatment of P2T3 (1.5 bar pressure with riser pipe 150 cm height). 4. The pressure has influenced to the
coefficient of uniformity and it shows that the greater pressure is given, the higher coefficient of uniformity will be. It shows at the pressure treatment of distribution uniformity on sprinkle irrigation design have showed that the water distributed evenly, it is proved by the calculation result of distribution uniformity with percentage value is up to 85%.
REFFERENCES
Agustí J, Zapater M, Iglesias DJ, Cercós M, Tadeo F. R., Talon M. 2007. Differential Expression of Putative 9-Cis-Epoxycarotenoid Dioxygenases and
Stressed Vegetative and Reproductive Tissues of Citrus. Plant Sci. 172: 85-94. Cristiansen, J. E. and Davis, J. R. 1987.
Irrigation of Agricultural Land.
American Society of Agronomy Publisher. USA.
Ginestar C., Castel J. R. 1996. Responses of Young Clementine Citrus Trees to Water Stress During Different Phenological Periods. J. Hort. Sci. 71: 551-559.
Goldschmidt E. E., Golomb A. 1982. The Carbohydrate Balance of Alternate-Bearing Citrus Trees and The Significance of Reserves for Flowering and Fruiting. Journal of the American Society for Horticultural Science 107, 206-208.
Hansen V. E., Israelsen O. W. dan Stringham G. E. 1980. Irrigation Principles and Practices. Terjemahan Erlangga. Jakarta. Acad press. New York and London. Kaufmann M. R. 1972. Water Deficits and
Load Status and With and Without Irrigation. Bragantia (In Portuguese) 66, 173–182.
Ribeiro R. V., Machado E. C., Santos M. G., Oliveira R. F. 2009. Photosynthesis and Water Relations of Well-Watered Orange Plants as Affected by Winter
and Summer Conditions. Photosynthetica 47, 215–222.