Comparison of the 80-Lead Body Surface
Map to Physician and to 12-Lead
Electrocardiogram in Detection of Acute
Myocardial Infarction
Anthony J.J. McClelland,
MB, Colum G. Owens,
MB, Ian B.A. Menown,
MD,
Mark Lown,
PhD, and A.A. Jennifer Adgey,
MDDiagnosis of non–ST-elevation acute myocardial infarc-tion (AMI) by a 12-lead electrocardiogram has poor sensitivity and specificity and, therefore, relies on bio-chemical markers of myocardial necrosis, which can only be reliably detected within 14 to 16 hours from symptom onset. The body surface map (BSM) improves AMI detection but is limited by its interpretation by inexperienced medical staff. To facilitate interpretation, an automated BSM algorithm was developed and is evaluated in this study. One hundred three patients with ischemic-type chest pain were recruited for this study from December 2001 to April 2002. A 12-lead electro-cardiogram (Marquette Mac 5K) and BSM (PRIME-ECG) were recorded at initial presentation, and cardiac tro-ponin I and/or creatine kinase-MB levels measured at 12 hours after symptom onset. The admitting physician’s lead electrocardiographic (ECG) interpretation, 12-lead ECG algorithm (Marquette 12 SL V233) diagnosis,
and BSM algorithm diagnosis were documented for each patient. AMI, defined by elevation of troponin I to >1 g/L and/or creatine kinase-MB to >25U/L, oc-curred in 53 patients. The admitting physician diag-nosed 24 patients with AMI (sensitivity 45%, specificity 94%), the 12-lead ECG algorithm diagnosed 17 patients with AMI (sensitivity 32%, specificity 98%), and the BSM algorithm diagnosed 34 patients with AMI (sensitivity 64%, specificity 94%). The BSM algorithm improved the diagnostic sensitivity by 2.0 (p <0.001) and 1.4 (p ⴝ 0.002) compared with the 12-lead ECG algorithm or the admitting physician, respectively. There was no significant difference in specificity. Thus, the BSM algorithm improves detection of AMI compared with the 12-lead ECG algo-rithm or physician’s 12-lead ECG interpretation. 䊚2003 by Excerpta Medica, Inc.
(Am J Cardiol 2003;92:252–257)
T
his study assesses whether an automated body surface map (BSM) algorithm could improve de-tection of acute myocardial infarction (AMI) com-pared with (1) an automated 12-lead electrocardio-graphic (ECG) analysis program (12SL V233; GE Medical Systems, Waukesha, Wisconsin), and (2) a physician’s 12-lead ECG interpretation.METHODS
Patients:Patients were recruited consecutively over a 3-month period (24 hours a day) as they presented to the cardiology department via the emergency depart-ment or the mobile coronary care unit. Patients pre-senting with ischemic-type chest pain of ⬍12 hours duration, regardless of the presence or absence of
ST-segment alteration on the 12-lead electrocardio-gram, were included. All patients gave informed con-sent. Patients who had received treatment (fibrinolyt-ics, glycoprotein IIb/IIIa receptor antagonists, or ni-trates) before the 12-lead electrocardiogram or BSM recording were excluded.
The following were noted for each patient: (1) admitting physician’s diagnosis (ST-elevation AMI or not—as entered at presentation); (2) the 12-lead algo-rithm (12SL V233 program) diagnosis (AMI or not AMI); and (3) the BSM algorithm diagnosis. AMI was defined by the presence of acute chest pain for ⬎20 minutes and elevation of cardiac troponin I to ⬎1
g/L and/or creatine kinase-MB to⬎25 U/L. Twelve-lead electrocardiogram:Trained ECG tech-nicians using a Marquette Mac 5K (GE Medical Sys-tems) performed the 12-lead ECG recording. These were programmed to automatically display a diagnosis based on the 12 SL V233 program.
Body surface map: The BSM system used in this study has been previously described.1,2Briefly, the
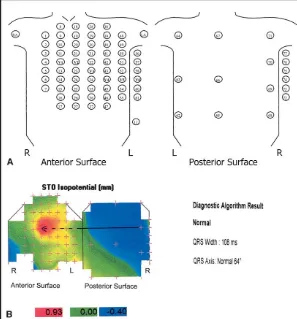
sys-tem is a portable recording unit made of flexible plastic anterior and posterior electrode harnesses that are ana-tomically referenced. The anterior harness contains 64 electrodes (including 3 proximal limb leads), and the posterior harness has 16 electrodes, enabling recording of 80 unipolar ECG signals with respect tothe Wilson central terminal (Figure 1). Harness application takes 2 From the Regional Medical Cardiology Centre, Royal Victoria
Hospi-tal; The Queen’s University; and Meridian Medical Technologies, Belfast, Northern Ireland. Drs. McClelland and Owens were funded by research fellowships from the Research and Development Office of the Northern Ireland Health and Social Services Agency, Belfast, Northern Ireland, and the Frances and Augustus Newman Foundation, Bristol, England. Manuscript received March 18, 2003; revised manuscript received and accepted April 17, 2003.
to 3 minutes. During the interpretation process the elec-trodes are defined to represent anterior, inferior, right, and posterior epicardial regions depending on their ori-entation.2 After recording, all 80 leads were manually
checked and those of unacceptable quality were substi-tuted using a linear grid interpolation. Maps with ⬎6 “bad leads” were disregarded to avoid inappropriate re-liance on interpolated data. QRS onset, QRS offset, and T-wave offset “beat markers” were marked by a single technician, enabling the following BSM variables to be calculated automatically by the custom software: (1) QRS width and axis; (2) QRS and ST-T isointegrals—an integration (i.e., area) of the ECG signal under the QRS and ST-T curves, respectively, at each electrode site; and (3) ST0 and ST60 isopotentials—the potential at each electrode site at 0 and 60 ms after the J point.
The BSM algorithm automatically displayed its diagnosis based on these variables (Figure 1). Tech-nicians can be trained in 1 to 2 days in harness application and BSM processing.
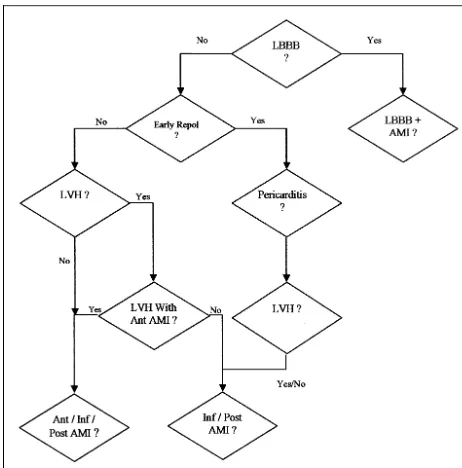
Algorithm:The aim of algorithm development was to mirror the diagnostic approach of a cardiologist by using established 12-lead ECG rules3 that were
ex-tended to account for additional spa-tial ECG data. These ECG rules were tested on a large database of BSMs during algorithm development. The algorithm thus follows a stepwise de-cision-tree approach as shown in Figure 2.
Definitions of ECG features: LEFT
BUNDLE BRANCH BLOCK (LBBB):LBBB
was detected by presence of deep,
wide QS complexes (⬎15 mm,
⬎110 ms) in any anteroseptal leads in addition to an RSR pattern (depth of S wave from the peak of the low-est R wave ⬎2 mm) in the lateral leads.
LEFT BUNDLE BRANCH BLOCK WITH
ACUTE MYOCARDIAL INFARCTION: If
LBBB was present, AMI was also di-agnosed with the following criteria: LBBB with inferior AMI:⬎1 mm ST elevation inⱖ3 inferior leads in addi-tion to ⬎1 mm reciprocal depression inⱖ3 high anterior leads;LBBB with right ventricular AMI:⬎1 mm ST el-evation detected in the right ventricular leads in addition to⬎1 mm ST depres-sion in the lateral leads; LBBB with anterior AMI: in LBBB without AMI, the ratio of the QRS magnitude to the ST-segment magnitude in leads V1 and V2 is always greater than unity,
and is commonly about 2:1. During AMI, this ratio decreases toward unity. LBBB with anterior AMI was there-fore diagnosed if the QRS:S-T ratio was below 1.1:1 in the anterior leads; andLBBB with posterior AMI:⬎0.75 mm ST elevation in the posterior leads in addition to⬎1 mm anterior ST depression.
EARLY REPOLARIZATION (NORMAL VARIANT): Early
repolarization was diagnosed by⬎1 mm ST elevation, determined as concave by slope analysis (between J point and T-wave peak), in ⱖ2 anterolateral leads if all of the following features were absent: significant (⬎1 mm) anterior ST depression; pathologic Q waves (⬎2 mm) in the left precordial leads; hyperacute T waves in the anterolateral leads (large amplitude T waves with ST-slope elevation); large ST:T ratio (⬎0.5) anteriorly (may suggest AMI); anterior T-wave inversion ⬎2 mm (in early repolarization, precordial lead T waves are frequently taller than normal); and S waves ⬍7.5 mm in the anteroseptal leads and R waves ⬍6 mm in the lateral leads (early repolarization is associated with increased QRS amplitude).
ACUTE PERICARDITIS: Criteria for early repolariza-tion included of all the following: ST elevarepolariza-tion in⬎6 anterior/lateral/inferior leads,⬎0.5 mm ST depression in lead aVR, and the mean ST elevation in the lateral leads was greater than the mean ST elevation in the septal leads.
FIGURE 1.(A)Location of the 80 electrode positions on the anterior and posterior BSM harnesses. Electrodes equivalent to the precordial leads of the 12-lead electro-cardiogram are marked V1toV6.(B)Normal ST0 isopotential map with algorithm
di-agnosis. Thearrowjoins the ST0 minima(blue area)with the ST0 maxima(red area). The maxima (0.93 mm) is in the anteroseptal area and minima (ⴚ0.40 mm) is in the
Left ventricular hypertrophy:Left ventricular hyper-trophy was indicated by anterior S waves ⬎15 mm, lateral R waves⬎14 mm, and ST-T integral value less than⫺5 mVms, and if the sum of the biggest R waves in the lateral leads and the deepest S waves in the anteroseptal leads was ⬎35 mm.
LEFT VENTRICULAR HYPERTROPHY WITH ANTERIOR AMI:Anteroseptal ST-segment elevation and lateral ST depression can occur with left ventricular hypertro-phy. To diagnose anterior AMI, the algorithm searches for the presence of classic AMI features: pathologic Q waves (⬎2 mm) in the left precordial leads, hyperacute T waves in the anterolateral leads, and anteroseptal T-wave inversion of⬎2 mm.
INFERIOR AMI:Inferior AMI was diagnosed if there was ⬎1 mm ST elevation in ⱖ2 inferior leads in addition to⬎1 mm ST depression inⱖ2 high anterior leads. The elevation threshold reduces to 0.75 mm if any of the following conditions are detected: ⬎1.5 mm high anterior ST depression, pathologic Q waves in the inferior leads, or hyperacute T waves detected in inferior leads (T-wave magnitude greater than the magnitude of the QRS complex).
ANTERIOR AMI:The algorithm diagnoses an anterior AMI ifⱖ2 mm ST elevation is detected inⱖ2 anterior leads. Reduced ST elevation threshold is used in each of the following conditions: reciprocal depression de-tected in lead III (1.75 mm), pathologic Q waves
detected in anterior leads (1.25 mm), and hyperacute T waves detected in anterior leads (1.25 mm).
POSTERIOR AMI:Posterior AMI is diagnosed if
ST-elevation is detected in the posterior leads in addition to reciprocal anterior depression. Posterior ST-eleva-tion thresholds range from 0.5 to 1 mm. The smaller thresholds are employed when there are inverted T waves in the anterior leads or upright T waves in the right ventricular or posterior leads.
Statistical analysis: Baseline categoric variables were analyzed by chi-square and continuous clinical variables by analysis of variance. McNemar’s test was used to compare the BSM algorithm prediction of AMI with that of the 12 SL V233 program and the physician’s 12-lead ECG interpretation. Statistical analysis was performed using SPSS version 10.0 (SPSS Inc, Chicago, Illinois). A p value ⬍0.05 was considered statistically significant.
The study was approved by the Queen’s University of Belfast Research Ethics Committee. All patients gave informed consent.
RESULTS
Of the 103 patients included in the study, 53 had AMI confirmed by elevated troponin I and/or creatine kinase-MB levels. Baseline characteristics of the AMI and non-AMI groups are compared in Table 1. Pa-tients with AMI tended to have a history of hyperten-sion and previous coronary artery disease and hyper-cholesterolemia (p ⬍0.05). Table 2 compares the di-agnoses of the physician, the 12-lead ECG algorithm, and the BSM algorithm.
Twelve-lead electrocardiographic analysis: The Marquette 12 SL V233 ECG analysis program cor-rectly diagnosed 17 patients with AMI (sensitivity 32%, specificity 98%).
Physician analysis: The admitting physician cor-rectly diagnosed 24 patients with AMI (sensitivity 45%, specificity 94%). Of the 24 patients correctly diagnosed, 20 received thrombolytic therapy. Of those who did not receive thrombolytic therapy, 2 had re-cent history of stroke, 1 had history of hematemesis secondary to peptic ulcer disease, and 1 had late presentation (chest pain ⬎12 hrs).
Body surface map:The BSM algorithm diagnosed 34 patients with AMI (sensitivity 64%, specificity 94%). All patients diagnosed by the 12-lead ECG algorithm or physician were diagnosed by the BSM algorithm. Compared with the 12-lead ECG analysis program and the physician’s ECG interpretation, the diagnostic sensitivity was improved by 2.0% (p
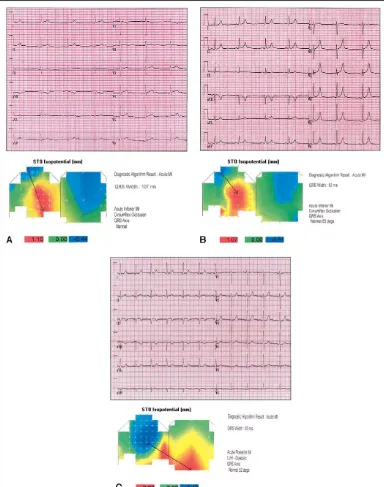
⬍0.001) and 1.4% (p ⫽ 0.002), respectively. There was no significant difference in specificity. Of the 17 patients diagnosed with AMI by the BSM and missed by the 12-lead algorithm, 3 had anterior AMIs, 7 had inferior AMIs, and 7 had posterior AMIs (troponin I range 1.39 to 134g/L, mean 29.8). Of the 10 patients diagnosed with AMI by the BSM and missed by the physician, 4 had inferior AMIs and 6 had posterior AMIs (troponin I range 2.24 to 26 g/L, mean 11.4). Figure 3 shows examples of AMIs correctly diagnosed
by the BSM algorithm but missed by 12-lead ECG algorithm and/or the physician.
DISCUSSION
This study showed that the BSM diagnostic algo-rithm detected AMI with higher sensitivity than a 12-lead ECG diagnostic algorithm or a physician, without significant loss of specificity. This is in ac-cordance with previous studies of BSM in AMI.1,4,5
Our study has several strengths. The patients were recruited consecutively as they presented and maps were performed early in the acute phase. The baseline characteristics are thus typical of a population present-ing with ischemic chest pain to a cardiology depart-ment. All patients were assessed by a junior doctor before admission. The high incidence of coronary heart disease in Northern Ireland explains the high rate of AMI in this cohort of patients. Maps and electro-cardiograms were recorded within 15 minutes of each other. In addition, patients who received treatment before mapping or electrocardiography were ex-cluded, ensuring the data included in the study repre-sented acute events.
The improved performance of BSM for AMI detection was due to ECG sampling outside the conventional precordial area. BSM has previously been demonstrated to increase AMI detection in patients with ST depression only on a 12-lead elec-trocardiogram1and to improve classification of
in-ferior AMI with posterior or right ventricular wall involvement.6 It is not unexpected, therefore, that
we found improvement in AMI de-tection occurring mostly in patients with posterior wall or inferior AMI (Table 2). Myocardial perfusion studies have shown that in patients with defects limited to lateral and posterior walls, the electrocardio-gram is often nondiagnostic and that circumflex occlusion is often present.7,8
Previous studies have relied on staff experienced in BSM interpre-tation and used complex QRST variables to demonstrate BSM’s su-periority. In our study, a newly developed algorithm was used for map interpretation. The BSM algo-rithm mirrors the diagnostic approach of a cardiol-ogist by using 12-lead ECG rules that are extended to account for the additional spatial ECG data. This logical diagnostic approach is transparent and easy to understand, unlike a “black box” artificial neural network or regression algorithm. The BSM algo-rithm also provides greater improvement in AMI detection compared with previous studies of ECG interpretation programs, including those incorporat-ing neural networks.9 –12 Heden et al12 improved
automated 12-lead ECG interpretation of AMI by just 15.5% with an artificial neural network, com-pared with the 32% improvement (BSM algorithm vs Marquette 12SL V233) seen in this study.
Although the improved sensitivity of our BSM algorithm was encouraging, analysis and statistical comparisons were limited by the modest overall num-ber of patients. Larger patient numnum-bers may enable a more robust test of the algorithm and identify areas where changes in classifier variables may lead to improved specificity and/or sensitivity. A troponin I threshold of 1g/L was selected to ensure detection of myocardial necrosis. This also allowed a more “at risk” population to be identified.13
We have demonstrated the feasibility of BSM as a rapid, noninvasive tool to obtain a full spatial ECG evaluation of patients presenting with acute chest pain and to improve the early diagnosis of AMI.
TABLE 1 Baseline Characteristics of Patients With and Without Acute Myocardial Infarction (AMI)
All Patients
Family history of coronary heart disease 53 (52%) 29 (55%) 23 (46%) 0.6 Active smokers 50 (49%) 27 (51%) 23 (46%) 0.7 Diabetes mellitus 18 (18%) 10 (19%) 8 (16%) 0.8 Total cholesterol⬎200 mg/dl 57 (55%) 35 (66%) 22 (44%) 0.03 Hypertension 41 (40%) 27 (51%) 14 (28%) 0.026 Previous coronary heart disease* 42 (41%) 28 (53%) 14 (28%) 0.016
*Previous AMI and/or angina pectoris.
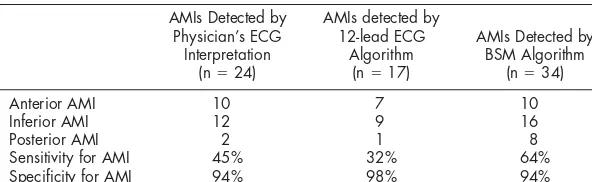
TABLE 2 Comparison of Physician’s 12-lead ECG Interpretation With 12-lead ECG Algorithm and BSM Algorithm for Detection of AMI (n⫽103, AMI⫽53)
AMIs Detected by
Anterior AMI 10 7 10
Inferior AMI 12 9 16
Posterior AMI 2 1 8
Acknowledgment:The investigators wish to thank Staff Nurse Bernie Smyth, SRN, and George Elliot, BSc, for their assistance.
1.Menown IBA, Allen J, Anderson J, Adgey AAJ. ST depression only on the initial 12-lead electrocardiogram: early diagnosis of acute myocardial infarction.
Eur Heart J2001;22:218 –227.
2.Riddell JW, Smith BA, Menown IBA, Maynard SJ, Manoharan G, Allen J, McMechan SR, Cullen CM, Anderson JMcC, Adgey AAJ. Body Surface Mapping in Ischemic Heart Disease. Belfast: W and G Baird Publications, 2001:4 –11.
3.Schamroth L. The 12 Lead Electrocardiogram. London, UK: Blackwell Sci-entific Publications, 1989:33– 41;56 – 60;97–104;145–183;193–201;293–296.
4.Menown IBA, Patterson RSHW, MacKenzie G, Adgey AAJ. Body surface map models for early diagnosis of acute myocardial infarction.J Electrocardiol
1998;31(suppl):180 –188.
5.McMechan SR, MacKenzie G, Allen J, Wright GT, Dempsey GJ, Crawley M,
FIGURE 3. Examples of BSMs and 12-lead electrocardiograms from patients with AMI confirmed by elevated troponin I or creatine kinase-MB.(A)Patient with inferior AMI diagnosed by BSM algorithm and physician but missed by the 12-lead ECG algorithm (maxi-maⴝ1.10 mm, in inferolateral area).(B)Patient with inferior AMI diagnosed by BSM algorithm but missed by physician and
12-lead ECG algorithm (maximaⴝ1.07mm, in inferolateral area).(C)Patient with posterior AMI diagnosed by BSM algorithm but
missed by physician and 12-lead ECG algorithm (maximaⴝ0.87mm in posterior area) (arrows,from area of maximal ST depression
Anderson J, Adgey AAJ. Body Surface ECG potential maps in acute myocardial infarction.J Electrocardiol1995;28(suppl):184 –190.
6.Menown IBA, Allen J, Anderson J McC, Adgey AAJ. Early diagnosis of right ventricular or posterior infarction associated with inferior wall left ventricular acute myocardial infarction.Am J Cardiol2000;85:934 –938.
7.Movahed A, Becker LC. Electrocardiographic changes of acute lateral wall myocardial infarction: a reappraisal based on scintigraphic localization of the infarct.J Am Coll Cardiol1984;4:660 –666.
8.Christian TF, Clements IP, Gibbons RJ. Non-invasive identification of myocar-dium at risk in patients with acute myocardial infarction and non-diagnostic electro-cardiograms with technetium-99-m sestamibi.Circulation1991;83:1615–1620.
9.Elko PP, Weaver WD, Kudenchuk P, Rowlandson I. The dilemma of sensi-tivity versus specificity in computer interpreted acute myocardial infarction.J Electrocardiol1992;24(suppl):2–7.
10.Rowlandson I, Kudenchuk P, Elko PP. Computerized recognition of acute infarction. Criteria advances and test results.J Electrocardiol1990;23(suppl): 1–5.
11.Willems JL, Abreu-Lima C, Arnaud P, van Bemmel JH, Brohet C, Degani R, Denis B, Gehring J, Graham I, van Herpen G, et al. The diagnostic performance of computer programs for the interpretation of electrocardiograms.N Engl J Med
1991;325:1767–1773.
12.Heden B, Ohlin H, Rittner R, Edenbrandt L. Acute myocardial infarction detected in the 12-lead ECG by artificial neural networks.Circulation1997;96: 1798 –1802.