Going Pro in Data Science
What It Takes to Succeed as a Professional Data ScientistGoing Pro in Data Science
by Jerry Overton
Copyright © 2016 O’Reilly Media, Inc. All rights reserved. Printed in the United States of America.
Published by O’Reilly Media, Inc., 1005 Gravenstein Highway North, Sebastopol, CA 95472. O’Reilly books may be purchased for educational, business, or sales promotional use. Online editions are also available for most titles (http://safaribooksonline.com). For more information, contact our corporate/institutional sales department: 800-998-9938 or [email protected].
Editor: Shannon Cutt
The O’Reilly logo is a registered trademark of O’Reilly Media, Inc. Going Pro in Data Science, the cover image, and related trade dress are trademarks of O’Reilly Media, Inc.
While the publisher and the author have used good faith efforts to ensure that the information and instructions contained in this work are accurate, the publisher and the author disclaim all
responsibility for errors or omissions, including without limitation responsibility for damages
resulting from the use of or reliance on this work. Use of the information and instructions contained in this work is at your own risk. If any code samples or other technology this work contains or describes is subject to open source licenses or the intellectual property rights of others, it is your responsibility to ensure that your use thereof complies with such licenses and/or rights.
Chapter 1. Introduction
Finding Signals in the Noise
Popular data science publications tend to creep me out. I’ll read case studies where I’m led by
deduction from the data collected to a very cool insight. Each step is fully justified, the interpretation is clear—and yet the whole thing feels weird. My problem with these stories is that everything you need to know is known, or at least present in some form. The challenge is finding the analytical approach that will get you safely to a prediction. This works when all transactions happen digitally, like ecommerce, or when the world is simple enough to fully quantify, like some sports. But the world I know is a lot different. In my world, I spend a lot of time dealing with real people and the problems they are trying to solve. Missing information is common. The things I really want to know are outside my observable universe and, many times, the best I can hope for are weak signals.
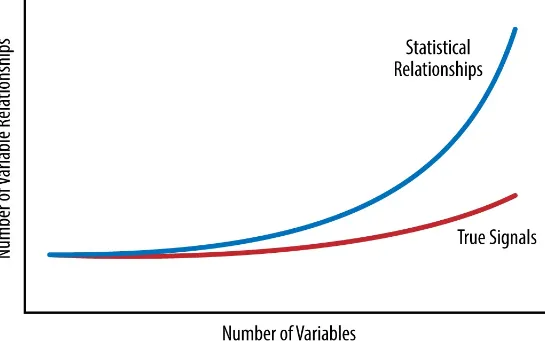
Figure 1-1. As data gets bigger, noise grows faster than signal
Finding signals buried in the noise is tough, and not every data science technique is useful for finding the types of insights I need to discover. But there is a subset of practices that I’ve found fantastically useful. I call them “data science that works.” It’s the set of data science practices that I’ve found to be consistently useful in extracting simple heuristics for making good decisions in a messy and
complicated world. Getting to a data science that works is a difficult process of trial and error. But essentially it comes down to two factors:
First, it’s important to value the right set of data science skills.
Second, it’s critical to find practical methods of induction where I can infer general principles from observations and then reason about the credibility of those principles.
Data Science that Works
Induction is the go-to method of reasoning when you don’t have all the information. It takes you from observations to hypotheses to the credibility of each hypothesis. You start with a question and collect data you think can give answers. Take a guess at a hypothesis and use it to build a model that explains the data. Evaluate the credibility of the hypothesis based on how well the model explains the data observed so far. Ultimately the goal is to arrive at insights we can rely on to make high-quality decisions in the real world. The biggest challenge in judging a hypothesis is figuring out what available evidence is useful for the task. In practice, finding useful evidence and interpreting its significance is the key skill of the practicing data scientist—even more so than mastering the details of a machine learning algorithm.
The goal of this book is to communicate what I’ve learned, so far, about data science that works: 1. Start with a question.
2. Guess at a pattern.
3. Gather observations and use them to generate a hypothesis. 4. Use real-world evidence to judge the hypothesis.
5. Collaborate early and often with customers and subject matter experts along the way.
Chapter 2. How to Get a Competitive
Advantage Using Data Science
The Standard Story Line for Getting Value from Data
Science
Data science already plays a significant role in specialized areas. Being able to predict machine failure is a big deal in transportation and manufacturing. Predicting user engagement is huge in advertising. And properly classifying potential voters can mean the difference between winning and losing an election.
But the thing that excites me most is the promise that, in general, data science can give a competitive advantage to almost any business that is able to secure the right data and the right talent. I believe that data science can live up to this promise, but only if we can fix some common misconceptions about its value.
For instance, here’s the standard story line when it comes to data science: data-driven companies outperform their peers—just look at Google, Netflix, and Amazon. You need high-quality data with the right velocity, variety, and volume, the story goes, as well as skilled data scientists who can find hidden patterns and tell compelling stories about what those patterns really mean. The resulting insights will drive businesses to optimal performance and greater competitive advantage. Right? Well…not quite.
The standard story line sounds really good. But a few problems occur when you try to put it into practice.
The first problem, I think, is that the story makes the wrong assumption about what to look for in a data scientist. If you do a web search on the skills required to be a data scientist (seriously, try it), you’ll find a heavy focus on algorithms. It seems that we tend to assume that data science is mostly about creating and running advanced analytics algorithms.
I think the second problem is that the story ignores the subtle, yet very persistent tendency of human beings to reject things we don’t like. Often we assume that getting someone to accept an insight from a pattern found in the data is a matter of telling a good story. It’s the “last mile” assumption. Many times what happens instead is that the requester questions the assumptions, the data, the methods, or the interpretation. You end up chasing follow-up research tasks until you either tell your requesters what they already believed or just give up and find a new project.
The first step in building a competitive advantage through data science is having a good definition of what a data scientist really is. I believe that data scientists are, foremost, scientists. They use the scientific method. They guess at hypotheses. They gather evidence. They draw conclusions. Like all other scientists, their job is to create and test hypotheses. Instead of specializing in a particular
domain of the world, such as living organisms or volcanoes, data scientists specialize in the study of data. This means that, ultimately, data scientists must have a falsifiable hypothesis to do their job. Which puts them on a much different trajectory than what is described in the standard story line. If you want to build a competitive advantage through data science, you need a falsifiable hypothesis about what will create that advantage. Guess at the hypothesis, then turn the data scientist loose on trying to confirm or refute it. There are countless specific hypotheses you can explore, but they will all have the same general form:
It’s more effective to do X than to do Y
For example:
Our company will sell more widgets if we increase delivery capabilities in Asia Pacific. The sales force will increase their overall sales if we introduce mandatory training. We will increase customer satisfaction if we hire more user-experience designers.
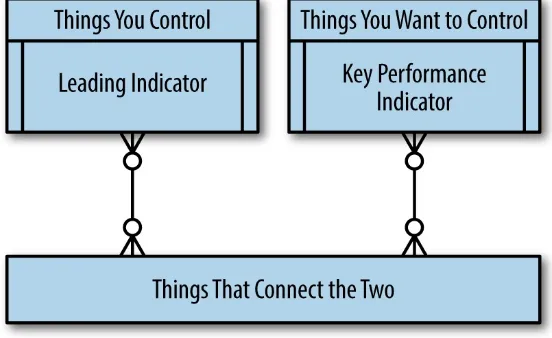
Figure 2-1. The data you need to build a competitive advantage using data science
Let’s take, for example, our hypothesis that hiring more user-experience designers will increase customer satisfaction. We already control whom we hire. We want greater control over customer satisfaction—the key performance indicator. We assume that the number of user experience designers is a leading indicator of customer satisfaction. User experience design is a skill of our employees, employees work on client projects, and their performance influences customer satisfaction.
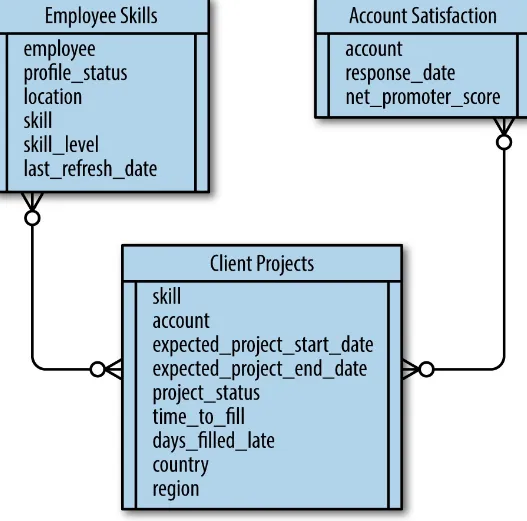
Once you’ve assembled the data you need (Figure 2-2), let your data scientists go nuts. Run
Figure 2-2. An example of the data you need to explore the hypothesis that hiring more user experience designers will improve customer satisfaction
The Importance of the Scientific Method
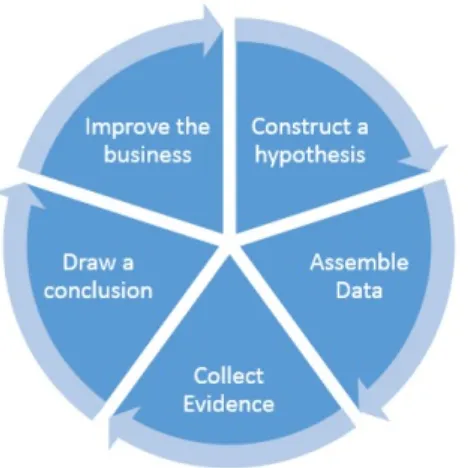
Notice, now, that we’ve pushed well past the “last mile.” At this point, progress is not a matter of telling a compelling story and convincing someone of a particular worldview. Progress is a matter of choosing whether or not the evidence is strong enough to justify taking action. The whole process is simply a business adaptation of the scientific method (Figure 2-3).
This brand of data science may not be as exciting as the idea of taking unexplored data and
steady and depends entirely on the hypotheses you choose to investigate.
Figure 2-3. The process of accumulating competitive advantages using data science; it’s a simple adaptation of the scientific method
Which brings us to the main point: there are many factors that contribute to the success of a data
science team. But achieving a competitive advantage from the work of your data scientists depends on the quality and format of the questions you ask.
HOW TO PARTNER WITH THE C-SUITE
If you are an executive, people are constantly trying to impress you. No one wants to be the tattletale with lots of problems, they want to be the hero with lots of solutions. For us mere mortals, finding people who will list the ways we’re screwing up is no problem. For an executive, that source of information is a rare and valuable thing.
Most executives follow a straightforward process for making decisions: define success, gather options, make a call. For most, spending a few hours on the Web researching options or meeting with subject-matter experts is no problem. But for an executive, spending that kind of time is an extravagance they can’t afford.
Chapter 3. What to Look for in a Data
Scientist
A Realistic Skill Set
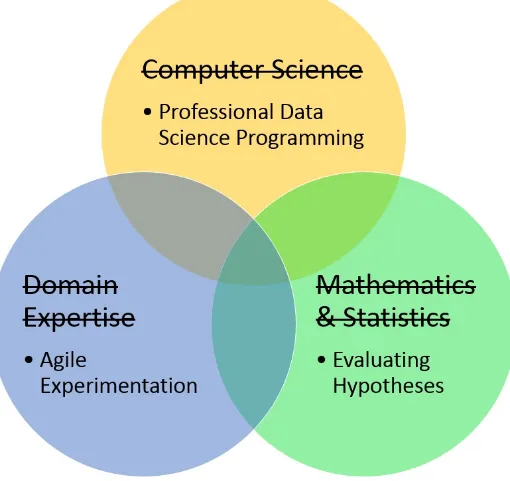
What’s commonly expected from a data scientist is a combination of subject matter expertise, mathematics, and computer science. This is a tall order and it makes sense that there would be a shortage of people who fit the description. The more knowledge you have, the better. However, I’ve found that the skill set you need to be effective, in practice, tends to be more specific and much more attainable (Figure 3-1). This approach changes both what you look for from data science and what you look for in a data scientist.
Figure 3-1. A more pragmatic view of the required data science skills
Realistic Expectations
In practice, data scientists usually start with a question, and then collect data they think could provide insight. A data scientist has to be able to take a guess at a hypothesis and use it to explain the data. For example, I collaborated with HR in an effort to find the factors that contributed best to employee satisfaction at our company (I describe this in more detail in Chapter 4). After a few short sessions with the SMEs, it was clear that you could probably spot an unhappy employee with just a handful of simple warning signs—which made decision trees (or association rules) a natural choice. We
selected a decision-tree algorithm and used it to produce a tree and error estimates based on employee survey responses.
judging a hypothesis is figuring out what available evidence would be useful for that task.
THE MOST IMPORTANT QUALITY OF A DATA SCIENTIST
I believe that the most important quality to look for in a data scientist is the ability to find useful evidence and interpret its significance.
In data science today, we spend way too much time celebrating the details of machine learning algorithms. A machine learning algorithm is to a data scientist what a compound microscope is to a biologist. The microscope is a source of evidence. The biologist should understand that evidence and how it was produced, but we should expect our biologists to make contributions well beyond custom grinding lenses or calculating refraction indices.
A data scientist needs to be able to understand an algorithm. But confusion about what that means causes would-be great data scientists to shy away from the field, and practicing data scientists to focus on the wrong thing. Interestingly, in this matter we can borrow a lesson from the Turing Test. The Turing Test gives us a way to recognize when a machine is intelligent—talk to the machine. If you can’t tell if it’s a machine or a person, then the machine is intelligent. We can do the same thing in data science. If you can converse intelligently about the results of an algorithm, then you probably understand it. In general, here’s what it looks like:
Q: Why are the results of the algorithm X and not Y?
A: The algorithm operates on principle A. Because the circumstances are B, the algorithm produces X. We would have to change things to C to get result Y.
Here’s a more specific example:
Q: Why does your adjacency matrix show a relationship of 1 (instead of 3) between the term “cat” and the term “hat”?
A: The algorithm defines distance as the number of characters needed to turn one term into another. Since the only difference between “cat” and “hat” is the first letter, the distance between them is 1. If we changed “cat” to, say, “dog”, we would get a distance of 3.
The point is to focus on engaging a machine learning algorithm as a scientific apparatus. Get familiar with its interface and its output. Form mental models that will allow you to anticipate the relationship between the two. Thoroughly test that mental model. If you can understand the algorithm, you can understand the hypotheses it produces and you can begin the search for evidence that will confirm or refute the hypothesis.
Chapter 4. How to Think Like a Data
Scientist
Practical Induction
Data science is about finding signals buried in the noise. It’s tough to do, but there is a certain way of thinking about it that I’ve found useful. Essentially, it comes down to finding practical methods of induction, where I can infer general principles from observations, and then reason about the credibility of those principles.
Induction is the go-to method of reasoning when you don’t have all of the information. It takes you from observations to hypotheses to the credibility of each hypothesis. In practice, you start with a hypothesis and collect data you think can give you answers. Then, you generate a model and use it to explain the data. Next, you evaluate the credibility of the model based on how well it explains the data observed so far. This method works ridiculously well.
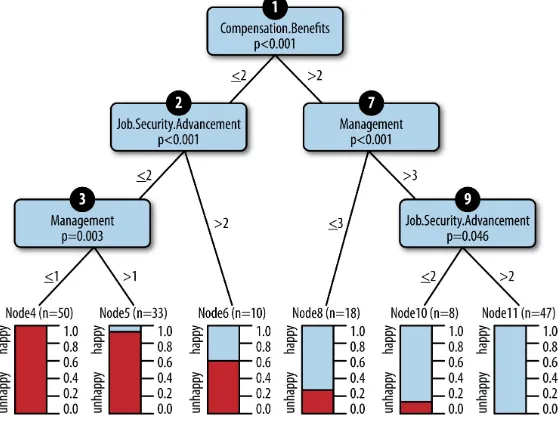
Figure 4-1. A decision-tree model that predicts employee happiness
Each employee responded to questions on a scale from 0 to 5, with 0 being negative and 5 being positive. The leaf nodes of the tree provide a prediction of how many employees were likely to be happy under different circumstances. We arrived at a model that predicted—as long as employees felt they were paid even moderately well, had management that cared, and options to advance—they were very likely to be happy.
The Logic of Data Science
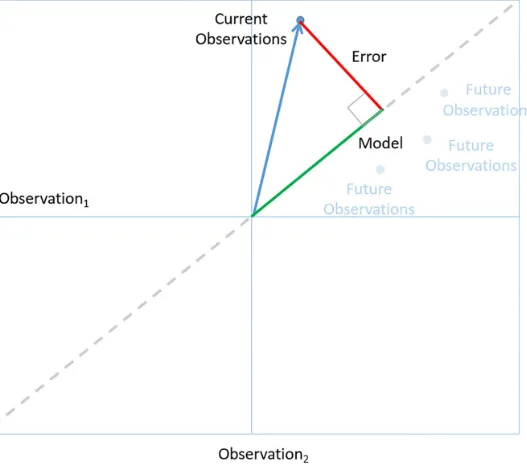
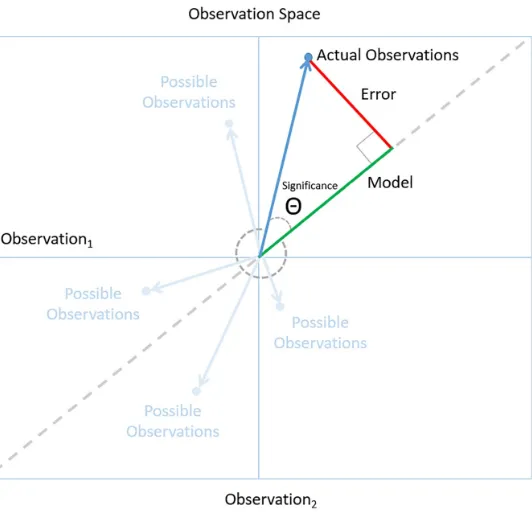
Figure 4-2. The observation space: using the statistical triangle to illustrate the logic of data science
Each axis represents a set of observations. For example a set of employee satisfaction responses. In a two-dimensional space, a point in the space represents a collection of two independent sets of
observations. We call the vector from the origin to a point, an observation vector (the blue arrow). In the case of our employee surveys, an observation vector represents two independent sets of employee satisfaction responses, perhaps taken at different times. We can generalize to an arbitrary number of independent observations, but we’ll stick with two because a two-dimensional space is easier to draw.
underlying principle.
The decision tree of employee happiness is an example of a model. The model summarizes
observations made of individual employee survey responses. When you think like a data scientist, you want a model that you can apply consistently across all observations (ones that lie along the dotted line in observation space). In the employee satisfaction analysis, the decision-tree model can accurately classify a great majority of the employee responses we observed.
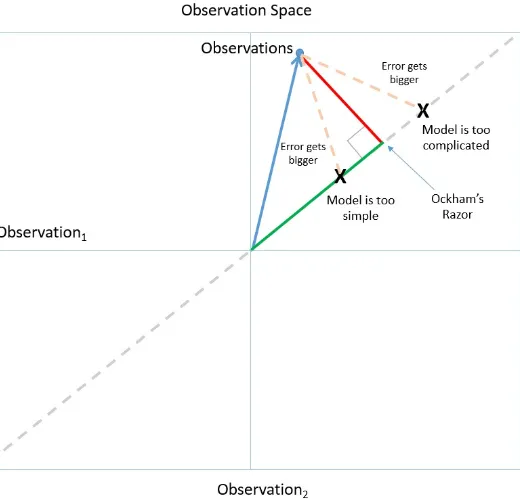
The green line is the model that fits the criteria of Ockham’s Razor (Figure 4-3): among the models that fit the observations, it has the smallest error and, therefore, is most likely to accurately predict future observations. If the model were any more or less complicated, it would increase error and decrease in predictive power.
Ultimately, the goal is to arrive at insights we can rely on to make high-quality decisions in the real world. We can tell if we have a model we can trust by following a simple rule of Bayesian reasoning: look for a level of fit between model and observation that is unlikely to occur just by chance. For example, the low P values for our employee satisfaction model tells us that the patterns in the
decision tree are unlikely to occur by chance and, therefore, are significant. In observation space, this corresponds to small angles (which are less likely than larger ones) between the observation vector and the model. See Figure 4-4.
Figure 4-4. A small angle indicates a significant model because it’s unlikely to happen by chance
observations. The best models are the ones that describe the observations with a minimum of error. It’s unlikely that random observations will have a model that fits with a relatively small error. Models like these are significant to someone who thinks like a data scientist. It means that we’ve likely found the underlying order we were looking for. We’ve found the signal buried in the noise.
Treating Data as Evidence
The logic of data science tells us what it means to treat data as evidence. But following the evidence does not necessarily lead to a smooth increase or decrease in confidence in a model. Models in real-world data science change, and sometimes these changes can be dramatic. New observations can change the models you should consider. New evidence can change confidence in a model. As we collected new employee satisfaction responses, factors like specific job titles became less important, while factors like advancement opportunities became crucial. We stuck with the methods described in this chapter, and as we collected more observations, our models became more stable and more
reliable.
Chapter 5. How to Write Code
My experience of being a data scientist is not at all like what I’ve read in books and blogs. I’ve read about data scientists working for digital superstar companies. They sound like heroes writing
automated (near-sentient) algorithms constantly churning out insights. I’ve read about MacGyver-like data scientist hackers who save the day by cobbling together data products from whatever raw
material they have around.
The data products my team creates are not important enough to justify huge enterprise-wide
infrastructures. It’s just not worth it to invest in hyperefficient automation and production control. On the other hand, our data products influence important decisions in the enterprise, and it’s important that our efforts scale. We can’t afford to do things manually all the time, and we need efficient ways of sharing results with tens of thousands of people.
There are a lot of us out there—the “regular” data scientists. We’re more organized than hackers, but have no need for a superhero-style data science lair. A group of us met and held a speed ideation event, where we brainstormed on the best practices we need to write solid code. This chapter is a summary of the conversation and an attempt to collect our knowledge, distill it, and present it in one place.
The Professional Data Science Programmer
Data scientists need software engineering skills—just not all the skills a professional software engineer needs. I call data scientists with essential data product engineering skills “professional” data science programmers. Professionalism isn’t a possession like a certification or hours of experience; I’m talking about professionalism as an approach. The professional data science programmer is self-correcting in their creation of data products. They have general strategies for recognizing where their work sucks and correcting the problem.
The professional data science programmer has to turn a hypothesis into software capable of testing that hypothesis. Data science programming is unique in software engineering because of the types of problems data scientists tackle. The big challenge is that the nature of data science is experimental. The challenges are often difficult, and the data is messy. For many of these problems, there is no
known solution strategy, the path toward a solution is not known ahead of time, and possible solutions are best explored in small steps. In what follows, I describe general strategies for a disciplined,
productive trial-and-error process: breaking problems into small steps, trying solutions, and making corrections along the way.
Think Like a Pro
structured. You have to know how to design a solution, you have to be able to recognize when you have a solution, and you have to be able to recognize when you don’t fully understand your solution. That last point is essential to being self-correcting. When you recognize the conceptual gaps in your approach, you can fill them in yourself. To design a data science solution in a way that you can be self-correcting, I’ve found it useful to follow the basic process of look, see, imagine, and show. Step 1: Look
Start by scanning the environment. Do background research and become aware of all the pieces that might be related to the problem you are trying to solve. Look at your problem in as much breadth as you can. Get visibility into as much of your situation as you can and collect disparate pieces of information.
Step 2: See
Take the disparate pieces you discovered and chunk them into abstractions that correspond to elements of the blackboard pattern.1 At this stage, you are casting elements of the problem into meaningful, technical concepts. Seeing the problem is a critical step for laying the groundwork for creating a viable design.
Step 3: Imagine
Given the technical concepts you see, imagine some implementation that moves you from the present to your target state. If you can’t imagine an implementation, then you probably missed something when you looked at the problem.
Step 4: Show
Explain your solution first to yourself, then to a peer, then to your boss, and finally to a target user. Each of these explanations need only be just formal enough to get your point across: a water-cooler conversation, an email, a 15-minute walkthrough. This is the most important regular
practice in becoming a self-correcting professional data science programmer. If there are any holes in your approach, they’ll most likely come to light when you try to explain it. Take the time to fill in the gaps and make sure you can properly explain the problem and its solution.
Design Like a Pro
The activities of creating and releasing a data product are varied and complex, but, typically, what you do will fall somewhere in what Alistair Croll2 describes as the big-data supply chain (Figure
Figure 5-1. The big data supply chain
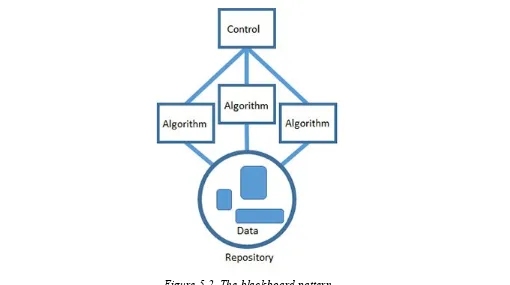
Because data products execute according to a paradigm (real time, batch mode, or some hybrid of the two), you will likely find yourself participating in a combination of data supply chain activity and a data-product paradigm: ingesting and cleaning batch-updated data, building an algorithm to analyze real-time data, sharing the results of a batch process, etc. Fortunately, the blackboard architectural pattern (Figure 5-2) gives us a basic blueprint for good software engineering in any of these
scenarios.
Figure 5-2. The blackboard pattern
into a set of smaller, self-contained subtasks. Each subtask transforms your hypothesis into one that’s easier to solve or a hypothesis whose solution is already known. Each task gradually improves the solution and leads, hopefully, to a viable resolution.
Data science is awash in tools, each with its own unique virtues. Productivity is a big deal, and I like letting my team choose whatever tools they are most familiar with. Using the blackboard pattern
makes it okay to build data products from a collection of different technologies. Cooperation between algorithms happens through a shared repository. Each algorithm can access data, process it as input, and deliver the results back to the repository for some other algorithm to use as input.
Last, the algorithms are all coordinated using a single control component that represents the heuristic used to solve the problem (Figure 5-3). The control is the implementation of the strategy you’ve
chosen to solve the problem. This is the highest level of abstraction and understanding of the problem, and it’s implemented by a technology that can interface with and determine the order of all the other algorithms. The control can be something automated like a cron job or a script. Or it can be manual, like a person that executes the different steps in the proper order. But overall, it’s the total strategy for solving the problem. It’s the one place you can go to see the solution to the problem from start to
finish.
Figure 5-3. The component parts of the blackboard pattern
This basic approach has proven useful in constructing software systems that have to solve uncertain, hypothetical problems using incomplete data. The best part is that it lets us make progress with an uncertain problem using certain, deterministic pieces. Unfortunately, there is no guarantee that your efforts will actually solve the problem. It’s better to know sooner rather than later if you are going down a path that won’t work. You do this using the order in which you implement the system.
Build Like a Pro
workload or the part you understand the least.
Figure 5-4. Implementing the pieces of the blackboard pattern
You can build out components in any order by focusing on a single element and stubbing3 out the rest. If you decide, for example, to start by building an algorithm, dummy up the input data and define a temporary spot to write the algorithm’s output.
Then, implement a data product in the order of technical risk: riskiest elements first. Focus on a particular element, stub out the rest, and replace the stubs later. In Chapter 4, I described an analysis we performed on employee satisfaction data. After we had a model that told us which factors
influenced happiness, we wanted to do further analysis to find out why those factors were important. The plan was to take employees that the model identified as happy, and build a topic model from their unstructured text comments.
I was certain that I could write the algorithm needed to produce the topic model. I was somewhat confident that I could access the data, but I wasn’t sure at all how to coordinate all the pieces so that they fit into a coherent analysis. I decided to start by writing the control. I wrote the following R code, then ran it to make sure that it executed as expected:
#Read in the employee ratings
ratings <- read.csv(file = "dummy_company_reviews.csv")
#This function takes raw employee ratings, processes them, #builds a topic model then displays the topics
topic_model <- function(ratings){
topic_model_stub <- c("topic1","topic2","topic3") }
#Perform a topic analysis on the reviewers with factors that #match happy employees. The resulting topics will give us more #information about why the employees are happy
ratings.happy.desc <- ratings.happy[,"Review.Description.Translated"] topic_model(ratings.happy.desc)
Notice that I wrote the code to perform the high-level steps of the analysis, but I stubbed out the functionality for providing data and doing the topic modeling. For the data, I just wrote a dummy file with text I made up. For the topic model algorithm, I wrote just enough code to produce an output that could be used by the control logic. After I was confident that I understood how the individual pieces fit, and that I had control logic that worked, I started working on gathering real input data. I wrote the comments of happy employees to a file, then read that data in for analysis. After updating the control with the following code, I ran the entire script to make sure that things were still executing as
expected:
#Read in the employee ratings
ratings <- read.csv(file = "rn_indeed_company_reviews_06_14_2015.csv")
After I had control logic that I trusted and live data, I was in a position to write the actual topic modeling algorithm. I replaced the body of the topic model function with real code that acted on the live data. I ran the entire script again and checked to make sure everything was still working:
topic_model <- function(ratings){
#write the body of code needed to perform an #actual topic model analysis
}
The key is to build and run in small pieces: write algorithms in small steps that you understand, build the repository one data source at a time, and build your control one algorithm execution step at a time. The goal is to have a working data product at all times—it just won’t be fully functioning until the end.
Learn Like a Pro
Every pro needs quality tools. There are a lot of choices available. I wanted this section to be a list of those tools, but the state of the art changes so quickly that the list would be out of date pretty soon after it reached the readers. What’s more useful than a list of tools are techniques for learning new tools rapidly and putting them to productive use.
The way that new data science tools are usually presented, you have to master a lot of theoretical background before you can apply the tool to anything meaningful. I’m what Jeanette M. Wing calls a computational thinker. I think in terms of simple discrete transactions and I understand things by running them and watching what they do. For me, the thought of sitting through lectures, doing homework, reading technical specifications is just...uuuugghhh!
2. Choose a tool.
3. Get the tool to produce an output—any output. 4. Tinker with Step 3 until you’ve addressed Step 1.
For example, before analyzing the employee satisfaction data, I didn’t know how to perform a topic model analysis. I read enough about topic modeling to understand its purpose and to guess that it was a good match for my problem. I chose an R library and got sample code to run. Piece-by-piece, I changed parts of the sample code to fit my employee satisfaction analysis. Each time I made a change, I tested the results and learned along the way. When I was done, I did a review4 to make sure that I understood the algorithm.
Learning this way requires some sacrifice. You have to be a pragmatist—willing to focus on what’s needed to solve a particular problem. The way I learned about topic modeling made me proficient at a particular application, but (I imagine) that there are all kinds nuances I skipped over. I’ve found the problem-solving approach to learning new tools is a very reliable way to learn the most important features very quickly. Nor has such a focused approach hurt my understanding of the general
principles involved.
I describe the blackboard pattern in more detail in the next section.
https://twitter.com/acroll
A stub is a piece of code that serves as a simulation for some piece of programming functionality. A stub is a simple, temporary substitute for yet-to-be-developed code.
In Chapter 3, I describe a technique for recognizing whether or not you understand an algorithm.
1
2
3
Chapter 6. How to Be Agile
I lead a research team of data scientists responsible for discovering insights that lead to market and competitive intelligence for our company. We are a busy group. We get questions from all different areas of the company and it’s important to be agile.
The nature of data science is experimental. You don’t know the answer to the question asked of you— or even if an answer exists. You don’t know how long it will take to produce a result or how much data you need. The easiest approach is to just come up with an idea and work on it until you have something. But for those of us with deadlines and expectations, that approach doesn’t fly. Companies that issue you regular paychecks usually want insight into your progress.
This is where being agile matters. An agile data scientist works in small iterations, pivots based on results, and learns along the way. Being agile doesn’t guarantee that an idea will succeed, but it does decrease the amount of time it takes to spot a dead end. Agile data science lets you deliver results on a regular basis and it keeps stakeholders engaged.
The key to agile data science is delivering data products in defined time boxes—say, two- to three-week sprints. Short delivery cycles force us to be creative and break our research into small chunks that can be tested using minimum viable experiments (Figure 6-1). We deliver something tangible after almost every sprint for our stakeholders to review and give us feedback. Our stakeholders get better visibility into our work, and we learn early on if we are on track.
This approach might sound obvious, but it isn’t always natural for the team. We have to get used to working on just enough to meet stakeholder’s needs and resist the urge to make solutions perfect before moving on. After we make something work in one sprint, we make it better in the next only if we can find a really good reason to do so.
An Example Using the StackOverflow Data Explorer
Being an agile data scientist sounds good, but it’s not always obvious how to put the theory into everyday practice. In business, we are used to thinking about things in terms of tasks, but the agile data scientist has to be able to convert a task-oriented approach into an experiment-oriented
approach. Here’s a recent example from my personal experience.
Our CTO is responsible for making sure the company has the next-generation skills we need to stay competitive—that takes data. We have to know what skills are hot and how difficult they are to attract and retain. Our team was given the task of categorizing key skills by how important they are, and by how rare they are (Figure 6-2).
Figure 6-2. Our system of categorizing skills based on estimates of the importance and rarity of each skill
We already developed the ability to categorize key skills as important or not. By mining years of CIO survey results, social media sites, job boards, and internal HR records, we could produce a list of the skills most needed to support any of CSC’s IT priorities. For example, the following is a list of
programming language skills with the highest utility across all areas of the company:
Language Importance (0-1 scale)
Java 1
SQL 0.4
Python 0.3
C++ 0.1 Perl 0.1
Note that this is a composite score for all the different technology domains we considered. The
importance of Python, for example, varies a lot depending on whether or not you are hiring for a data scientist or a mainframe specialist.
For our top skills, we had the “importance” dimension, but we still needed the “abundance”
dimension. We considered purchasing IT survey data that could tell us how many IT professionals had a particular skill, but we couldn’t find a source with enough breadth and detail. We considered conducting a survey of our own, but that would be expensive and time-consuming. Instead, we decided to take a step back and perform an agile experiment.
Our goal was to find the relative number of technical professionals with a certain skill. Perhaps we could estimate that number based on activity within a technical community. It seemed reasonable to assume that the more people who have a skill, the more you will see helpful posts in communities like StackOverflow. For example, if there are twice as many Java programmers as Python programmers, you should see about twice as many helpful Java programmer posts as Python programmer posts. Which led us to a hypothesis:
You can predict the relative number of technical professionals with a certain IT skill based on the relative number of helpful contributors in a technical community.
We looked for the fastest, cheapest way to test the hypothesis. We took a handful of important programming skills and counted the number of unique contributors with posts rated above a certain threshold. We ran this query in the StackOverflow Data Explorer:
SELECT
Posts.CreationDate BETWEEN '1/1/2012' AND '1/1/2015' AND Tags.TagName IN ('python', 'r', 'java', 'perl', 'sql', 'c#', 'c++') GROUP BY
Tags.TagName
Which gave us these results:
Programming language Unique contributors Scaled value (0-1)
Java 2276 1.00
C++ 1529 0.67
Python 1380 0.61
SQL 314 0.14
Perl 70 0.03
We converted the scores according to a linear scale with the top score mapped to 1 and the lowest score being 0. Considering a skill to be “plentiful” is a relative thing. We decided to use the skill with the highest population score as the standard. At first glance, these results seemed to match our intuition, but we needed a simple, objective way of cross-validating the results. We considered
looking for a targeted IT professional survey, but decided to perform a simple LinkedIn people search instead. We went into LinkedIn, typed a programming language into the search box and recorded the number of people with that skill:
Programming language LinkedIn population (M) Scaled value (0-1)
SQL 5.2 1.00
Some of the results of the experiment matched the cross-validation, but some were way off. The Java and C++ population scores predicted by the experiment matched pretty closely with the validation. But the experiment predicted that SQL would be one of the rarest skills, while the LinkedIn search told us that it is the most plentiful. This discrepancy makes sense. Foundational skills, like SQL, that have been around a while will have a lot of practitioners, but are unlikely to be a hot topic of
discussion. By the way, adjusting the allowable post creation dates made little difference to the relative outcome.
Figure 6-3. Categorizing programming languages based on importance and rarity
Putting the Results into Action
We applied what we learned to the task of finding the most important agile skills on the market. We used the techniques described above to categorize each agile skill as Specialize, Recruit, Modernize, or Maintain (Figure 6-4). We considered the results to be a set of hypotheses about how our company should handle each skill.
Figure 6-4. A plot of all Agile skills, tools, and practices categorized by importance and rarity
There were too many skills on the chart itself to show labels for every skill. Instead, we gave each skill on the chart a numerical ID, and created an index that mapped the ID to the name of the skill. The following table shows IDs and skill names for many of the skills located in the Recruit category.
Skill Skill ID
microsoft team foundation server 4
The results gave us a number of insights about the agile skills market. First, the results are consistent with a field that has plenty of room for growth and opportunity. The staple skills that should simply be maintained are relatively sparse, while there are a significant number of skills that should be targeted for recruiting.
Many of the skills fell into the Specialize category, suggesting opportunities to specialize around practices like agile behavior-driven development, agile backlog grooming, and agile pair
programming. The results also suggest opportunities to modernize existing practices such as code reviews, design patterns, and continuous integration into a more agile style.
The data scientists were able to act as consultants to our internal talent development groups. We helped set up experiments and monitor results. We provided recommendations on training materials and individual development plans.
Lessons Learned from a Minimum Viable Experiment
The entire experiment, from hypothesis to conclusion, took just three hours to complete. Along the way, there were concerns about which StackOverflow contributors to include, how to define a helpful post, and the allowable sizes of technical communities—the list of possible pitfalls went on and on. But we were able to slice through the noise and stay focused on what mattered by sticking to a basic hypothesis and a minimum viable experiment.
Using simple tests and minimum viable experiments, we learned enough to deliver real value to our stakeholders in a very short amount of time. No one is getting hired or fired based on these results, but we can now recommend to our stakeholders strategies for getting the most out of our skills. We can recommend targets for recruiting and strategies for prioritizing talent development efforts. Best of all, I think, we can tell our stakeholders how these priorities should change depending on the technology domain.
I focused mostly on the triumph of agile, but there is a dark side. Being agile forces faster delivery, creativity, and visible progress. But where you see the delivery of a minimum viable product, there will inevitably be others who see crappy work. I can avoid the issue with weasel statements like
...of course you have to balance the desire for agility with the need for completeness...
But a disclaimer like that will bring little solace on the days you take heat for releasing works in progress. Negative reactions can range from coworkers politely warning you about damage to your reputation, to having someone find and berate your boss.1 The criticism will die down as you iterate (and as you succeed), but until then, the best defense is the support of project partners.2 The next best option is to prepare yourself ahead of time. Being prepared means imagining negative responses before they happen. It’s not healthy to dwell on it, but it’s good to spend at least a little time anticipating the objections to the work. Sometimes you can head off objections by making small changes. And sometimes it’s best to let things run their course.
Putting up with the negative aspects of being agile is worth it. Being agile is about finding simple effective solutions to complex problems. As a data scientist, if you can build up the emotional resilience it takes to stay agile, you will increase your ability to get to real accomplishments faster and more consistently. You get to produce the kinds of simple and open insights that will have a real and positive impact on your business.
These are real examples, by the way.
In the next chapter, I describe the importance of having project partners to help get you through the rough times.
1
Chapter 7. How to Survive in Your
Organization
I wanted so badly to write a chapter on how to “manage up” if you are a data scientist. Data scientists are in the theory business. No matter how much data is collected or how many algorithms are written, the work is just numbers on a page and graphs on a screen until someone with resources takes action. And that someone is usually your boss. Managing up is the art of convincing your boss that there is enough value in the research to justify taking an action.
I’ve resolved to write only about the things that I’ve seen work firsthand, and the problem is that I don’t manage up—ever. I’ve looked into every persuasion technique I could find: ways to win friends and influence people, raising my emotional intelligence, improving my ability to tell compelling data stories. But, in my experience, people are just going to do what they’re going to do. I haven’t been able to find a Jedi mind trick that could consistently change that. But I have found a handful of factors that are indicators of a healthy, supportive environment for productive data science research.
You Need a Network
Figure 7-1. The pyramid-shaped organization
Network-shaped businesses are built on informal connections (Figure 7-2). Teams form, stuff gets done, you move on to the next thing. In the network, you have the freedom to reach out to different groups. If your boss doesn’t see value in your research, it’s acceptable to shop it around to see if someone else does.
Regardless of how solid your research or how well-crafted your data story, without an active
Figure 7-2. The network-shaped organization
You Need A Patron
I’m convinced that when an organization transforms, it isn’t because the people change. It’s because new people rise to prominence. Data science is transformative. The whole goal is to find new, hidden insights. To survive in an organization, the data scientist needs a patron capable of connecting you to people interested in organizational change.
The patron removes organizational barriers that stop you from making progress. She’s influential outside the normal circles in which you run. Hers is the name you drop when, for example, the security guys are dragging their feet approving your data access request. The patron is more than a powerful sponsor. She’s a believer in the cause. She’s willing to act on your behalf without much justification.
Without at least one patron in the organization, you are unlikely to secure the resources and support you need to make meaningful progress.
You Need Partners
declares the need for a data science project or capability. There’s a flood of excitement and inflated expectations. The project gets underway, the first results are produced, and the organization plummets into disillusionment over the difference between what was imagined and what was produced.
Figure 7-3. The data science project hype cycle
This is when having project partners comes in handy. Partners are the coworkers on the team who have bought in to the mission. Your partners take the work produced so far and help channel it into incremental gains for the business. They help to reset expectations with the rest of the group. They help pivot the work and the project goals in ways that make the two match up.
If you promise the right things, it can be surprisingly easy to get a shot at leading a high-profile data science project. But to build up enough steam to make it pass the trough of disillusionment, you need to have partners willing to help get out and push. When data scientists experience the frustration of their efforts not making an impact, it’s usually because they lack partner support.
WHY A GOOD DATA SCIENTIST IS LIKE A FLIGHT ATTENDANT
One of the hardest parts of being a data scientist is trying to control the mania at the beginning of a project. Many of these projects start when a higher-up announces that we have an important business question and we need data to arrive at an answer. That proclamation is like yelling “fire” in a crowded movie theater. Anyone with data starts the frantic dash to collect, format, and distribute it.
I like what the flight attendants do. At the beginning of every flight, they take you through the plan. They point out the exits and describe an orderly evacuation. That’s what a good data scientist will do as well:
It’s a Jungle Out There
Chapter 8. The Road Ahead
Data Science Today
Kaggle is a marketplace for hosting data science competitions. Companies post their questions and data scientists from all over the world compete to produce the best answers. When a company posts a challenge, it also posts how much it’s willing to pay to anyone who can find an acceptable answer. If you take the questions posted to Kaggle and plot them by value in descending order, the graph looks like Figure 8-1.
Figure 8-1. The value of questions posted to Kaggle matches a long-tail distribution
This is a classic long-tail distribution. Half the value of the Kaggle market is concentrated in about 6% of the questions, while the other half is spread out among the remaining 94%. This distribution gets skewed even more if you consider all the questions with no direct monetary value—questions that offer incentives like jobs or kudos.
I strongly suspect that the wider data science market has the same long-tail shape. If I could get every company to declare every question that could be answered using data science, and what they would offer to have those questions answered, I believe that the concentration of value would look very similar to that of the Kaggle market.
advanced technologies) to go after a small number of high-profile questions (like how to diagnose an illness or predict the failure of a machine). It makes me think of the early days of computing where, if you had the need for computation, you had to find an institution with enough resources to support a mainframe.
The computing industry changed. The steady progress of Moore’s law decentralized the market. Computing became cheaper and diffused outward from specialized institutions to everyday
corporations to everyday people. I think that data science is poised for a similar progression. But instead of Moore’s law, I think the catalyst for change will be the rise of collaboration among data scientists.
Data Science Tomorrow
I believe that the future of data science is in collaborations like outside-in innovation and open research. It means putting a hypothesis out in a public forum, writing openly with collaborators from other companies and holding open peer reviews. I used to think that this would all require expensive and exotic social business platforms, but, so far, it hasn’t.
Figure 8-2. We peer reviewed research in business model simulation as an open collaboration between business strategists and data scientists
This kind of collaboration is a small part of what is ultimately possible. It’s possible to build entire virtual communities adept at extracting value from data, but it will take time. A community would have to go well beyond the kinds of data and analytics centers of excellence in many corporations today. It would have to evolve into a self-sustaining hub for increasing data literacy, curating and sharing data, doing research and peer review.
At first, these collaborations would only be capable of tackling problems in the skinniest parts of the data science long tail. It would be limited to solving general problems that don’t require much
specialized expertise or data. For example, this was exactly how Chapter 5 was born. It started out as a discussion of occasional productivity problems we were having on my team. We eventually
Figure 8-3. Chapter 5 was born as an open collaboration between data scientists and software engineers
But eventually, open data science collaborations will mature until they are trusted enough to take on even our most important business questions. Data science tools will become smarter, cheaper, and easier to use. Data transfer will become more secure and reliable. Data owners will become much less paranoid about what they are willing to share. Open collaboration could be especially beneficial to companies experiencing difficulties finding qualified staff.
Index
A agile
criticism, Don’t Worry, Be Crappy dark side, Don’t Worry, Be Crappy
agile experiment, An Example Using the StackOverflow Data Explorer agile skill, Putting the Results into Action
algorithm
Bayesian reasoning, The Logic of Data Science blackboard pattern, Design Like a Pro
boss, How to Survive in Your Organization
business model simulation, Data Science Tomorrow C
C-Suite, partnering with, The Importance of the Scientific Method collaboration, A Realistic Skill Set, Data Science Today
common sense, Data Science that Works
competitive advantage, The Standard Story Line for Getting Value from Data Science D
data
as evidence, Treating Data as Evidence
Science data science
a competition of hypotheses, Treating Data as Evidence agile, How to Be Agile
algorithms, The Standard Story Line for Getting Value from Data Science definition, An Alternative Story Line for Getting Value from Data Science logic, The Logic of Data Science
making money, Data Science Today market, Data Science Today
process, Realistic Expectations
standard story line, The Standard Story Line for Getting Value from Data Science
stories, The Standard Story Line for Getting Value from Data Science, The Importance of the Scientific Method
that works, Data Science that Works the future of, Data Science Tomorrow
the nature of, The Professional Data Science Programmer tools, Design Like a Pro
value of, The Standard Story Line for Getting Value from Data Science data scientist
the most important quality of, Realistic Expectations
what to look for, The Standard Story Line for Getting Value from Data Science decision-tree, Practical Induction
E
emotional intelligence, How to Survive in Your Organization employee satisfaction, Practical Induction
error, The Logic of Data Science
experimentation, A Realistic Skill Set
hidden patterns, The Standard Story Line for Getting Value from Data Science Hype Cycle for data science, You Need Partners
hypothesis, An Alternative Story Line for Getting Value from Data Science, Practical Induction example, An Example Using the StackOverflow Data Explorer
judging, Realistic Expectations
manage up, How to Survive in Your Organization model, Practical Induction
confidence in, Treating Data as Evidence example, The Logic of Data Science
finding the best, The Logic of Data Science Moore's law, Data Science Today
N
network-shaped business, You Need a Network O
open research, Data Science Tomorrow organizational change, You Need A Patron outside-in innovation, Data Science Tomorrow P
P value, The Logic of Data Science patron, You Need A Patron
persuasion techniques, How to Survive in Your Organization political challenge, It’s a Jungle Out There
problem, progress in solving, Design Like a Pro
productive research, How to Survive in Your Organization professionalism, The Professional Data Science Programmer
scientific method, The Importance of the Scientific Method self-correcting, The Professional Data Science Programmer signal and noise, The Logic of Data Science
detecting, Finding Signals in the Noise
useful in practice, Data Science that Works
StackOverflow, An Example Using the StackOverflow Data Explorer story, How to Survive in Your Organization, You Need a Network T
tools, techniques for learning, Learn Like a Pro transformation, You Need A Patron
trial and error, The Professional Data Science Programmer Turing Test, Realistic Expectations
U
unicorn, Data Science that Works W
About the Author
Jerry Overton is a Data Scientist and Distinguished Engineer at CSC, a global leader of
next-generation IT solutions with 56,000 professionals that serve clients in more than 60 countries. Jerry is head of advanced analytics research and founder of CSC’s advanced analytics lab. This book is
based on articles published in CSC Blogs1 and O’Reilly2 where Jerry shares his experiences leading open research in data science.
http://blogs.csc.com/author/doing-data-science/ https://www.oreilly.com/people/d49ee-jerry-overton
1