Exam 70-463: Implementing a Data Warehouse
with Microsoft SQL Server 2012
Objective chapter LessOn
1. Design anD impLement a Data WarehOuse
1.1 Design and implement dimensions. Chapter 1 Chapter 2
Lessons 1 and, 2 Lessons 1, 2, and 3 1.2 Design and implement fact tables. Chapter 1
Chapter 2
Lesson 3 Lessons 1, 2, and 3 2. extract anD transfOrm Data
2.1 Define connection managers. Chapter 3 Chapter 4 Chapter 9
Lessons 1 and 3 Lesson 1 Lesson 2
2.2 Design data flow. Chapter 3
Chapter 5
2.3 Implement data flow. Chapter 3
Chapter 5 2.4 Manage SSIS package execution. Chapter 8
Chapter 12
Lessons 1 and 2 Lesson 1
2.5 Implement script tasks in SSIS. Chapter 19 Lesson 1
3. LOaD Data
3.1 Design control flow. Chapter 3
Chapter 4 3.2 Implement package logic by using SSIS variables and
parameters.
Chapter 6 Chapter 9
Lessons 1 and 2 Lessons 1 and 2
3.3 Implement control flow. Chapter 4
Chapter 6
3.4 Implement data load options. Chapter 7 Lesson 2
Objective chapter LessOn
4. cOnfigure anD DepLOy ssis sOLutiOns
4.1 Troubleshoot data integration issues. Chapter 10 Chapter 13
Lesson 1 Lessons 1, 2, and 3 4.2 Install and maintain SSIS components. Chapter 11 Lesson 1 4.3 Implement auditing, logging, and event handling. Chapter 8
Chapter 10
Lesson 3 Lessons 1 and 2
4.4 Deploy SSIS solutions. Chapter 11
Chapter 19
Lessons 1 and 2 Lesson 3 4.5 Configure SSIS security settings. Chapter 12 Lesson 2 5. buiLD Data quaLity sOLutiOns
5.1 Install and maintain Data Quality Services. Chapter 14 Lessons 1, 2, and 3 5.2 Implement master data management solutions. Chapter 15
Chapter 16
Lessons 1, 2, and 3 Lessons 1, 2, and 3 5.3 Create a data quality project to clean data. Chapter 14
Chapter 17 Chapter 20
Exam 70-463:
Implementing a Data
Warehouse with
Microsoft
®SQL Server
®2012
Training Kit
Published with the authorization of Microsoft Corporation by:
O’Reilly Media, Inc.
1005 Gravenstein Highway North
Sebastopol, California 95472
Copyright © 2012 by SolidQuality Europe GmbH
All rights reserved. No part of the contents of this book may be reproduced or transmitted in any form or by any means without the written permission of
the publisher.
ISBN: 978-0-7356-6609-2
1 2 3 4 5 6 7 8 9 QG 7 6 5 4 3 2
Printed and bound in the United States of America.
Microsoft Press books are available through booksellers and distributors worldwide. If you need support related to this book, email Microsoft Press
Book Support at [email protected]. Please tell us what you think of
this book at http://www.microsoft.com/learning/booksurvey.
Microsoft and the trademarks listed at http://www.microsoft.com/about/legal/ en/us/IntellectualProperty/Trademarks/EN-US.aspx are trademarks of the Microsoft group of companies. All other marks are property of their respec
-tive owners.
The example companies, organizations, products, domain names, email ad-dresses, logos, people, places, and events depicted herein are fictitious. No association with any real company, organization, product, domain name,
email address, logo, person, place, or event is intended or should be inferred.
This book expresses the author’s views and opinions. The information con-tained in this book is provided without any express, statutory, or implied warranties. Neither the authors, O’Reilly Media, Inc., Microsoft Corporation, nor its resellers, or distributors will be held liable for any damages caused or
alleged to be caused either directly or indirectly by this book.
acquisitions and Developmental editor: Russell Jones
production editor: Holly Bauer
editorial production: Online Training Solutions, Inc.
technical reviewer: Miloš Radivojević
copyeditor: Kathy Krause, Online Training Solutions, Inc.
indexer: Ginny Munroe, Judith McConville
Contents at a Glance
Introduction xxvii
part i Designing anD impLementing a Data WarehOuse
ChaptEr 1 Data Warehouse Logical Design 3
ChaptEr 2 Implementing a Data Warehouse 41
part ii DeveLOping ssis packages
ChaptEr 3 Creating SSIS packages 87
ChaptEr 4 Designing and Implementing Control Flow 131
ChaptEr 5 Designing and Implementing Data Flow 177
part iii enhancing ssis packages
ChaptEr 6 Enhancing Control Flow 239
ChaptEr 7 Enhancing Data Flow 283
ChaptEr 8 Creating a robust and restartable package 327
ChaptEr 9 Implementing Dynamic packages 353
ChaptEr 10 auditing and Logging 381
part iv managing anD maintaining ssis packages
ChaptEr 11 Installing SSIS and Deploying packages 421
ChaptEr 12 Executing and Securing packages 455
ChaptEr 13 troubleshooting and performance tuning 497
part v buiLDing Data quaLity sOLutiOns
ChaptEr 14 Installing and Maintaining Data Quality Services 529
ChaptEr 15 Implementing Master Data Services 565
ChaptEr 16 Managing Master Data 605
part vi aDvanceD ssis anD Data quaLity tOpics
ChaptEr 18 SSIS and Data Mining 667
ChaptEr 19 Implementing Custom Code in SSIS packages 699
ChaptEr 20 Identity Mapping and De-Duplicating 735
What do you think of this book? We want to hear from you!
Microsoft is interested in hearing your feedback so we can continually improve our
Contents
introduction xxvii
System Requirements xxviii
Using the Companion CD xxix
Acknowledgments xxxi
Support & Feedback xxxi
Preparing for the Exam xxxiii
part i
Designing anD impLementing a Data WarehOuse
chapter 1 Data Warehouse Logical Design
3
Before You Begin . . . 4
Lesson 1: Introducing Star and Snowflake Schemas . . . 4
Reporting Problems with a Normalized Schema 5
Star Schema 7
Snowflake Schema 9
Granularity Level 12
Auditing and Lineage 13
Lesson Summary 16
Lesson Review 16
Lesson 2: Designing Dimensions . . . 17 Dimension Column Types 17 Hierarchies 19
Slowly Changing Dimensions 21
Lesson Summary 26
Lesson 3: Designing Fact Tables . . . 27
Fact Table Column Types 28
Additivity of Measures 29 Additivity of Measures in SSAS 30
Many-to-Many Relationships 30
Lesson Summary 33
Lesson Review 34
Case Scenarios . . . 34
Case Scenario 1: A Quick POC Project 34 Case Scenario 2: Extending the POC Project 35 Suggested Practices . . . 35
Analyze the AdventureWorksDW2012 Database Thoroughly 35 Check the SCD and Lineage in the
AdventureWorks-DW2012 Database 36
Answers . . . 37
Lesson 1 37
Lesson 2 37
Lesson 3 38
Case Scenario 1 39
Case Scenario 2 39
chapter 2 implementing a Data Warehouse
41
Before You Begin . . . 42
Lesson 1: Implementing Dimensions and Fact Tables . . . 42
Creating a Data Warehouse Database 42
Implementing Dimensions 45
Implementing Fact Tables 47
Lesson Summary 54
Lesson Review 54
Lesson 2: Managing the Performance of a Data Warehouse . . . 55
Lesson Summary 69
Lesson Review 70
Lesson 3: Loading and Auditing Loads . . . 70
Using Partitions 71
Data Lineage 73
Lesson Summary 78
Lesson Review 78
Case Scenarios . . . 78
Case Scenario 1: Slow DW Reports 79
Case Scenario 2: DW Administration Problems 79 Suggested Practices . . . 79 Test Different Indexing Methods 79
Test Table Partitioning 80
Answers . . . 81
Lesson 1 81
Lesson 2 81
Lesson 3 82
Case Scenario 1 83
Case Scenario 2 83
part ii
DeveLOping ssis packages
chapter 3 creating ssis packages
87
Before You Begin . . . 89
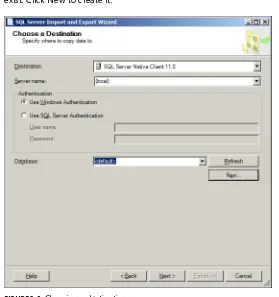
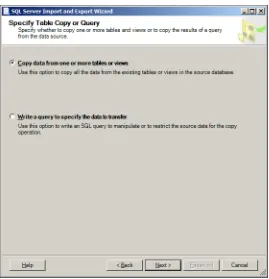
Lesson 1: Using the SQL Server Import and Export Wizard . . . 89
Planning a Simple Data Movement 89
Lesson Summary 99
Lesson Review 99
Lesson 2: Developing SSIS Packages in SSDT . . . 101
Introducing SSDT 102
Lesson Summary 107
Introducing SSIS Development 110
Introducing SSIS Project Deployment 110
Lesson Summary 124
Lesson Review 124
Case Scenarios . . . 125
Case Scenario 1: Copying Production Data to Development 125 Case Scenario 2: Connection Manager Parameterization 125 Suggested Practices . . . 125
Use the Right Tool 125
Account for the Differences Between Development and
Production Environments 126
Answers . . . 127
Lesson 1 127
Lesson 2 128
Lesson 3 128
Case Scenario 1 129
Case Scenario 2 129
chapter 4 Designing and implementing control flow
131
Before You Begin . . . 132
Lesson 1: Connection Managers . . . 133
Lesson Summary 144
Lesson Review 144
Lesson 2: Control Flow Tasks and Containers . . . 145
Planning a Complex Data Movement 145
Tasks 147 Containers 155
Lesson Summary 163
Lesson Review 163
Lesson 3: Precedence Constraints . . . 164
Case Scenarios . . . 170
Case Scenario 1: Creating a Cleanup Process 170 Case Scenario 2: Integrating External Processes 171 Suggested Practices . . . 171 A Complete Data Movement Solution 171
Answers . . . 173
Lesson 1 173
Lesson 2 174
Lesson 3 175
Case Scenario 1 176
Case Scenario 2 176
chapter 5 Designing and implementing Data flow
177
Before You Begin . . . 177
Lesson 1: Defining Data Sources and Destinations . . . 178
Creating a Data Flow Task 178
Defining Data Flow Source Adapters 180
Defining Data Flow Destination Adapters 184
SSIS Data Types 187
Lesson Summary 197
Lesson Review 197
Lesson 2: Working with Data Flow Transformations . . . 198 Selecting Transformations 198
Using Transformations 205
Lesson Summary 215
Lesson Review 215
Lesson 3: Determining Appropriate ETL Strategy and Tools . . . 216
ETL Strategy 217
Lookup Transformations 218
Sorting the Data 224
Set-Based Updates 225
Lesson Summary 231
Case Scenario . . . 232
Case Scenario: New Source System 232
Suggested Practices . . . 233 Create and Load Additional Tables 233
Answers . . . 234
Lesson 1 234
Lesson 2 234
Lesson 3 235
Case Scenario 236
part iii
enhancing ssis packages
chapter 6 enhancing control flow
239
Before You Begin . . . 241
Lesson 1: SSIS Variables . . . 241
System and User Variables 243
Variable Data Types 245
Variable Scope 248
Property Parameterization 251
Lesson Summary 253
Lesson Review 253
Lesson 2: Connection Managers, Tasks, and Precedence
Constraint Expressions . . . 254 Expressions 255
Property Expressions 259
Precedence Constraint Expressions 259
Lesson Summary 263
Lesson Review 264
Lesson 3: Using a Master Package for Advanced Control Flow . . . 265
Separating Workloads, Purposes, and Objectives 267 Harmonizing Workflow and Configuration 268
Lesson Summary 275
Lesson Review 275
Case Scenarios . . . 276
Case Scenario 1: Complete Solutions 276 Case Scenario 2: Data-Driven Execution 277 Suggested Practices . . . 277
Consider Using a Master Package 277
Answers . . . 278
Lesson 1 278
Lesson 2 279
Lesson 3 279
Case Scenario 1 280
Case Scenario 2 281
chapter 7 enhancing Data flow
283
Before You Begin . . . 283
Lesson 1: Slowly Changing Dimensions . . . 284
Defining Attribute Types 284
Inferred Dimension Members 285
Using the Slowly Changing Dimension Task 285
Effectively Updating Dimensions 290
Lesson Summary 298
Lesson Review 298
Lesson 2: Preparing a Package for Incremental Load . . . 299
Using Dynamic SQL to Read Data 299
Implementing CDC by Using SSIS 304
ETL Strategy for Incrementally Loading Fact Tables 307
Lesson Summary 316
Lesson Review 316
Lesson 3: Error Flow . . . 317
Using Error Flows 317
Case Scenario . . . 322
Case Scenario: Loading Large Dimension and Fact Tables 322 Suggested Practices . . . 322 Load Additional Dimensions 322
Answers . . . 323
Lesson 1 323
Lesson 2 324
Lesson 3 324
Case Scenario 325
chapter 8 creating a robust and restartable package
327
Before You Begin . . . 328
Lesson 1: Package Transactions . . . 328
Defining Package and Task Transaction Settings 328
Transaction Isolation Levels 331 Manually Handling Transactions 332
Lesson Summary 335
Lesson Review 335
Lesson 2: Checkpoints . . . 336 Implementing Restartability Checkpoints 336
Lesson Summary 341
Lesson Review 341
Lesson 3: Event Handlers . . . 342
Using Event Handlers 342
Lesson Summary 346
Lesson Review 346
Case Scenario . . . 347
Case Scenario: Auditing and Notifications in SSIS Packages 347 Suggested Practices . . . 348
Lesson 3 350
Case Scenario 351
chapter 9 implementing Dynamic packages
353
Before You Begin . . . 354
Lesson 1: Package-Level and Project-Level Connection
Managers and Parameters . . . 354
Using Project-Level Connection Managers 355
Parameters 356
Build Configurations in SQL Server 2012 Integration Services 358
Property Expressions 361
Lesson Summary 366
Lesson Review 366
Lesson 2: Package Configurations . . . 367
Implementing Package Configurations 368
Lesson Summary 377
Lesson Review 377
Case Scenario . . . 378
Case Scenario: Making SSIS Packages Dynamic 378 Suggested Practices . . . 378
Use a Parameter to Incrementally Load a Fact Table 378 Answers . . . 379
Lesson 1 379
Lesson 2 379
Case Scenario 380
chapter 10 auditing and Logging
381
Before You Begin . . . 383
Lesson 1: Logging Packages . . . 383
Log Providers 383
Configuring Logging 386
Lesson 2: Implementing Auditing and Lineage . . . 394
Auditing Techniques 395
Correlating Audit Data with SSIS Logs 401
Retention 401
Lesson Summary 405
Lesson Review 405
Lesson 3: Preparing Package Templates . . . 406
SSIS Package Templates 407
Lesson Summary 410
Lesson Review 410
Case Scenarios . . . 411
Case Scenario 1: Implementing SSIS Logging at Multiple
Levels of the SSIS Object Hierarchy 411
Case Scenario 2: Implementing SSIS Auditing at
Different Levels of the SSIS Object Hierarchy 412
Suggested Practices . . . 412
Add Auditing to an Update Operation in an Existing
Execute SQL Task 412
Create an SSIS Package Template in Your Own Environment 413 Answers . . . 414
Lesson 1 414
Lesson 2 415
Lesson 3 416
Case Scenario 1 417
Case Scenario 2 417
part iv
managing anD maintaining ssis packages
chapter 11 installing ssis and Deploying packages
421
Before You Begin . . . 422
Lesson 1: Installing SSIS Components . . . 423
Lesson 2: Deploying SSIS Packages . . . 437
SSISDB Catalog 438
SSISDB Objects 440
Project Deployment 442
Lesson Summary 449
Lesson Review 450
Case Scenarios . . . 450
Case Scenario 1: Using Strictly Structured Deployments 451 Case Scenario 2: Installing an SSIS Server 451 Suggested Practices . . . 451
Upgrade Existing SSIS Solutions 451
Answers . . . 452
Lesson 1 452
Lesson 2 453
Case Scenario 1 454
Case Scenario 2 454
chapter 12 executing and securing packages
455
Before You Begin . . . 456
Lesson 1: Executing SSIS Packages . . . 456
On-Demand SSIS Execution 457
Automated SSIS Execution 462 Monitoring SSIS Execution 465
Lesson Summary 479
Lesson Review 479
Lesson 2: Securing SSIS Packages . . . 480
SSISDB Security 481
Lesson Summary 490
Lesson Review 490
Case Scenarios . . . 491
Case Scenario 1: Deploying SSIS Packages to Multiple
Environments 491
Suggested Practices . . . 491 Improve the Reusability of an SSIS Solution 492
Answers . . . 493
Lesson 1 493
Lesson 2 494
Case Scenario 1 495
Case Scenario 2 495
chapter 13 troubleshooting and performance tuning
497
Before You Begin . . . 498
Lesson 1: Troubleshooting Package Execution . . . 498
Design-Time Troubleshooting 498
Production-Time Troubleshooting 506
Lesson Summary 510
Lesson Review 510
Lesson 2: Performance Tuning . . . 511
SSIS Data Flow Engine 512
Data Flow Tuning Options 514
Parallel Execution in SSIS 517
Troubleshooting and Benchmarking Performance 518
Lesson Summary 522
Lesson Review 522
Case Scenario . . . 523
Case Scenario: Tuning an SSIS Package 523 Suggested Practice . . . 524
Get Familiar with SSISDB Catalog Views 524 Answers . . . 525
Lesson 1 525
Lesson 2 525
part v
buiLDing Data quaLity sOLutiOns
chapter 14 installing and maintaining Data quality services
529
Before You Begin . . . 530
Lesson 1: Data Quality Problems and Roles . . . 530 Data Quality Dimensions 531 Data Quality Activities and Roles 535
Lesson Summary 539
Lesson Review 539
Lesson 2: Installing Data Quality Services . . . 540
DQS Architecture 540
DQS Installation 542
Lesson Summary 548
Lesson Review 548
Lesson 3: Maintaining and Securing Data Quality Services . . . 549
Performing Administrative Activities with Data Quality Client 549 Performing Administrative Activities with Other Tools 553
Lesson Summary 558
Lesson Review 558
Case Scenario . . . 559
Case Scenario: Data Warehouse Not Used 559 Suggested Practices . . . 560
Analyze the AdventureWorksDW2012 Database 560
Review Data Profiling Tools 560
Answers . . . 561
Lesson 1 561
Lesson 2 561
Lesson 3 562
chapter 15 implementing master Data services
565
Before You Begin . . . 565
Lesson 1: Defining Master Data . . . 566
What Is Master Data? 567
Master Data Management 569
MDM Challenges 572
Lesson Summary 574
Lesson Review 574
Lesson 2: Installing Master Data Services . . . 575 Master Data Services Architecture 576
MDS Installation 577
Lesson Summary 587
Lesson Review 587
Lesson 3: Creating a Master Data Services Model . . . 588 MDS Models and Objects in Models 588
MDS Objects 589
Lesson Summary 599
Lesson Review 600
Case Scenarios . . . .600
Case Scenario 1: Introducing an MDM Solution 600 Case Scenario 2: Extending the POC Project 601 Suggested Practices . . . 601
Analyze the AdventureWorks2012 Database 601
Expand the MDS Model 601
Answers . . . 602
Lesson 1 602
Lesson 2 603
Lesson 3 603
Case Scenario 1 604
chapter 16 managing master Data
605
Before You Begin . . . 605
Lesson 1: Importing and Exporting Master Data . . . 606
Creating and Deploying MDS Packages 606
Importing Batches of Data 607
Exporting Data 609
Lesson Summary 615
Lesson Review 616
Lesson 2: Defining Master Data Security . . . 616
Users and Permissions 617
Overlapping Permissions 619
Lesson Summary 624
Lesson Review 624
Lesson 3: Using Master Data Services Add-in for Excel . . . 624 Editing MDS Data in Excel 625 Creating MDS Objects in Excel 627
Lesson Summary 632
Lesson Review 632
Case Scenario . . . 633
Case Scenario: Editing Batches of MDS Data 633 Suggested Practices . . . 633
Analyze the Staging Tables 633
Test Security 633
Answers . . . 634
Lesson 1 634
Lesson 2 635
Lesson 3 635
chapter 17 creating a Data quality project to clean Data
637
Before You Begin . . . 637
Lesson 1: Creating and Maintaining a Knowledge Base . . . 638
Building a DQS Knowledge Base 638
Domain Management 639
Lesson Summary 645
Lesson Review 645
Lesson 2: Creating a Data Quality Project . . . 646
DQS Projects 646
Data Cleansing 647
Lesson Summary 653
Lesson Review 653
Lesson 3: Profiling Data and Improving Data Quality . . . 654
Using Queries to Profile Data 654
SSIS Data Profiling Task 656
Lesson Summary 659
Lesson Review 660
Case Scenario . . . 660
Case Scenario: Improving Data Quality 660 Suggested Practices . . . 661
Create an Additional Knowledge Base and Project 661 Answers . . . 662
Lesson 1 662
Lesson 2 662
Lesson 3 663
Case Scenario 664
part vi
aDvanceD ssis anD Data quaLity tOpics
chapter 18 ssis and Data mining
667
Using Data Mining Predictions in SSIS 671
Lesson Summary 679
Lesson Review 679
Lesson 2: Text Mining . . . 679
Term Extraction 680
Term Lookup 681
Lesson Summary 686
Lesson Review 686
Lesson 3: Preparing Data for Data Mining . . . 687
Preparing the Data 688
SSIS Sampling 689
Lesson Summary 693
Lesson Review 693
Case Scenario . . . 694
Case Scenario: Preparing Data for Data Mining 694 Suggested Practices . . . 694
Test the Row Sampling and Conditional Split Transformations 694 Answers . . . 695
Lesson 1 695
Lesson 2 695
Lesson 3 696
Case Scenario 697
chapter 19 implementing custom code in ssis packages
699
Before You Begin . . . 700
Lesson 1: Script Task . . . 700
Configuring the Script Task 701
Coding the Script Task 702
Lesson Summary 707
Lesson Review 707
Lesson 2: Script Component . . . 707
Lesson Summary 715
Lesson Review 715
Lesson 3: Implementing Custom Components . . . 716
Planning a Custom Component 717
Developing a Custom Component 718 Design Time and Run Time 719
Design-Time Methods 719
Run-Time Methods 721
Lesson Summary 730
Lesson Review 730
Case Scenario . . . 731
Case Scenario: Data Cleansing 731
Suggested Practices . . . 731
Create a Web Service Source 731
Answers . . . 732
Lesson 1 732
Lesson 2 732
Lesson 3 733
Case Scenario 734
chapter 20 identity mapping and De-Duplicating
735
Before You Begin . . . 736
Lesson 1: Understanding the Problem . . . 736
Identity Mapping and De-Duplicating Problems 736
Solving the Problems 738
Lesson Summary 744
Lesson Review 744
Lesson 2: Using DQS and the DQS Cleansing Transformation . . . 745 DQS Cleansing Transformation 746
DQS Matching 746
Lesson 3: Implementing SSIS Fuzzy Transformations . . . 756
Fuzzy Transformations Algorithm 756
Versions of Fuzzy Transformations 758
Lesson Summary 764
Lesson Review 764
Case Scenario . . . 765
Case Scenario: Improving Data Quality 765 Suggested Practices . . . 765 Research More on Matching 765
Answers . . . 766
Lesson 1 766
Lesson 2 766
Lesson 3 767
Case Scenario 768
Introduction
T
his Training Kit is designed for information technology (IT) professionals who support or plan to support data warehouses, extract-transform-load (ETL) processes, data qual-ity improvements, and master data management. It is designed for IT professionals who also plan to take the Microsoft Certified Technology Specialist (MCTS) exam 70-463. The authors assume that you have a solid, foundation-level understanding of Microsoft SQL Server 2012 and the Transact-SQL language, and that you understand basic relational modeling concepts.The material covered in this Training Kit and on Exam 70-463 relates to the technologies provided by SQL Server 2012 for implementing and maintaining a data warehouse. The topics in this Training Kit cover what you need to know for the exam as described on the Skills Mea-sured tab for the exam, available at:
http://www.microsoft.com/learning/en/us/exam.aspx?id=70-463
By studying this Training Kit, you will see how to perform the following tasks:
■ Design an appropriate data model for a data warehouse
■ Optimize the physical design of a data warehouse
■ Extract data from different data sources, transform and cleanse the data, and load it in your data warehouse by using SQL Server Integration Services (SSIS)
■ Use advanced SSIS components
■ Use SQL Server 2012 Master Data Services (MDS) to take control of your master data
■ Use SQL Server Data Quality Services (DQS) for data cleansing
Refer to the objective mapping page in the front of this book to see where in the book
each exam objective is covered.
system requirements
The following are the minimum system requirements for the computer you will be using to
complete the practice exercises in this book and to run the companion CD.
SQL Server and Other Software requirements
This section contains the minimum SQL Server and other software requirements you will need:
on-premises SQL Server (Standard, Enterprise, Business Intelligence, and Developer), both 32-bit and 64-bit editions. If you don’t have access to an existing SQL Server
instance, you can install a trial copy of SQL Server 2012 that you can use for 180 days.
You can download a trial copy here:
http://www.microsoft.com/sqlserver/en/us/get-sql-server/try-it.aspx
■ sqL server 2012 setup feature selection When you are in the Feature Selection dialog box of the SQL Server 2012 setup program, choose at minimum the following components:
■ Database Engine Services ■ Documentation Components ■ Management Tools - Basic
■ Management Tools – Complete ■ SQL Server Data Tools
■ Windows software Development kit (sDk) or microsoft visual studio 2010 The Windows SDK provides tools, compilers, headers, libraries, code samples, and a new help system that you can use to create applications that run on Windows. You need the Windows SDK for Chapter 19, “Implementing Custom Code in SSIS Packages” only. If you already have Visual Studio 2010, you do not need the Windows SDK. If you need the Windows SDK, you need to download the appropriate version for your operat-ing system. For Windows 7, Windows Server 2003 R2 Standard Edition (32-bit x86), Windows Server 2003 R2 Standard x64 Edition, Windows Server 2008, Windows Server 2008 R2, Windows Vista, or Windows XP Service Pack 3, use the Microsoft Windows SDK for Windows 7 and the Microsoft .NET Framework 4 from:
http://www.microsoft.com/en-us/download/details.aspx?id=8279
hardware and Operating System requirements
You can find the minimum hardware and operating system requirements for SQL Server 2012 here:
http://msdn.microsoft.com/en-us/library/ms143506(v=sql.110).aspx
Data requirements
manufacturer (Adventure Works Cycles), and the AdventureWorks data warehouse (DW) database, which demonstrates how to build a data warehouse. You need to download both databases for SQL Server 2012. You can download both databases from:
http://msftdbprodsamples.codeplex.com/releases/view/55330
You can also download the compressed file containing the data (.mdf) files for both databases from O’Reilly’s website here:
http://go.microsoft.com/FWLink/?Linkid=260986
using the companion cD
A companion CD is included with this Training Kit. The companion CD contains the following:
■ practice tests You can reinforce your understanding of the topics covered in this Training Kit by using electronic practice tests that you customize to meet your needs. You can practice for the 70-463 certification exam by using tests created from a pool of over 200 realistic exam questions, which give you many practice exams to ensure
that you are prepared.
■ an ebook An electronic version (eBook) of this book is included for when you do not want to carry the printed book with you.
■ source code A compressed file called TK70463_CodeLabSolutions.zip includes the Training Kit’s demo source code and exercise solutions. You can also download the compressed file from O’Reilly’s website here:
http://go.microsoft.com/FWLink/?Linkid=260986
For convenient access to the source code, create a local folder called c:\tk463\ and extract the compressed archive by using this folder as the destination for the extracted
files.
■ sample data A compressed file called AdventureWorksDataFiles.zip includes the Training Kit’s demo source code and exercise solutions. You can also download the compressed file from O’Reilly’s website here:
http://go.microsoft.com/FWLink/?Linkid=260986
For convenient access to the source code, create a local folder called c:\tk463\ and extract the compressed archive by using this folder as the destination for the extracted
how to Install the practice tests
To install the practice test software from the companion CD to your hard disk, perform the following steps:
1. Insert the companion CD into your CD drive and accept the license agreement. A CD menu appears.
Note if the cD menu DOes nOt appear
If the CD menu or the license agreement does not appear, autorun might be disabled on your computer. Refer to the Readme.txt file on the CD for alternate installation instructions.
2. Click Practice Tests and follow the instructions on the screen.
how to Use the practice tests
To start the practice test software, follow these steps:1. Click Start | All Programs, and then select Microsoft Press Training Kit Exam Prep. A window appears that shows all the Microsoft Press Training Kit exam prep suites
installed on your computer.
2. Double-click the practice test you want to use.
When you start a practice test, you choose whether to take the test in Certification Mode, Study Mode, or Custom Mode:
■ Certification Mode Closely resembles the experience of taking a certification exam.
The test has a set number of questions. It is timed, and you cannot pause and restart the timer.
■ study mode Creates an untimed test during which you can review the correct an-swers and the explanations after you answer each question.
■ custom mode Gives you full control over the test options so that you can customize
them as you like.
In all modes, when you are taking the test, the user interface is basically the same but with
different options enabled or disabled depending on the mode.
to score your entire practice test, you can click the Learning Plan tab to see a list of references
for every objective.
how to Uninstall the practice tests
To uninstall the practice test software for a Training Kit, use the Program And Features option in Windows Control Panel.
acknowledgments
A book is put together by many more people than the authors whose names are listed on the title page. We’d like to express our gratitude to the following people for all the work they have done in getting this book into your hands: Miloš Radivojević (technical editor) and Fritz Lechnitz (project manager) from SolidQ, Russell Jones (acquisitions and developmental editor)
and Holly Bauer (production editor) from O’Reilly, and Kathy Krause (copyeditor) and Jaime
Odell (proofreader) from OTSI. In addition, we would like to give thanks to Matt Masson (member of the SSIS team), Wee Hyong Tok (SSIS team program manager), and Elad Ziklik
(DQS group program manager) from Microsoft for the technical support and for unveiling the
secrets of the new SQL Server 2012 products. There are many more people involved in writing and editing practice test questions, editing graphics, and performing other activities; we are grateful to all of them as well.
support & feedback
The following sections provide information on errata, book support, feedback, and contact
information.
Errata
We’ve made every effort to ensure the accuracy of this book and its companion content. Any errors that have been reported since this book was published are listed on our Microsoft Press site at oreilly.com:
http://go.microsoft.com/FWLink/?Linkid=260985
If you find an error that is not already listed, you can report it to us through the same page. If you need additional support, email Microsoft Press Book Support at:
Please note that product support for Microsoft software is not offered through the
ad-dresses above.
We Want to hear from You
At Microsoft Press, your satisfaction is our top priority, and your feedback our most valuable asset. Please tell us what you think of this book at:
http://www.microsoft.com/learning/booksurvey
The survey is short, and we read every one of your comments and ideas. Thanks in
ad-vance for your input!
Stay in touch
Let’s keep the conversation going! We are on Twitter: http://twitter.com/MicrosoftPress.
preparing for the exam
M
icrosoft certification exams are a great way to build your resume and let the world know about your level of expertise. Certification exams validate your on-the-job experience and product knowledge. While there is no substitution for on-the-job experience, preparation through study and hands-on practice can help you prepare for the exam. We recommendthat you round out your exam preparation plan by using a combination of available study
materials and courses. For example, you might use the training kit and another study guide for your “at home” preparation, and take a Microsoft Official Curriculum course for the class-room experience. Choose the combination that you think works best for you.
Note that this training kit is based on publicly available information about the exam and the
Pa r t I
Designing and
Implementing a
Data Warehouse
CHaPtEr 1 Data Warehouse Logical Design 3
c h a p t e r 1
Data Warehouse Logical
Design
Exam objectives in this chapter:
■ Design and Implement a Data Warehouse
■ Design and implement dimensions. ■ Design and implement fact tables.
A
nalyzing data from databases that support line-of-business(LOB) applications is usually not an easy task. The normal
-ized relational schema used for an LOB application can consist of thousands of tables. Naming conventions are frequently not
enforced. Therefore, it is hard to discover where the data you
need for a report is stored. Enterprises frequently have multiple
LOB applications, often working against more than one data-base. For the purposes of analysis, these enterprises need to be
able to merge the data from multiple databases. Data quality is
a common problem as well. In addition, many LOB applications
do not track data over time, though many analyses depend on historical data.
A common solution to these problems is to create a data warehouse (DW). A DW is a centralized data silo for an enterprise that contains merged, cleansed, and historical data. DW schemas are simplified and thus more suitable for generating reports than normal-ized relational schemas. For a DW, you typically use a special type of logical design called a Star schema, or a variant of the Star schema called a Snowflake schema. Tables in a Star or
Snowflake schema are divided into dimension tables (commonly known as dimensions) and fact tables.
Data in a DW usually comes from LOB databases, but it’s a transformed and cleansed
copy of source data. Of course, there is some latency between the moment when data
ap-pears in an LOB database and the moment when it apap-pears in a DW. One common method of addressing this latency involves refreshing the data in a DW as a nightly job. You use the
refreshed data primarily for reports; therefore, the data is mostly read and rarely updated.
i m p o r t a n t
Have you read
page xxxii?
It contains valuable information regarding the skills you need to pass the exam.
Queries often involve reading huge amounts of data and require large scans. To support such queries, it is imperative to use an appropriate physical design for a DW.
DW logical design seems to be simple at first glance. It is definitely much simpler than a normalized relational design. However, despite the simplicity, you can still encounter some advanced problems. In this chapter, you will learn how to design a DW and how to solve some of the common advanced design problems. You will explore Star and Snowflake schemas, di-mensions, and fact tables. You will also learn how to track the source and time for data coming into a DW through auditing—or, in DW terminology, lineage information.
Lessons in this chapter:
■ Lesson 1: Introducing Star and Snowflake Schemas
■ Lesson 2: Designing Dimensions
■ Lesson 3: Designing Fact Tables
before you begin
To complete this chapter, you must have:
■ An understanding of normalized relational schemas.
■ Experience working with Microsoft SQL Server 2012 Management Studio.
■ A working knowledge of the Transact-SQL language.
■ The AdventureWorks2012 and AdventureWorksDW2012 sample databases installed.
Lesson 1: Introducing Star and Snowflake Schemas
Before you design a data warehouse, you need to understand some common design patterns
used for a DW, namely the Star and Snowflake schemas. These schemas evolved in the 1980s. In particular, the Star schema is currently so widely used that it has become a kind of informal
standard for all types of business intelligence (BI) applications.
after this lesson, you will be able to:
■ Understand why a normalized schema causes reporting problems. ■ Understand the Star schema.
■ Understand the Snowflake schema.
■ Determine granularity and auditing needs.
reporting problems with a Normalized Schema
This lesson starts with normalized relational schema. Let’s assume that you have to create a business report from a relational schema in the AdventureWorks2012 sample database. The
report should include the sales amount for Internet sales in different countries over multiple
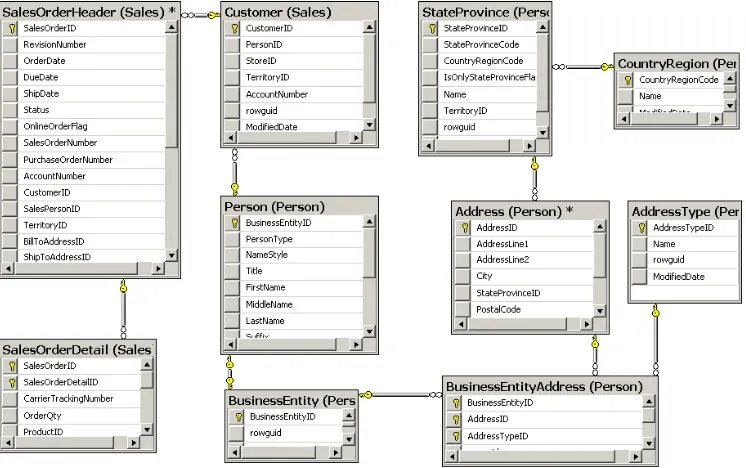
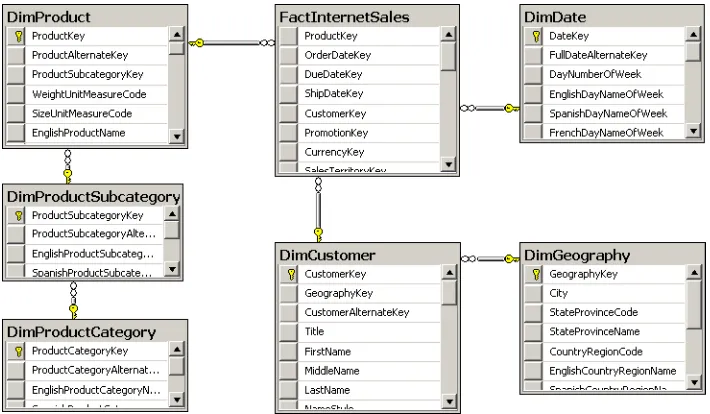
years. The task (or even challenge) is to find out which tables and columns you would need to create the report. You start by investigating which tables store the data you need, as shown in Figure 1-1, which was created with the diagramming utility in SQL Server Management Studio
(SSMS).
figure 1-1 A diagram of tables you would need for a simple sales report.
Even for this relatively simple report, you would end up with 10 tables. You need the sales tables and the tables containing information about customers. The AdventureWorks2012 database schema is highly normalized; it’s intended as an example schema to support LOB applications. Although such a schema works extremely well for LOB applications, it can cause problems when used as the source for reports, as you’ll see in the rest of this section.
Normalization is a process in which you define entities in such a way that a single table represents exactly one entity. The goal is to have a complete and non-redundant schema. Every piece of information must be stored exactly once. This way, you can enforce data
integ-rity. You have a place for every piece of data, and because each data item is stored only once,
you do not have consistency problems. However, after a proper normalization, you typically wind up with many tables. In a database that supports an LOB application for an enterprise,
Finding the appropriate tables and columns you need for a report can be painful in a normalized database simply because of the number of tables involved. Add to this the fact
that nothing forces database developers to maintain good naming conventions in an LOB
database. It’s relatively easy to find the pertinent tables in AdventureWorks2012, because the
tables and columns have meaningful names. But imagine if the database contained tables named Table1, Table2, and so on, and columns named Column1, Column2, and so on. Finding the objects you need for your report would be a nightmare. Tools such as SQL Profiler might help. For example, you could create a test environment, try to insert some data through an LOB application, and have SQL Profiler identify where the data was inserted. A normalized
schema is not very narrative. You cannot easily spot the storage location for data that mea -sures something, such as the sales amount in this example, or the data that gives context to these measures, such as countries and years.
In addition, a query that joins 10 tables, as would be required in reporting sales by coun-tries and years, would not be very fast. The query would also read huge amounts of data— sales over multiple years—and thus would interfere with the regular transactional work of
inserting and updating the data.
Another problem in this example is the fact that there is no explicit lookup table for dates. You have to extract years from date or date/time columns in sales tables, such as OrderDate
from the SalesOrderHeader table in this example. Extracting years from a date column is not
such a big deal; however, the first question is, does the LOB database store data for multiple years? In many cases, LOB databases are purged after each new fiscal year starts. Even if you have all of the historical data for the sales transactions, you might have a problem showing the historical data correctly. For example, you might have only the latest customer address, which might prevent you from calculating historical sales by country correctly.
The AdventureWorks2012 sample database stores all data in a single database. However, in an enterprise, you might have multiple LOB applications, each of which might store data in its own database. You might also have part of the sales data in one database and part in another. And you could have customer data in both databases, without a common identification. In such cases, you face the problems of how to merge all this data and how to identify which
customer from one database is actually the same as a customer from another database.
Finally, data quality could be low. The old rule, “garbage in garbage out,” applies to analy-ses as well. Parts of the data could be missing; other parts could be wrong. Even with good
data, you could still have different representations of the same data in different databases.
For example, gender in one database could be represented with the letters F and M, and in another database with the numbers 1 and 2.
The problems listed in this section are indicative of the problems that led designers to cre
Star Schema
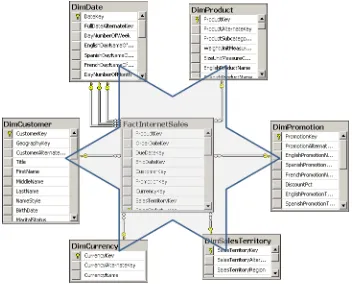
Often, a picture is worth more than a thousand words. Figure 1-2 shows a Star schema, a diagram created in SSMS from a subset of the tables in the AdventureWorksDW2012 sample database.
In Figure 1-2, you can easily spot how the Star schema got its name—it resembles
a star. There is a single central table, called a fact table, surrounded by multiple tables called dimensions. One Star schema covers one business area. In this case, the schema
covers Internet sales. An enterprise data warehouse covers multiple business areas and consists of multiple Star (and/or Snowflake) schemas.
figure 1-2 A Star schema example.
The fact table is connected to all the dimensions with foreign keys. Usually, all foreign keys taken together uniquely identify each row in the fact table, and thus collectively form a unique
key, so you can use all the foreign keys as a composite primary key of the fact table. You can
also add a simpler key. The fact table is on the “many” side of its relationships with the dimen-sions. If you were to form a proposition from a row in a fact table, you might express it with a sentence such as, “Customer A purchased product B on date C in quantity D for amount E.” This proposition is a fact; this is how the fact table got its name.
Key
The Star schema evolved from a conceptual model of a cube. You can imagine all sales
as a big box. When you search for a problem in sales data, you use a divide-and-conquer technique: slicing the cube over different categories of customers, products, or time. In other words, you slice the cube over its dimensions. Therefore, customers, products, and time
represent the three dimensions in the conceptual model of the sales cube. Dimension tables (dimensions) got their name from this conceptual model. In a logical model of a Star schema,
you can represent more than three dimensions. Therefore, a Star schema represents a
multi-dimensional hypercube.
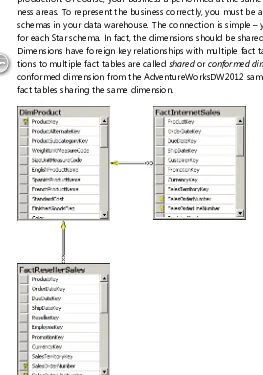
As you already know, a data warehouse consists of multiple Star schemas. From a business perspective, these Star schemas are connected. For example, you have the same customers in sales as in accounting. You deal with many of the same products in sales, inventory, and
production. Of course, your business is performed at the same time over all the different busi -ness areas. To represent the busi-ness correctly, you must be able to connect the multiple Star
schemas in your data warehouse. The connection is simple – you use the same dimensions
for each Star schema. In fact, the dimensions should be shared among multiple Star schemas.
Dimensions have foreign key relationships with multiple fact tables. Dimensions with
connec-tions to multiple fact tables are called shared or conformeddimensions. Figure 1-3 shows a
conformed dimension from the AdventureWorksDW2012 sample database with two different fact tables sharing the same dimension.
In the past, there was a big debate over whether to use shared or private dimensions. Pri-vate dimensions are dimensions that pertain to only a single Star schema. However, it is quite simple to design shared dimensions; you do not gain much from the design-time perspective by using private dimensions. In fact, with private dimensions, you lose the connections be-tween the different fact tables, so you cannot compare the data in different fact tables over the same dimensions. For example, you could not compare sales and accounting data for the
same customer if the sales and accounting fact tables didn’t share the same customer dimen -sion. Therefore, unless you are creating a small proof-of-concept (POC) project that covers
only a single business area where you do not care about connections with different business areas, you should always opt for shared dimensions.
A data warehouse is often the source for specialized analytical database management
sys-tems, such as SQL Server Analysis Services (SSAS). SSAS is a system that performs specialized
analyses by drilling down and is used for analyses that are based on the conceptual model
of a cube. Systems such as SSAS focus on a single task and fast analyses, and they’re consid
-erably more optimized for this task than general systems such as SQL Server. SSAS enables
analysis in real time, a process called online analytical processing (OLAP). However, to get such
performance, you have to pay a price. SSAS is out of the scope of this book, but you have to
know the limitations of SSAS to prepare a data warehouse in a way that is useful for SSAS.
One thing to remember is that in an SSAS database, you can use shared dimensions only. This
is just one more reason why you should prefer shared to private dimensions.
Snowflake Schema
Figure 1-4 shows a more detailed view of the DimDate dimension from the AdventureWorks-DW2012 sample database.
The highlighted attributes show that the dimension is denormalized. It is not in third normal
form. In third normal form, all non-key columns should nontransitively depend on the key. A
different way to say this is that there should be no functional dependency between non-key columns. You should be able to retrieve the value of a non-key column only if you know the key. However, in the DimDate dimension, if you know the month, you obviously know the calendar quarter, and if you know the calendar quarter, you know the calendar year.
figure 1-4 The DimDate denormalized dimension.
figure 1-5 The DimProduct normalized dimension.
The DimProduct dimension is not denormalized. The DimProduct table does not contain
the subcategory name, only the ProductSubcategoryKey value for the foreign key to the DimProductSubcategory lookup table. Similarly, the DimProductSubcategory table does not
contain a category name; it just holds the foreign key ProductCategoryKey from the Dim-ProductCategory table. This design is typical of an LOB database schema.
In this configuration, a star starts to resemble a snowflake. Therefore, a Star schema with nor-malized dimensions is called a Snowflake schema.
In most long-term projects, you should design Star schemas. Because the Star schema is simpler than a Snowflake schema, it is also easier to maintain. Queries on a Star schema are simpler and faster than queries on a Snowflake schema, because they involve fewer joins. The
Snowflake schema is more appropriate for short POC projects, because it is closer to an LOB normalized relational schema and thus requires less work to build.
exam tip
If you do not use OLap cubes and your reports query your data warehouse directly, then using a Star instead of a Snowflake schema might speed up the reports, because your reporting queries involve fewer joins.
In some cases, you can also employ a hybrid approach, using a Snowflake schema only for the first level of a dimension lookup table. In this type of approach, there are no additional levels of lookup tables; the first-level lookup table is denormalized. Figure 1-6 shows such a partially denormalized schema.
figure 1-6 Partially denormalized dimensions.
In Figure 1-6, the DimCustomer and DimReseller dimensions are partially normalized. The dimensions now contain only the GeographyKey foreign key. However, the DimGeography table is denormalized. There is no additional lookup table even though a city is in a region and a region is in a country. A hybrid design such as this means that geography data is
when multiple dimensions share the same attributes. In other cases, you should use the sim-pler Star schema. To repeat: you should use a Snowflake schema only for quick POC projects.
quick check
■ how do you connect multiple Star schemas in a DW?
quick check answer
■ You connect multiple Star schemas through shared dimensions.
Granularity Level
The number of dimensions connected with a fact table defines the level of granularity of
analysis you can get. For example, if no products dimension is connected to a sales fact table, you cannot get a report at the product level—you could get a report for sales for all products
only. This kind of granularity is also called the dimensionality of a Star schema.
But there is another kind of granularity, which lets you know what level of information
a dimension foreign key represents in a fact table. Different fact tables can have different granularity in a connection to the same dimension. This is very typical in budgeting and plan
-ning scenarios. For example, you do not plan that customer A will come on date B to store C and buy product D for amount E. Instead, you plan on a higher level—you might plan to sell
amount E of products C in quarter B in all stores in that region to all customers in that region.
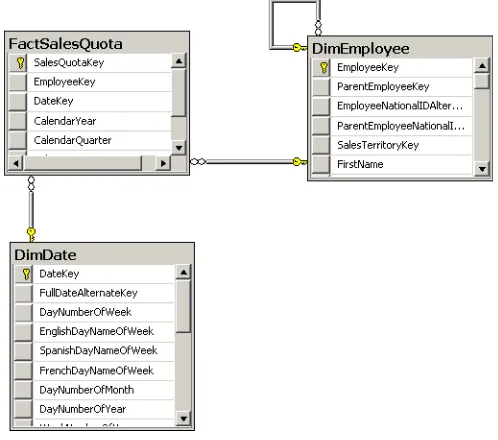
Figure 1-7 shows an example of a fact table that uses a higher level of granularity than the
fact tables introduced so far.
In the AdventureWorksDW2012 database, the FactSalesQuota table is the fact table with planning data. However, plans are made for employees at the per-quarter level only. The
plan is for all customers, all products, and so on, because this Star schema uses only the
DimDate and DimEmployee dimensions. In addition, planning occurs at the quarterly level.
By investigating the content, you could see that all plans for a quarter are bound to the first day of a quarter. You would not need to use the DateKey; you could have only CalendarYear
and CalendarQuarter columns in the FactSalesQuota fact table. You could still perform joins to DimDate by using these two columns—they are both present in the DimDate table as
well. However, if you want to have a foreign key to the DimDate dimension, you do need the
DateKey. A foreign key must refer to unique values on the “one” side of the relationship. The
combination of CalendarYear and CalendarQuarter is, of course, not unique in the DimDate
figure 1-7 A fact table with a higher level of granularity.
auditing and Lineage
In addition to tables for reports, a data warehouse may also include auditing tables. For every
update, you should audit who made the update, when it was made, and how many rows were transferred to each dimension and fact table in your DW. If you also audit how much time was
needed for each load, you can calculate the performance and take action if it deteriorates.
You store this information in an auditing table or tables. However, you should realize that auditing does not help you unless you analyze the information regularly.
Auditing tables hold batch-level information about regular DW loads, but you might also want or need to have more detailed information. For example, you might want to know where each row in a dimension and/or fact table came from and when it was added. In such
cases, you must add appropriate columns to the dimension and fact tables. Such detailed auditing information is also called lineage in DW terminology. To collect either auditing or
lineage information, you need to modify the extract-transform-load (ETL) process you use for
DW loads appropriately.
P r aC t I C E
reviewing the adventureWorksDW2012 internet
sales schema
The AdventureWorksDW2012 sample database is a good example of a data warehouse. It
has all the elements needed to allow you to see examples of various types of dimensional
modeling.
E x E r C I s E 1 review the adventureWorksDW2012 Database Schema
In this exercise, you review the database schema.
1. Start SSMS and connect to your instance of SQL Server. Expand the Databases folder and then the AdventureWorksDW2012 database.
2. Right-click the Database Diagrams folder and select the New Database Diagram op-tion. If no diagrams were ever created in this database, you will see a message box
informing you that the database has no support objects for diagramming. If that mes -sage appears, click Yes to create the support objects.
3. From the Add Table list, select the following tables (click each table and then click the Add button):
■ DimCustomer
■ DimDate
■ DimGeography
■ DimProduct
■ DimProductCategory
■ DimProductSubcategory
■ FactInternetSales
figure 1-8 The AdventureWorksDW2012 Internet Sales Schema.
4. Thoroughly analyze the tables, columns, and relationships.
5. Save the diagram with the name practice_01_01_internetsales.
E x E r C I s E 2 analyze the Diagram
Review the AdventureWorksDW2012 schema to note the following facts:
■ The DimDate dimension has no additional lookup tables associated with it and
therefore uses the Star schema.
■ The DimProduct table is snowflaked; it uses the DimProductSubcategory lookup table, which further uses the DimProductCategory lookup table.
■ The DimCustomer dimension uses a hybrid schema—the first level of the Snowflake
schema only through the DimGeography lookup table. The DimGeography table is
denormalized; it does not have a relationship with any other lookup table.
■ There are no specific columns for lineage information in any of the tables.
Close the diagram.
Note cOntinuing With practices
Lesson Summary
■ The Star schema is the most common design for a DW.
■ The Snowflake schema is more appropriate for POC projects.
■ You should also determine the granularity of fact tables, as well as auditing and lineage
needs.
Lesson review
Answer the following questions to test your knowledge of the information in this lesson. You can find the answers to these questions and explanations of why each answer choice is correct or incorrect in the “Answers” section at the end of this chapter.
1. Reporting from a Star schema is simpler than reporting from a normalized online transactional processing (OLTP) schema. What are the reasons for wanting simpler reporting? (Choose all that apply.)
a. A Star schema typically has fewer tables than a normalized schema. Therefore, queries are simpler because they require fewer joins.
B. A Star schema has better support for numeric data types than a normalized
rela-tional schema; therefore, it is easier to create aggregates.
C. There are specific Transact-SQL expressions that deal with Star schemas.
D. A Star schema is standardized and narrative; you can find the information you
need for a report quickly.
2. You are creating a quick POC project. Which schema is the most suitable for this kind of a project?
a. Star schema
B. Normalized schema
C. Snowflake schema
D. XML schema
3. A Star schema has two types of tables. What are those two types? (Choose all that
apply.)
a. Lookup tables
B. Dimensions C. Measures
Lesson 2: Designing Dimensions
Star and Snowflake schemas are the de facto standard. However, the standard does not end with schema shapes. Dimension and fact table columns are part of this informal standard as well and are introduced in this lesson, along with natural hierarchies, which are especially use-ful as natural drill-down paths for analyses. Finally, the lesson discusses a common problem with handling dimension changes over time.
after this lesson, you will be able to:
■ Define dimension column types.
■ Use natural hierarchies.
■ Understand and resolve the slowly changing dimensions problem.
Estimated lesson time: 40 minutes
Dimension Column types
Dimensions give context to measures. Typical analysis includes pivot tables and pivot graphs.
These pivot on one or more dimension columns used for analysis—these columns are called attributes in DW and OLAP terminology. The naming convention in DW/OLAP terminology
is a little odd; in a relational model, every column represents an attribute of an entity. Don’t
worry too much about the correctness of naming in DW/OLAP terminology. The important point here is for you to understand what the word “attribute” means in a DW/OLAP context.
Pivoting makes no sense if an attribute’s values are continuous, or if an attribute has too
many distinct values. Imagine how a pivot table would look if it had 1,000 columns, or how a pivot graph would look with 1,000 bars. For pivoting, discrete attributes with a small number of distinct values is most appropriate. A bar chart with more than 10 bars becomes difficult to comprehend. Continuous columns or columns with unique values, such as keys, are not
appropriate for analyses.
If you have a continuous column and you would like to use it in analyses as a pivoting attribute, you should discretize it. Discretizing means grouping or binning values to a few
discrete groups. If you are using OLAP cubes, SSAS can help you. SSAS can discretize
continu-ous attributes. However, automatic discretization is usually worse than discretization from a business perspective. Age and income are typical attributes that should be discretized from a business perspective. One year makes a big difference when you are 15 years old, and much less when you are 55 years old. When you discretize age, you should use narrower ranges for younger people and wider ranges for older people.
Key
importaNt autOmatic DiscretizatiOn
Use automatic discretization for pOC projects only. For long-term projects, always dis-cretize from a business perspective.
Columns with unique values identify rows. These columns are keys. In a data warehouse,
you need keys just like you need them in an LOB database. Keys uniquely identify entities. Therefore, keys are the second type of columns in a dimension.
After you identify a customer, you do not refer to that customer with the key value. Having only keys in a report does not make the report very readable. People refer to entities by using their names. In a DW dimension, you also need one or more columns that you use for naming
an entity.
A customer typically has an address, a phone number, and an email address. You do not
analyze data on these columns. You do not need them for pivoting. However, you often need information such as the customer’s address on a report. If that data is not present in a DW, you will need to get it from an LOB database, probably with a distributed query. It is much simpler to store this data in your data warehouse. In addition, queries that use this data
per-form better, because the queries do not have to include data from LOB databases. Columns used in reports as labels only, not for pivoting, are called member properties.
You can have naming and member property columns in multiple languages in your dimen -sion tables, providing the translation for each language you need to support. SSAS can use
your translations automatically. For reports from a data warehouse, you need to manually select columns with appropriate language translation.
In addition to the types of dimension columns already defined for identifying, naming,
pivoting, and labeling on a report, you can have columns for lineage information, as you saw
in the previous lesson. There is an important difference between lineage and other columns: lineage columns are never exposed to end users and are never shown on end users’ reports.
To summarize, a dimension may contain the following types of columns:
■ keys Used to identify entities
■ name columns Used for human names of entities ■ attributes Used for pivoting in analyses
■ member properties Used for labels in a report
■ Lineage columns Used for auditing, and never exposed to end users
Key
hierarchies
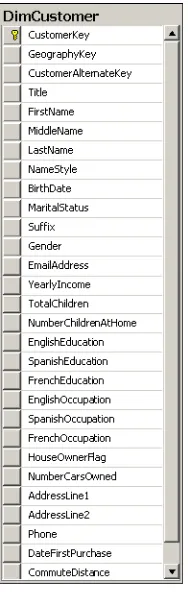
Figure 1-9 shows the DimCustomer dimension of the AdventureWorksDW2012 sample
database.
figure 1-9 The DimCustomer dimension.
In the figure, the following columns are attributes (columns used for pivoting):
■ BirthDate (after calculating age and discretizing the age)
■ MaritalStatus
■ Gender
■ YearlyIncome (after discretizing)
■ TotalChildren
■ NumberChildrenAtHome
■ EnglishEducation (other education columns are for translations) ■ EnglishOccupation (other occupation columns are for translations) ■ HouseOwnerFlag
All these attributes are unrelated. Pivoting on MaritalStatus, for example, is unrelated to pivoting on YearlyIncome. None of these columns have any functional dependency between them, and there is no natural drill-down path through these attributes. Now look at the Dim-Date columns, as shown in Figure 1-10.
figure 1-10 The DimDate dimension.
Some attributes of the DimDateedimension include the following (not in the order shown in the figure):
■ FullDateAlternateKey (denotes a date in date format) ■ EnglishMonthName
■ CalendarQuarter
■ CalendarSemester
■ CalendarYear
You will immediately notice that these attributes are connected. There is a functional
de-pendency among them, so they break third normal form. They form a hierarchy. Hierarchies
are particularly useful for pivoting and OLAP analyses—they provide a natural drill-down path. You perform divide-and-conquer analyses through hierarchies.
Hierarchies have levels. When drilling down, you move from a parent level to a child level.
For example, a calendar drill-down path in the DimDate dimension goes through the follow-ing levels: CalendarYear➝ CalendarSemester➝CalendarQuarter➝EnglishMonthName➝ FullDateAlternateKey.