CHAPTER III
RESEARCH METHODOLOGY
This chapter presents the method used in conducting the research. It
contains the research problems and the research design. The research design
includes the participants, the data collection and the data analysis. The last section
involves the concluding remarks of this chapter.
3.1 Research Problems
This research was purposed to find out the information related to the
implementation of Participation Point System in a senior high school English
teaching. Hence, this research focused to investigate:
1. In what ways is the Participation Point System implemented in a senior
high school English teaching?
2. What are the benefits and difficulties of implementing the PPS in a senior
high school English teaching?
3. What are the high school students‟ responses to the implementation of the PPS in a senior high school English teaching?
3.2 Research Design
This study was a qualitative research which consists of interpretations and
descriptions rather than numbers. In line with Dörnyei (2007, p. 24), the data in
qualitative research are non-numerical and then the data would be analyzed by
non-statistical methods. This research included open-ended results from the data
collection procedures. It involved a mixture of documents from field notes,
transcripts and recordings.
This research focused on understanding, describing and clarifying the
implementation of Participation Point System. It is in accordance with Dörnyei
(2007, p. 126), he stated that qualitative research emphases on understanding,
element in this qualitative research was flexible, ongoing, yet purposive. And it
required a detailed and vivid analysis to reveal the investigated data.
The design of this qualitative research was a case study design. According
to Stake (1995, p.xi) as cited in Dörnyei (2007, p.151), the case study is “the study of the particularity and complexity of a single case”. In addition, Jack (2008)
stated that “the qualitative case study is an approach to research that facilitates exploration of a phenomenon within its context using a variety of data sources”. The type of case study which was used in this research is the intrinsic case study.
In this case study, a variety of data collection such as observation, interview, and
also questionnaires would be combined in order to enrich the data. Thus, this case
study was a suitable method to gather and organize the data to get the
understanding of the Participation Point System implementation in a detailed
description.
3.2.1 Participants
The research was conducted in one of high schools in Bandung. The participants
were the 11th graders. The class of the participants consisted of 35 students.
In selecting the suitable school, there were two main reasons: the study
was allowed by the school regulations and the English teacher agreed to use the
Participation Point System in the English teaching.
3.2.2 Data Collection
3.2.2.1Instruments
The data were taken from the learning activities of the 11th grade of high school.
To get the data, there were several instruments employed in this study. The
instruments were observation, interview, and questionnaire.
3.2.2.1.1 Observation
Observation was used to find out the information in the implementation,
the benefits and the difficulties of PPS in a high school English teaching, and also
classroom were observed and identified. There were five meetings for the
observation. During this observation, the participant was the observer herself.
In doing the try out, the pre-observation was executed. The observer
helped the teacher in preparing the media needed for the PPS implementation in
the teaching process. Meanwhile, the observations were videotaped in order to
give additional information for the missed ones.
Some field-notes were taken from the observation sheet. The observation
sheet was developed based on all the research questions. It included two aspects,
such as the PPS implementation and students‟ response to the PPS implementation. Since the benefits and difficulties of PPS implementation might
have been unpredictable, it was noted with other things found during the
observations.
3.2.2.1.2 Interview
Interviews were used to explore the teacher‟s point of view and the students‟ responses to the implementation of PPS in the senior high school English
teaching. The interviews were also aimed to identify the benefits and difficulties
which were faced by the teacher and the students. The interviews were conducted
to the teacher and the students of the English class after the PPS has been
implemented. The interviews were taped and transcribed. Those were conducted
informally, in order to make the interviewees feel comfortable in sharing their
experience, feeling and view of the PPS that had been implemented.
As cited in Dörnyei (2007, p. 134), Miller and Crabtee (1999) said that
the interview involves etiquettes, participant role expectations, turn-takings, and
shared cultural knowledge. There are several types of interview, such as focus
group and typical qualitative interview. Nevertheless, in this research the typical
qualitative interviews were used. The typical qualitative interviews include
one-to-one conversation between the interviewer and interviewee. Furthermore, for the
typical qualitative interviews, the semi-structured interviews were used. In the
semi-structured interviews, even though there were prepared questions to be
3.2.2.1.3 Questionnaire
Questionnaire was used to investigate the students‟ response toward the implementation of the PPS in a senior high school English teaching. The
questionnaires consisted of close-ended and open-ended questions. The
questionnaires were expected to help the researcher in exploring more information
related to this study.
The types of questionnaires which were deployed in this research were
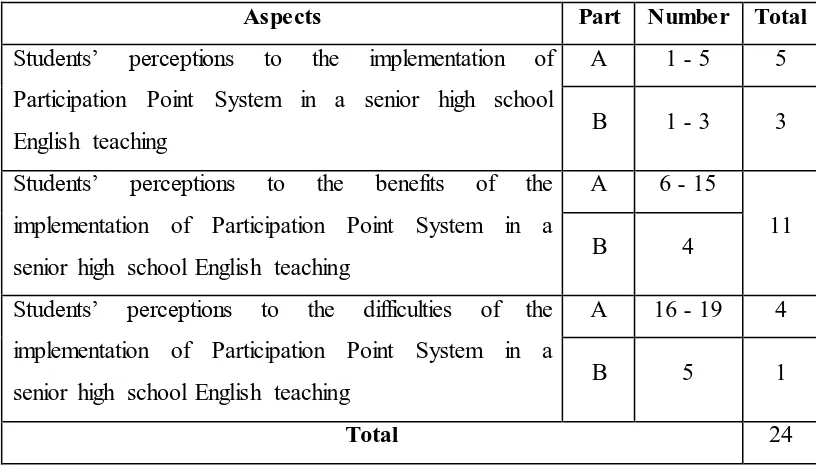
close-ended and open-ended questionnaires. The close-ended questionnaires
consisted of at four choices for each participant to answer the questions (Part A).
Students‟ perceptions to the implementation of Participation Point System in a senior high school
English teaching
A 1 - 5 5
B 1 - 3 3
Students‟ perceptions to the benefits of the implementation of Participation Point System in a
senior high school English teaching
A 6 - 15
11
B 4
Students‟ perceptions to the difficulties of the implementation of Participation Point System in a
senior high school English teaching
A 16 - 19 4
B 5 1
In answering the close-ended questionnaires, each participant should
choose „strongly agree‟, „agree‟, „disagree‟ or „strongly disagree‟ to each question provided. Since the questionnaires were paper questionnaires, the data were
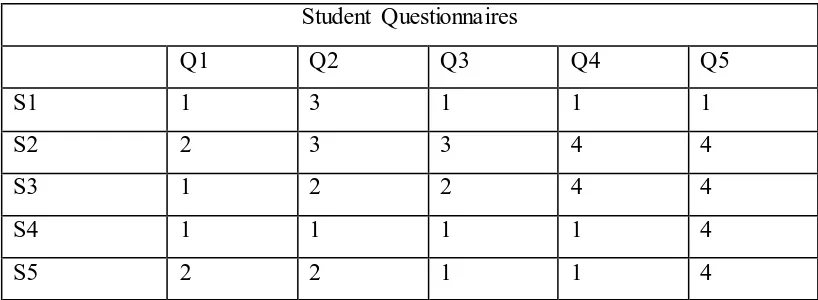
transferred manually into a spreadsheet. The spreadsheet might look like the
framework below:
Table 3.2 The Questionnaire Response Coding
Response Category Code
Strongly Agree 1
Agree 2
Disagree 3
Strongly Disagree 4
Table 3.3 The Example of Coding Spreadsheet
Student Questionnaires
Q1 Q2 Q3 Q4 Q5
S1 1 3 1 1 1
S2 2 3 3 4 4
S3 1 2 2 4 4
S4 1 1 1 1 4
S5 2 2 1 1 4
In this example, it could be seen that Student 1 (S1) strongly agreed on
questions 1 (Q1), 3 (Q3), 4 (Q4), 5 (Q5) and disagreed on question 2. Student 2
agreed on questions 1 (Q1), disagreed on question 2 (Q2) and 3 (Q3), and strongly
disagreed on question 4 (Q4) and 5 (Q5). The same procedure was applied to the
After all the data of the questionnaires transferred into the spreadsheet, to
get the accurate findings the data were checked once again. Then, the tables or
graph were set to display the data. The example as follows:
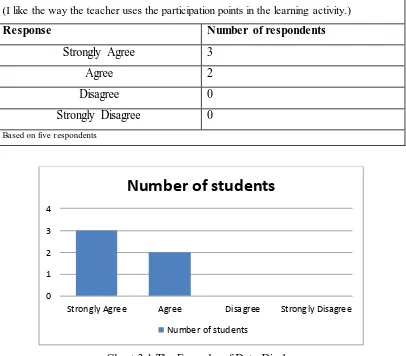
Table 3.4 The Example of Data Display (Table)
Question 1:
Saya menyukai cara guru mengajar dengan menggunakan poin partisipasi di kelas.
(I like the way the teacher uses the participation points in the learning activity.)
Response Number of respondents
Strongly Agree 3
Agree 2
Disagree 0
Strongly Disagree 0
Based on five r espondents
Chart 3.1 The Example of Data Display
In this example, it could be identified that how many students selected
each response were calculated. For the question 1 (Q1), there are three students
who strongly agreed and two students who agreed. The same procedure was
applied to the other questions.
0 1 2 3 4
Strongly Agree Agree Disagree Strongly Disagree
Number of students
3.2.2.2Data Collection Procedures
In collecting the data, researcher employs several procedural steps as follows:
a. Exploring some principles and theories related to the research: student
engagement, learning motivation, and participation point system.
b. Observing the implementation of Participation Point System, first to fifth
meeting, where the researcher took part in investigating the learning
situation and activities.
c. Deploying the questionnaires to the students after the fifth meeting.
d. Interviewing the teachers
e. Organizing, interpreting and analyzing the data obtained
f. Discussing the interpreted data
g. Constructing conclusion
3.2.3 Data Analysis
After the data have been collected, the procedure in analyzing the data includes
several steps as follows.
3.2.3.1Observation Analysis
First, the data from the observation field-notes were analyzed. The analysis was
based on the aspects related to the research questions. Thus, the information
related to the implementation of the Participation Point System in a senior high
school English teaching, the benefits and difficulties of using the method, and the
high school students‟ responses to the method were identified.
Then, the recordings of observations were transformed into a textual form.
The observation videotapes were interpreted to add some information if there
were any missed information in the field-notes.
The next process of analyzing the data was identifying and grouping the
transcribed data. It involved coding or labeling process for the data of observation.
The aim of a qualitative coding technique is to simplify or reduce the data
whereas underlining particular features to connect the data to the broader concepts
transcripts, and also writing down the thoughts of the data into some notes or
memos. In this process, the data were also interpreted and discussed. The
discussion was about what information the data was telling and what the meaning
of the information was in terms of the research questions.
The final process of the observation analysis was drawing conclusions. To
make the conclusions, all of the interpreted data were perceived into the generated
patterns. After that, the main outline that had been acquired was elaborated.
3.2.3.2Interview Analysis
To analyze the data of the interview, the transcribed data were identified. Just like
the data of the observation, the data of the interview were analyzed by reading and
reflecting the transcript. The data were also reduced to focus on the investigated
aspects. Then, the data were interpreted and discussed before drawing conclusions
based on the research questions.
3.2.3.3Questionnaire Analysis
The data of the questionnaires were divided into two parts: Part A and Part B. Part
A consisted of the close-ended questions and Part B consisted of the open-ended
questions. The data from the close-ended questions were calculated to get the
percentage of how many students who strongly agreed, agreed, disagreed, and
strongly disagreed to the statements in the questionnaire. To find the percentage of
each aspect, the formula used as follows:
To interpret each percentage, the framework below was used:
Table 3.5 The Framework of the Percentage Interpretation
Percentage Finding
00.00% None
00.15% - 24.99% A few students
25.00% - 49.99% Nearly half of the students
50.00% Half of the students
50.01% - 74.99% More than half of the students
75.00% - 99.99% Nearly all of the students
100% All of the students
On the other hand, the data of the open-ended questions were classified
and labeled into the similar answers among the students. After the data had been
classified and labeled, the analysis continued into discussion and conclusion.
3.3 Concluding Remarks
This chapter has explained the research problems and the research design which
includes the participants, the data collection and the data analysis. The following