LIDAR PROCESSING FOR DEFINING SINKHOLE CHARACTERISTICS UNDER
DENSE FOREST COVER: A CASE STUDY IN THE DINARIC MOUNTAINS
M. Kobal a, I. Bertoncelj b, F. Pirotti c, *, L. Kutnar a
a Slovenian Forestry Institute, Slovenia - (milan.kobal,lado.kutnar)@ gozdis.si b National Institute of Biology, Slovenia- [email protected] c CIRGEO Interdepartmental Research Center of Geomatics, University of Padova, Italy -
Commission VII
KEY WORDS: Sinkholes, Dolines, Geomorphology, Forestry, Dense canopy cover, Lidar
ABSTRACT:
The traditional approach for defining sinkholes characteristics is based on topographic maps and air photographs with derived digital terrain models. This method is sometimes not accurate, requiring costly, time consuming and potentially dangerous fieldwork. Investigations have shown that airborne scanning laser data (lidar) is useful in detection of karst depressions due to the high density of ground points that can be obtained. This is especially important under dense forest canopy, where classical photogrammetric methods do not allow ground points to be measured. The objective of this work was to map and determine geomorphometric characteristics of a large number of sinkholes located in a diverse karst terrain under a dense forest tree-canopy using lidar data. We tested an algorithm described in previous literature which uses only information from the DTM. It is based on water flow simulations on a surface (DTM) and incorporates four phases: (i) watershed delineation, (ii) confining of sinkholes, (iii) confining of higher rank sinkholes and (iv) extraction of non-karstic sinkholes. Sinkholes were confined by effluent level with cells below the effluent level designated as part of the sinkhole. In the third step sinkholes were ranked according to their location and size – first rank sinkholes are the smallest and are located within a larger sinkhole.
Results are that the sinkhole fraction of 1st, 2nd, 3rd, 4th and 5th rank in the study area was 3.25%, 4.26%, 5.68%, 3.65% and 3.14%, respectively. Sinkhole distribution shows a peculiar directionality in their spatial distribution, which seems to be significantly towards a northwest – southeast direction. It was not possible to compare results with ground-truth data due to very low accessibility, nevertheless a statistical and visual assessment of the results shows that lidar is a very effective technique to model sinkholes under dense canopy.
1. INTRODUCTION
Sinkholes were the first karst landforms that were the subject of morphometric analysis (Basso et al., 2013). Early studies, e.g., (Lavalle, 1967; Williams, 1972, 1971), showed a great variety of morphometric parameters existed among sinkholes, depending mainly upon the different karst development and genesis of sinkholes. Karst landscape typically has large numbers of sinkholes, which represent a hazard in urban areas (Witze, 2013), but also a limit to accessibility in forest areas which might be used for timber production. Corrosion, collapse, and climatic influence, as well as a combination of such factors explain the genesis of different dolines, with corrosion has the most essential process in all models (Čar, 2001; Gams, 1974).
Classical topography and photo interpretation were typically used to interpret karst terrains (Gutiérrez-Santolalla et al., 2005; Ogden, 1988). Digital terrain models (DTMs), derived from photogrammetric methods, have been used as support when available. In this case we refer to DTMs in the sense of height information of the bare ground plane as in (Newby, 2012). It is quite difficult to have high resolution and significant accuracy in forested karst areas using photogrammetry (Podobnikar et al., 2008); costly and time-consuming fieldwork can provide the necessary data for morphometric studies of karst landforms (Basso et al., 2013).
Studies in the past have tested active and passive remote sensing techniques for detection of karst depressions (Castañeda et al., 2009; de Carvalho et al., 2013). Vegetation obstruction can significantly limit the information related to ground surface. Airborne laser scanning have proven in several studies to be able to penetrate dense forest canopies and display the underlying ground topography (Hofton et al., 2002; Kobler et al., 2007; Weishampel et al., 2011). Due to this unique characteristic, high-density airborne laser scanning data has been used for many applications which get added value from high-resolution topography of the bare ground plane.
In forestry, lidar is widely used due to its capability of returning multiple echoes and thus 3D structure of canopy (Alberti et al., 2013). Accurate DTMs and digital surface models (DSMs) derived from lidar allow also tree-based estimation of heights and volume with allometric relationships (Pirotti, 2010). Full-waveform digitalization of the return pulse has been used for increasing point density by improving echo detection rate (Pirotti, 2011). Lidar is also commonly used in hydrology studies, e.g. (Varhola and Coops, 2013), soil mapping and erosion evaluation, e.g. (Bremer and Sass, 2012). Also in the field of geomorphology, the ability of lidar to model the earth surface is a valued characteristic see (Bell et al., 2009; Höfle and Rutzinger, 2011; Passalacqua et al., 2012; Ticci et al., 2011).
Studies of automatically mapping sinkholes and extracting their characteristics from lidar-based digital elevation models are not numerous in literature. The use of lidar for 3D characterization of sinkholes by the Dead Sea (Filin et al., 2011). Image processing techniques (erosion, fitting and pruning operators) were used by (Rahimi and Calvin Alexander, 1985) to automatically detect sinkholes, getting errors of 21 false positives and 9 false negatives with 97 correctly detected. None of these methods had a study area with dense forest tree-canopy. Tree-canopy decreases the homogeneity of the spatial distribution of the ground hits, depending on canopy density distribution, especially where a high-resolution survey is carried out, because higher frequency of the emitter corresponds to lower energy of laser pulse, thus less penetration capability (Pirotti et al., 2013).
In comparison to traditional field mapping, the method presented hereafter is cheaper, faster, and safer with respect to ground surveys, especially in areas morphologically similar to our study site, i.e. with very low accessibility due to vegetation, irregular ground terrain, steep slopes and the presence of sinkholes in itself. In this paper, we present results of a method for mapping sinkholes and under a dense forest tree-canopy leveraging lidar data to obtain a high-resolution digital terrain model. The focus was on automatically calculating and describing morphometric characteristics of a large number of sinkholes in diverse karst terrain under dense forest tree-canopy using a lidar-derived DTM.
2. MATERIALS
2.1 Study area
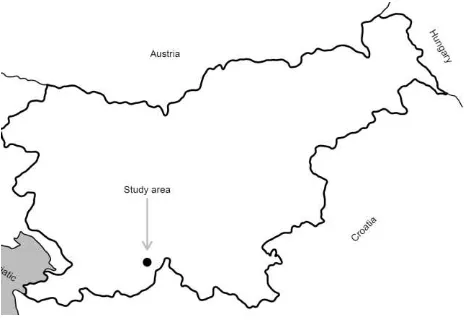
Our study site, Leskova dolina, is in the Dinaric Mountains of southwest Slovenia (center of area approximately located at Longitude = 14.46°, Latitude = 45.62° in WGS84 datum). Figure 1 shows approximately were related to Slovenia. The karst geology on the site is characterized by numerous sinkholes and limestone outcrops, resulting in very diverse micro-topography. Soils are predominantly from limestone parent material, and the soil depth can vary between 0 and 300 cm, depending on the micro topographic position. Precipitation is evenly distributed throughout the year with mean annual precipitation of 2150 mm. Mean temperature is 6.5°C, late spring and early autumn frosts are common.
Figure 1. Study area in south-west Slovenia.
Forest covers 97.6% of the study area with prevalent vegetation community of Dinaric silver fir–European beech forest (Omphalodo-Fagetum s. lat.) with European beech (Fagus sylvatica L.), silver fir (Abies alba Mill.), and Norway spruce (Picea abies (L.) H. Karst.) as the main tree species. Sinkholes shape, size and distribution have significant impact on the forest soil and hydrological characteristics (Vilhar and Simončič, 2012; Vilhar et al., 2010, 2005).
2.2 Lidar dataset
Lidar data was acquired r between 400 and 600 m relative flight height using a Eurocopter EC 120B helicopter and a Riegl LM5600 laser scanner using 180 kHz pulse repetition rate (PRR). Point accuracy, excluding GPS errors, was estimated at 10 cm horizontally and 3 cm vertically. Trajectory and orientation of the helicopter was determined using Novatel OEV/OEM4 GPS recording measurements at 10 Hz frequency and an INS IMU-IIe unit based on Fibre-Optic Gyros. Point density was 30 points·m-2 with an average footprint of 30 cm. Scanning was carried out during the month of October 2009.
Ground classification was done after application of a procedure to remove outlier points. Axellson’s iterative triangulation method (Axelsson, 2000) was used in the process of ground classification. It is important to maximize the number of true positives in the ground class and minimize the number of errors – i.e. false negatives (ground points which are classified as not-ground) and false positives (vegetation points classified as ground). This is a trivial statement, but it is important to have as much detail of the micro-topography as possible, and this requires careful tuning of the parameters of the classifier, depending on the complexity and scale of the ground surface elements to successfully remove forest canopy without significantly affecting topographic details. Meng et al. (2010) provided an interesting critical analysis on this aspect. Ground points were then used to create a DTM in raster format with a cell size of 1 × 1 m for an effective study area of 5212.15 ha.
3. METHOD
3.1 Sinkhole detection and extraction
Sinkholes were detected and defined using the algorithm by (Obu and Podobnikar, 2013) which uses the lidar-derived DTM. The initial step is based on a water flow simulation process. It is defined by four steps: (i) watershed delineation, (ii) confining of sinkholes, (iii) confining of higher rank sinkholes and (iv) extraction of non-karstic sinkholes. The watershed delineation step was based on the technique described by (Jenson and Dominque, 1988) and carried out in ArcMap 10.2. Sinkholes were confined by effluent level with cells below the effluent level designated as part of the sinkhole. In the third step sinkholes were ranked according to their location and size – first rank sinkholes are the smallest and are located within a larger sinkhole (Obu and Podobnikar, 2013). Figure 2 is a graphical presentation of sinkholes of different rank on the surface profile.
In the process, false positives (i.e. false sinkholes) derived from artefacts of the DTM generation process (Burrough and McDonnell, 1998) can be extracted. In literature karst solution sinkholes are described as having more than 2 m deep basins with more than 10 m diameter (Gams, 2003; Habič, 1986;
Kunaver, 1983). Using both criterions, we eliminated non-karstic sinkholes.
Figure 2. Representation of sinkhole rank on a profile of the ground surface (top) with detail (bottom).
3.2 Sinkhole characteristics
To calculate characteristics we converted raster representation of sinkholes to vectors and the following basic morphometric characteristics were extracted and recorded stratified by rank: (i) diameter, (ii) width, (iii) area, (iv) depth, (v) volume and (vi) orientation. The rotating callipers method (Shamos, 1978) was used to delineate minimum bounding box for a set of points thus defining a convex polygon of a sinkhole; the maximum width of a convex polygon was defined as diameter of a sinkhole and minimum width of a convex polygon was defined as width of a sinkhole. Volume was calculated as the sum of differences between the maximum elevation within the sinkhole
and the elevation of each cell of a DTM within a sinkhole. Orientation was calculated as an azimuth of a line, connecting the two farthest points within the sinkhole.
The elongation ratio (Re) was originally developed for drainage systems studies by (Schumm, 1956) and was defined as the ratio between the diameter of a circle with the same area and the diameter of the basin to the maximum basin length. However, in morphometric analysis of sinkholes, elongation ratio Re is the ratio between the major and the minor axis (Gutiérrez-Santolalla et al., 2005; Kemmerly, 1976; Williams, 1972) . According to (Basso et al., 2013), we classify sinkholes into 4 groups regarding the elongation ratio Re: (i) circular and sub-circular (Re ≤ 1.21), (ii) elliptical (1.21 < Re ≤ 1.65), (iii) sub-elliptical (1.65 < Re ≤ 1.8) and (iv) elongated (Re > 1.8). There is no common method of calculation of circularity index, (see (Denizman, 2003; Doctor and Young, 2013). Its is is the ratio between the measured sinkhole area and the area of a circle with the same perimeter thus a measure of the deviation of a polygon from a perfect circle (circularity index of a perfect circle is equal to 1). We calculated circularity index (Eq. 1) as:
2
2
m im
m
A
Circ
A
P
(1)
where Am and Pm are measured area of a sinkhole and measured perimeter of a sinkhole, respectively.
4. RESULTS AND ANALYSIS
A total of 2660 sinkholes were detected within our study area using the lidar-derived DTM with the cell size of 1 × 1 m. Majority (2095) were 1st rank sinkholes (density: 40.16 km-2), followed by 473 sinkholes of 2nd rank (density: 9.07 km-2), 79 sinkholes of 3rd rank (density: 1.52 km-2), 12 sinkholes of 4th rank (density: 0.25 km-2), and one sinkhole of 5th rank (density: 0.02 km-2). The sinkhole fraction of 1st, 2nd, 3rd, 4th and 5th rank in the study area was 3.25%, 4.26%, 5.68%, 3.65% and 3.14%, respectively.
Mean width and length of sinkholes increased with the sinkhole rank from 26.1 m at 1st rank to 367.6 m at 4th rank and from 33.8 m at 1st rank to 576.0 m at 4th rank, respectively. Maximum depth of sinkhole ranged from 39.2 in 1st rank to 48.4 m in 4th rank, while sinkhole in 5th rank reaching depth of 52.8 m. Width of the 5th rank sinkhole was 1317.9 m, length 2418.5 m, area was 131.05 ha and volume of 22,254,840.02 m3. The area of 1st rank sinkholes ranged from 108.2 m2 to 14475.6 m2. Their size distribution roughly resembled a negative exponential form, with 57% of sinkholes below 600 m2, although sinkholes in larger size classes (i.e. above 5000 m2) were relatively abundant.
The elongation ration (Re) and circularity index (Circi) were compared between sinkholes of different ranks using non-parametric Kruskal-Wallis test and multiple comparison test after Kruskal-Wallis (Siegel and Castellan, 1988). Levene's test was used to assess the equality of variances for Re and Circi. The multiple regression routine on log-transformed data of sinkhole area and sinkhole volume (due to high skewness) was used for relating sinkhole area to sinkhole volume grouped by
sinkhole rank. Models were compared using partial F-tests and Akaike’s Information Criterion (AIC).
Figure 3. Elongation ratio Re ; same letter means no difference according to Kruskal-Wallis test.
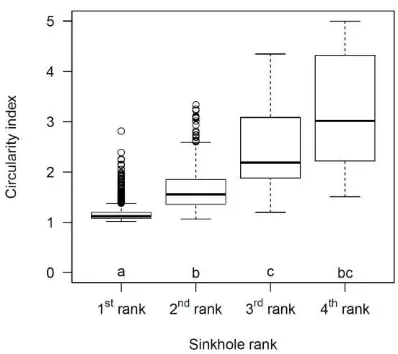
Figure 4. Circularity index boxplots same letter means no difference according to Kruskal-Wallis test
Following the classification of sinkholes according to (Basso et al., 2013) , 39.8% of all sinkholes were circular, 41.1% were elliptical and 13.5% were elongated (Re above 1.8). The shape of sinkholes also varied according to their rank with 1st rank sinkholes being significantly more circular than those of 2nd, 3rd or 4th rank (Figure 3; Kruskal-Wallis χ2 = 466.8; p < 0.001). Similarly, the higher rank sinkholes were significantly less circular according to circularity index (Eq. 1) with a gradual decrease in circularity from 1st to 3rd rank (Figure 4; Kruskal-Wallis χ2 = 1082.9; p < 0.001). Twelve sinkholes of 4th rank had similar values to those of 2nd and 3rd rank (Figure 4).
We found a strong correlation between sinkhole area and sinkhole volume (r = 0.976; p < 0.001). Sinkhole area explained 95.2% of variation in sinkhole volume (AIC = 2036.2). Prediction power was further improved by nested model, in which the effect of sinkhole area on its volume among different sinkhole ranks was considered (AIC = 2001.7). Comparison between nested model and previous model with partial F-tests suggested that the nested model is significantly better (F = 10.7; p < 0.001).
Examination of sinkhole orientations showed a strong directionality i.e. spatial correlation in the north-west / south-east axis (Figure 5). Two peaks of sinkhole orientation are between 10 and 40° of azimuth and a higher one between 130 and 170° (Figure 5). This preferred orientation is also visually evident form the hill-shaded relief on Figure 6.
Figure 5. Frequency distribution of orientations of the detected sinkholes.
Figure 6. Spatial distribution of 1st rank sinkholes over the study area – a directionality towards north-west south-east axis is visually clear.
5. DISCUSSION AND CONCLUSIONS
Knowledge on karst terrain characteristic and sinkholes architecture is important in view of predicted climate change effects in Slovenia (Kutnar and Kobler, 2011). By the climate-change predictions it seems that these forests are the most threatened forest community in Slovenia (Kutnar and Kobler, 2011). Beside their significance in forest-management, the Dinaric fir-beech forests are among the most important production-forests for timber products; their ecological and nature-conservation aspects are also significant. The mitigation of climate-changes impacts on Dinaric fir-beech forests in this sensitive karst area is also associated with the distribution of sinkholes and other karst terrain characteristics, which might have significant impact on frequency and severity of drought events, and on water drainage phenomenon. In all forest management actions, the distribution, orientation, depth, and shape of sinkholes have to be taken into account.
An interesting aspect from this study is the preferred directionality of the sinkholes orientation (Figure 5 and Figure 6). A first interpretation could be an anisotropy in the autocorrelation of the error distribution of the lidar points’ position, sometimes referred to as “striping artefacts” well investigated in (Sofia et al., 2013). This has been discarded for two reasons: (i) this error, when present, is evident in the hill-shade model, and in our case it is not and (ii) the main orientation is neither parallel nor orthogonal to the flight direction. Another aspect which could add an artificial bias to the sinkhole orientation is the geometry of the laser beam – surface interaction (incidence angle), which increases the position error in the component direction of the laser’s projection in the surface. This also cannot be the case as the orientation is not spatially correlated; if it was, we would see a preferred orientation significantly more present in a specific position relative to incidence angle between terrain and lidar beam. Another aspect of this study is that the study area is un-affected by human activities, and therefore suitable to study the karst phenomena without such source of variability.
REFERENCES
Alberti, G., Boscutti, F., Pirotti, F., Bertacco, C., De Simon, G., Sigura, M., Cazorzi, F., Bonfanti, P., 2013. A LiDAR-based approach for a multi-purpose characterization of Alpine forests: an Italian case study. iForest - Biogeosciences and Forestry, 6, 156–168. doi:10.3832/ifor0876-006
Axelsson, P., 2000. DEM Generation from laser scanner data using adaptive TIN models. The International Archives of the Photogrammetry, Remote Sensing and Spatial Information Sciences, XXXIII, 110–117.
Basso, A., Bruno, E., Parise, M., Pepe, M., 2013. Morphometric analysis of sinkholes in a karst coastal area of southern Apulia (Italy). Environmental Earth Sciences, 70, 2545– 2559. doi:10.1007/s12665-013-2297-z
Bell, R., Höfle, B., Chlaupek, A., 2009. Potential of terrestrial and airborne LiDAR in geomorphology - a
geomorphological perspective,. Geophysical Research Abstracts, 11.
Bremer, M., Sass, O., 2012. Combining airborne and terrestrial laser scanning for quantifying erosion and deposition by a debris flow event. Geomorphology, 138, 49–60. doi:10.1016/j.geomorph.2011.08.024
Burrough, P.A., McDonnell, R.A., 1998. Principles of Geographical Information systems. Oxford University press, New York.
Čar, J., 2001. Structural bases for shaping of dolines. Acta Carsologica, 30, 239–256.
Castañeda, C., Gutiérrez, F., Manunta, M., Galve, J.P., 2009. DInSAR measurements of ground deformation by sinkholes, mining subsidence, and landslides, Ebro River, Spain. Earth Surface Processes and Landforms, 34, 1562–1574. doi:10.1002/esp.1848
De Carvalho, O., Guimarães, R., Montgomery, D., Gillespie, A., Trancoso Gomes, R., de Souza Martins, É., Silva, N.,
2013. Karst Depression Detection Using ASTER, ALOS/PRISM and SRTM-Derived Digital Elevation Models in the Bambuí Group, Brazil. Remote Sensing, 6, 330–351. doi:10.3390/rs6010330
Denizman, C.A.N., 2003. Morphometric and Spatial
Distribution Parameters of Karstic Depressions , Lower Suwannee River Basin, Florida. Journal of Cave and Karst Studies, 65, 29–35.
Doctor, D.H., Young, J.A., 2013. An evaluation of automated gis tools for delineating karst sinkholes and closed depressions from 1-meter lidar-derived digital elevation data, in: 13TH SINKHOLE CONFERENCE.
Filin, S., Baruch, A., Avni, Y., Marco, S., 2011. Sinkhole characterization in the Dead Sea area using airborne laser scanning. Natural Hazards, 58, 1135–1154.
doi:10.1007/s11069-011-9718-7
Gams, I., 1974. Kras : zgodovinski, naravoslovni in geografski oris. Slovenska matica.
Gams, I., 2003. Kras v Sloveniji v prostoru in času. Karst Research Institute, Založba ZRC.
Gutiérrez-Santolalla, F., Gutiérrez-Elorza, M., Marín, C., Maldonado, C., Younger, P.L., 2005. Subsidence hazard avoidance based on geomorphological mapping in the Ebro River valley mantled evaporite karst terrain (NE Spain). Environmental Geology, 48, 370–383. doi:10.1007/s00254-005-1281-7
Habič, P., 1986. Površinska razčlenjenost Dinarskega krasa.
Acta Carsologica, 14, 39–58.
Höfle, B., Rutzinger, M., 2011. Topographic airborne LiDAR in geomorphology: A technological perspective. Zeitschrift für Geomorphologie, Supplementary Issues, 55, 1–29. doi:10.1127/0372-8854/2011/0055S2-0043
Hofton, M.., Rocchio, L.., Blair, J.., Dubayah, R., 2002. Validation of Vegetation Canopy Lidar sub-canopy topography measurements for a dense tropical forest.
Journal of Geodynamics, 34, 491–502. doi:10.1016/S0264-3707(02)00046-7
Jenson, S.K., Dominque, J.O., 1988. Extracting topographic structure from digital elevation data foar geographic information system analysis. Photogrammetric Engineering and Remote Sensing, 54.
Kemmerly, P., 1976. Definitive doline characteristics in the Clarksville quadrangle, Tennessee. Geological Society of America Bulletin, 87, 42–46.
Kobler, A., Pfeifer, N., Ogrinc, P., Todorovski, L., Oštir, K., Džeroski, S., 2007. Repetitive interpolation: A robust algorithm for DTM generation from Aerial Laser Scanner Data in forested terrain. Remote Sensing of Environment, 108, 9–23. doi:10.1016/j.rse.2006.10.013
Kunaver, J., 1983. Geomorfološki razvoj Kaninskega pogorja s posebnim ozirom na glaciokraške pojave. Geografski zbornik, 22, 197–346.
Kutnar, L., Kobler, A., 2011. Prediction Oof Forest Vegetation Shift Due to Different Climate-Change Scenarios in Slovenia. Šumarski list, 135, 113–126.
Lavalle, P., 1967. Some Aspects of Linear Karst Depression Development in South Central Kentucky. Annals of the Association of American Geographers, 57, 49–71. doi:10.1111/j.1467-8306.1967.tb00590.x
Meng, X., Currit, N., Zhao, K., 2010. Ground Filtering Algorithms for Airborne LiDAR Data: A Review of Critical Issues. Remote Sensing, 2, 833–860. doi:10.3390/rs2030833
Newby, P.R.T., 2012. Photogrammetric Terminology: Second Edition. The Photogrammetric Record, 27, 360–386. doi:10.1111/j.1477-9730.2012.00693.x
Obu, J., Podobnikar, T., 2013. Algorithm for karst depression recognition using digital terrain models. Geodetski Vestnik, 57, 260–270.
Ogden, A.E., 1988. Morphometric Analysis of the Sinkholes in the Greenbrier Limestone of West Virginia, in: 2nd, Environmental Problems in Karst Terranes and Their Solutions. p. 22.
Passalacqua, P., Belmont, P., Foufoula-Georgiou, E., 2012. Automatic geomorphic feature extraction from lidar in flat and engineered landscapes. Water Resources Research, 48, n/a–n/a. doi:10.1029/2011WR010958
Pirotti, F., 2010. Assessing a Template Matching Approach for Tree Height and Position Extraction from Lidar-Derived Canopy Height Models of Pinus Pinaster Stands. Forests, 1, 194–208. doi:10.3390/f1040194
Pirotti, F., 2011. Analysis of full-waveform LiDAR data for forestry applications: a review of investigations and methods. iForest-Biogeosciences and Forestry, 4, 100.
Pirotti, F., Guarnieri, A., Vettore, A., 2013. State of the Art of Ground and Aerial Laser Scanning Technologies for High-Resolution Topography of the Earth Surface.
European Journal of Remote Sensing, 46, 66–78. doi:doi: 10.5721/EuJRS20134605
Podobnikar, T., Schöner, M., Jansa, J., Pfeifer, N., 2008. Spatial analysis of anthropogenic impact on karst
geomorphology (Slovenia). Environmental Geology, 58, 257–268. doi:10.1007/s00254-008-1607-3
Rahimi, M., Calvin Alexander, M., 1985. Locating Sinkholes in Lidar Coverage Of A Glacio-Fluvial Karst, Winona County, MN, in: 13TH SINKHOLE CONFERENCE. pp. 469–481.
Schumm, S.A., 1956. Evolution of Drainage Systems And Slopes in Badlands at Perth Amboy, New Jersey.
Geological Society of America Bulletin, 67, 597.
doi:10.1130/0016-7606(1956)67[597:EODSAS]2.0.CO;2
Siegel, S., Castellan, N.J., 1988. Nonparametric Statistics for the Behavioral Sciences. McGraw–Hill, New York.
Sofia, G., Pirotti, F., Tarolli, P., 2013. Variations in multiscale curvature distribution and signatures of LiDAR DTM errors. Earth Surface Processes and Landforms, 38, 1116–1134. doi:10.1002/esp.3363
Ticci, M., Kelson, K., Brossy, C., Amos, C., 2011. Applications of LiDAR data analysis for geomorphic study, in:
Geomorphometry 2011 Conference Proceedings. pp. 7– 9.
Varhola, A., Coops, N.C., 2013. Estimation of watershed-level distributed forest structure metrics relevant to hydrologic modeling using LiDAR and Landsat. Journal of Hydrology, 487, 70–86.
doi:10.1016/j.jhydrol.2013.02.032
Vilhar, U., Simončič, P., 2012. Water status and drought stress in experimental gaps in managed and semi-natural silver fir--beech forests. European Journal of Forest Research, 131, 1381–1397. doi:10.1007/s10342-012-0605-x
Vilhar, U., Starr, M., Katzensteiner, K., Simončič, P., Kajfež -Bogataj, L., Diaci, J., 2010. Modelling drainage fluxes in managed and natural forests in the Dinaric karst: a model comparison study. European Journal of Forest Research, 129, 729–740. doi:10.1007/s10342-010-0379-y
Vilhar, U., Starr, M., Urbančič, M., Smolej, I., Simončič, P., 2005. Gap evapotranspiration and drainage fluxes in a managed and a virgin dinaric silver fir–beech forest in Slovenia: a modelling study. European Journal of Forest Research, 124, 165–175. doi:10.1007/s10342-005-0067-5
Weishampel, J., Hightower, J., Chase, A., Chase, D., Patrick, R., 2011. Detection and Morphologic Analysis of Potential Below-Canopy Cave Openings in the Karst Landscape around the Maya Polity of Caracol using Airborne Lidar. Journal of Cave and Karst Studies, 73, 187–196. doi:10.4311/2010EX0179R1
Williams, P.W., 1971. Illustrating morphometric analysis of karst with examples from New Guinea. Zeitschrift für Geomorphologie,.
Williams, P.W., 1972. Morphometric Analysis of Polygonal Karst in New Guinea. Geological Society of America Bulletin, 83, 761.
doi:10.1130/0016-7606(1972)83[761:MAOPKI]2.0.CO;2
Witze, A., 2013. Florida forecasts sinkhole burden. Nature, 504, 196–7. doi:10.1038/504196a