COMPARISON OF BIOPHYSICAL AND SATELLITE PREDICTORS FOR WHEAT
YIELD FORECASTING IN UKRAINE
A. Kolotii a, b,c , N. Kussul a, c, A. Shelestov a, b, c, S. Skakun a, B. Yailymov a, b, R. Basarab a, b , M. Lavreniuk a, T. Oliinyk a, V. Ostapenko a
a
Space Research Institute NAS Ukraine and SSA Ukraine, Department of Space Information Technologies and Systems, Kyiv, Ukraine – [email protected]; [email protected]; [email protected]; [email protected];
[email protected]; [email protected]; [email protected]; [email protected] b
National University of Life and Environmental Sciences of Ukraine, Kyiv, Ukraine c National Technical University of Ukraine “Kyiv Polytechnic Institute”, Kiev, Ukraine
KEY WORDS: Crop yield, Forecasting, Biophysical parameters, Winter wheat, Ukraine, regression model, NDVI, FAPAR, LAI
ABSTRACT:
Winter wheat crop yield forecasting at national, regional and local scales is an extremely important task. This paper aims at assessing the efficiency (in terms of prediction error minimization) of satellite and biophysical model based predictors assimilation into winter wheat crop yield forecasting models at different scales (region, county and field) for one of the regions in central part of Ukraine. Vegetation index NDVI, as well as different biophysical parameters (LAI and fAPAR) derived from satellite data and WOFOST crop growth model are considered as predictors of winter wheat crop yield forecasting model. Due to very short time series of reliable statistics (since 2000) we consider single factor linear regression. It is shown that biophysical parameters (fAPAR and LAI) are more preferable to be used as predictors in crop yield forecasting regression models at each scale. Correspondent models possess much better statistical properties and are more reliable than NDVI based model. The most accurate result in current study has been obtained for LAI values derived from SPOT-VGT (at 1 km resolution) on county level. At field level, a regression model based on satellite derived LAI significantly outperforms the one based on LAI simulated with WOFOST.
1. INTRODUCTION
Crop yield forecasting is one of the main components of agriculture monitoring and an extremely important input in enabling food security and sustainable development (Kussul et al., 2011, 2010b; Skakun et. al., 2014, 2015). Providing timely and reliable crop yield forecasts is equally important at global, national and regional (local) scales. Currently, there are several operational systems providing crop yield forecasts at global scale. These are Global Information and Early Warning System (GIEWS) by FAO, National Agricultural Statistical Service (NASS) and Foreign Agricultural Service (FAS) by USDA, CropWatch by Chinese Academy of Sciences, and MARS Crop Yield Forecasting System (MCYFS) by EC-JRC (López-Lozano et al., 2015). These systems are being built using a wide range of data sets and models including remote sensing data, meteorological observations and crop growth models.
The use of remote sensing data from space for crop yield forecasting is motivated by wide coverage, near-real time delivery of data and products, and ability to provide different vegetation indicators. Many studies have shown that forecasting models based on remote sensing data can give similar or better performance comparing to the more sophisticated crop growth models (Gallego et al., 2012, Kogan et al., 2013a, 2013b; Kowalik et al., 2014). Usually, remote sensing derived indicators are connected to crop yield using empirical regression-based models. Traditionally, vegetation indices such as Normalized Difference Vegetation Index (NDVI), Enhanced Vegetation Index (EVI), and Vegetation Health Index (VHI) are used as input parameters into empirical models (Becker-Reshef et al., 2010; Franch et al., 2015; Kogan et al., 2013a; Kowalik et al., 2014; Salazar et al., 2008). Recently, however, more attention has been brought to the usage of biophysical parameters such as leaf area index (LAI) and fraction of
absorbed photosynthetically active radiation (fAPAR) (Camacho et al., 2013; Shelestov et al., 2015). It is stated that biophysical parameters more adequately reflect the state of the crops and thus could be better suited for predicting crop yield and production (Duveiller et al., 2013; Kussul et al., 2014; López-Lozano et al., 2015). López-Lozano et al. (2015) use accumulated over optimal time period FAPAR values to predict yield for wheat, barley and maize for European Union and neighboring countries. They find that FAPAR is strongly correlated (R2>0.6) with yield for all three crop types for water constrained countries. (Kussul et al., 2014) compare FAPAR, NDVI and VHI for winter wheat yield forecasting in Ukraine. They find that performance of empirical regression models based on satellite data with biophysical variables (such as FAPAR) is approximately 20% more accurate comparing to the NDVI approach when producing winter wheat yield forecasts at oblast level in Ukraine 2–3 months prior to harvest. (Duveiller et al., 2013) use FAPAR parameter for sugarcane yield prediction in Brazil. They achieve yield estimation accuracy of around 1.5 t/ha without considering the trend and about 0.6 t/ha when the trend is taken into account.
It should be however noted that in many studies satellite data from space are used at global or national scales. In our previous study, we have estimated efficiency of using predictors of different nature (vegetation indices, biophysical parameters, and a crop growth model adopted for the territory of Ukraine) at oblast level (Kogan et al., 2013a, 2013b; Kussul et al., 2013; Kussul et al., 2014). No previous studies assessed efficiency of satellite-derived indicators at multiple scales. This paper is aimed at addressing this gap.
regression model for crop yield estimation. Our previous study have demonstrated the effect of overfitting when more complex models are used (Kogan et al., 2013b). The main goal of the paper is to determine the best predictors for regression models at different scales among satellite and biophysical model (WOFOST) input parameters. We consider three levels of investigation for the best predictor selection in yield forecasting problems: region, county and fields of concrete farm. Oblast is a sub-national administrative unit that corresponds to the NUTS2 level of the Nomenclature of Territorial Units for Statistics (NUTS) of the European Union, county corresponds to NUTS3 level.
Therefore, the objective of the study presented in this paper is to assess the efficiency (in terms of prediction error minimization) of satellite and biophysical model based predictors assimilation into winter wheat crop yield forecasting models at different scales (region, county and field).
2. STUDY AREA AND DATA DESCRIPTION
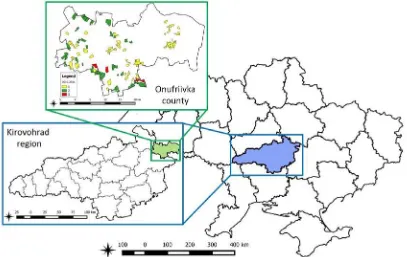
A study area in Onufriivka county of Kirovohrad region has been selected for winter wheat forecasting (Figure 1). The region was selected for investigation for several reasons. First, it is one of our points of interest within SIGMA project (Lavreniuk et al., 2015) situated not far from one of the agro-meteorological stations, for which we have calibrated WOFOST model and gathered correspondent time series of meteorological and phenological parameters since 2000. Second, there are fields of agriculture enterprise “Veres” at the county, for which agronomical data were collected since 2010 year. For example, Figure 1 shows location of “Veres” enterprise fields, where winter wheat was grown during one year (shown in yellow), two years (green) and three years (red) since 2010. Therefore, ground measurements for this territory at different scales were available to build and compare winter wheat forecasting models.
Figure 1. The area of investigation at different scales: Kirovohrad region, Onufriivka county and fields with winter, grown for 1 (yellow), 2 (green) and 3 (red) years since 2010
The following satellite-based predictors for empirical regression crop yield models are used in the study: 16-day NDVI composites derived from Moderate Resolution Imaging Spectroradiometer (MODIS) at 250 m spatial resolution, LAI and FAPAR composites from SPOT-Vegetation at 1 km spatial resolution. At the field level, we will compare the efficiency of using as a predicator LAI values derived from satellites images and WOFOST crop growth model that was adapted and calibrated for the study area.
In our previous study we have compared NDVI MOD13Q1 composites and FAPAR derived from SPOT-Vegetation as a predictors for crop yield estimation for Kirovohrad region (Kussul et al., 2014). We have demonstrated that the most informative NDVI predictors are from the last decad of April, and the most informative values of FAPAR are from the last decad of May.
So in our present study we considered several possible predictors derived for the last decad of April till end of May for each scale level:
- LAI and FAPAR (SPOT-Vegetation, 1 km resolution), NDVI (MODIS, 250 m resolution), averaged at region
level using a 300 m resolution GlobCover map and
built within the SIGMA project 30-meter LandCover (Lavrenuik et al., 2015) crop mask;
- LAI and FAPAR (SPOT-Vegetation, 1 km resolution), NDVI (MODIS, 250 m resolution), averaged at county
level using a 300 m resolution GlobCover map and
built within the SIGMA project 30-meter LandCover (Lavrenuik et al., 2015) crop mask;
Since traditional harvest time for winter wheat in Ukraine is July, the use of such kinds of predictors allows us to forecast the crop yield 1–2 months before the harvest.
3. SATELLITE PRODUCTS DESCRIPTION
LAI and FAPAR, used in this study, are free of charge SPOT Vegetation products, which were obtained from Copernicus Global Land Service (http://land.copernicus.eu). These products are modeled data taken by processing the SPOT Vegetation (SPOT-VGT) satellite imagery. Their temporal coverage includes period from Dec 1998 to May 2014, and its spatial resolution is 1 km.
The MODIS product MOD13Q1 contains two vegetation indices – NDVI and EVI, which are computed from atmospherically corrected surface reflectance (SR), that have been masked for water and atmospheric effects, i.e. clouds, cloud shadows and heavy aerosols. It is provided for every 16 days at 250-meter spatial resolution. In our study we used only NDVI satellite product, obtained from MOD13Q1.
A 30-meter crop mask was derived from land cover map that was created within SIGMA project from Landsat-7 images (Gallego et al., 2014; Lavreniuk et al., 2015; Shelestov et al., 2013; Skakun et al., 2014).
4. RESULT ANALYSIS
Yield is estimated as a sum (1) of trend component (linear trend in yield time series is present (2)) and deviation from trend, caused by current situation with vegetation development:
i i
i T dY
Y (1)
i a a
Ti 0 1* (2)
At the same time deviation is estimated with a linear single-factor regression model
i
ii f sat data b b sat data
dY _ 0 1* _ , (3)
where sat_datai — is information feature (predictor) for year i in available time series. In this study we consider as predictors such bioparameters as satellite derived LAI and FAPAR averaged on decad base (3 times per month) and 16-days NDVI index composites containing best pixels for 16-day period of time for cropland in borders of region, county and field. Also as predictor we consider LAI time series samples generated from WOFOST model calibrated for generalized winter wheat field at test site location (field level) with the same time resolution as satellite derived LAI product.
Models are calibrated on official statistics data for 2000-2013. The reason is at the moment fAPAR and LAI derived from PROBA-V data are under the development and expected to be available on Q3 2015. At the same time SPOT-VGT derived bioparameters are limited by May 2014.
Figure 2. Official statistics on winter wheat crop yield for region, county scale and field based crop yield
Figure 3. Linear dependency between county level statistics and field level crop yield data
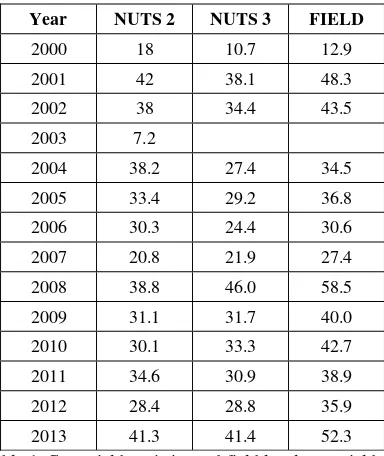
Very good linear correlation (R2=0.99) between county level statistics and field level crop yield data allows us to restore missing observations at field level (Table 1) for 2000-2009 and use it for a field level model identification.
Trend analysis for official statistics on winter wheat crop yield for different scales is shown in Figure 2. County level statistics is absent for exceptionally dry 2003 year. Field level data are available only since 2010. The trends for region (solid line) and county (dashed line) scales are very similar. Field level trend is not representative, because we have only 4 points of observations. But linear dependency between winter wheat crop yield at field and county scale is observed (Figure 3).
Year NUTS 2 NUTS 3 FIELD
2000 18 10.7 12.9
2001 42 38.1 48.3
2002 38 34.4 43.5
2003 7.2
2004 38.2 27.4 34.5
2005 33.4 29.2 36.8
2006 30.3 24.4 30.6
2007 20.8 21.9 27.4
2008 38.8 46.0 58.5
2009 31.1 31.7 40.0
2010 30.1 33.3 42.7
2011 34.6 30.9 38.9
2012 28.4 28.8 35.9
2013 41.3 41.4 52.3 Table 1. Crop yield statistics and field level crop yield for
Vegetation parameters are averaged within corresponding administrative units using the crop mask with 30-meter resolution, derived from the land cover map developed by SRI within SIGMA project and field borders for field level.
Current results of models identification in terms of time consistency and statistical properties of models are presented in Table 2. Taking into account very limited number of observations (only 14 for region and 13 for county and field level), to identify the best model we have used the cross-validation procedure (LOOCV). In order to identify the parameters of regression we used all except one (13 or 12) observations, and the one is used for independent testing of the model. Repeating the procedure for all possible independent observations, we select the best model for each scale level.
UNIT Stat
Table 2. Statistical properties of regression models at different scales
In Table 2 we have used following designations and abbreviations: R2 is the coefficient of determination (shows how well data fit the model), Fstat is Fisher’s statistics (F-statistics), the measure of statistical model adequacy, p-val is hypothesis test that determines the significance of regression model coefficients (predictor with p-value <0.05 is likely to be a meaningful addition to the model), RMSE is Root Mean Squared Error (RMSE) built within the Leave-One-Out-Cross-Validation procedure (LOOCV) where one case is used for model testing and other is for model calibration.
According to Table 2, biophysical products (fAPAR and LAI) are more preferable to be used as predictors in crop yield forecasting regression models. Correspondent models possess much better statistical properties and are more reliable than the NDVI based model. The most accurate result in current study has been obtained for LAI values derived from SPOT-VGT (at 1 km resolution) on county scale averaged using the crop mask, derived from 30 m land cover map (Lavreniuk et.al, 2015).
For region scale models we have compared the efficiency of two different crop masks: GlobCover-2009 at 300 m resolution (Arino et. al, 2012) and the crop mask, derived from developed by Space Research Institute NASU-NSAU landcover map with 30 meter resolution (Lavreniuk et.al, 2015) with resolution of 30m. Statistical properties of the models in both cases are nearly the same (Table 3). It means that considered crop masks are consistent enough, and higher accuracy of crop yield estimation could be reached using dynamic crop mask, based on early season crop classification.
UNIT Stat
Table 3. Efficiency analysis of different crop masks for winter wheat crop yield forecasting at region level
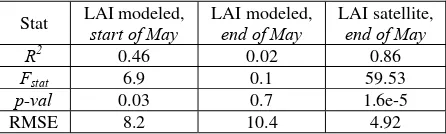
For field scale, we also compared the efficiency of satellite based and biophysical model derived predictors. As model based predictors we used LAI time series, simulated with WOFOST model for the same period of vegetation period as satellite based LAI (end of May).
Generated by WOFOST model LAI values significantly overestimate the real state of the vegetation (Fig. 4). It is probably due to WOFOST model provide just potential yield forecasting. Thus, usage of modeled bioparameters leads to statistically inadequate model (according to p-val and F-stat), especially in the case of limited availability of field-specific data for model calibration (Table 4). For the most important part of winter wheat vegetation period for considered region– from the end of April till the end of May – p-val for such predictor grows significantly from 0.03 to 0.7 which means that modeled LAI is meaningless addition to the yield forecasting model with current level of ground data measurements by farmers. F-statistics is less then critical one – critical level of
F-statistics with λ=0.01 is 9.07 for model with 1 predictor at 13
samples. RMSE error of the crop yield prediction on model based LAI obtained within LOOCV-procedure is at least twice higher than for satellite predictors. So we can conclude that model is not calibrated well enough, and do not simulate the real state of the vegetation. For its adequate calibration much more phenological, agronomic and local meteorological data is required. As a rule such data are missing for agricultural companies or databases contain only very limited amount of data. So, in the nearest future satellite based predictors are expected to be more preferable for use in regression models for crop yield estimation.
Stat LAI modeled,
Table 4. Statistical properties of crop yield regression models with model based and satellite predictors at the field level
5. DISCUSSION AND CONCLUSIONS
In the paper the problem of winter wheat crop yield prediction is considered at different scales, namely NUTS2, NUTS3 and field level for the territory of Kirovohrad region of Ukraine. The study area is selected for several reasons: the region is one of the main producers of winter wheat in Ukraine, it is situated at the central part of Ukraine with typical climatic conditions, within SIGMA project we have collected soil, meteorological and phenological data at the county level, and field level agronomic and statistical data are available for the territory. So, we have all necessary information for multi scale winter wheat crop yield modelling. Since reliable statistics in Ukraine is available since 2000 year, we use a single factor linear regression model for crop yield estimation to avoid overfitting. We have investigated 3 kinds of satellite based predictors (NDVI with 250 meter resolution, fAPAR and LAI at 1 km resolution) averaged within static crop mask at three different scales. As a crop mask we used GlobCover and a 30 meter crop mask, based on LandCover map, created within SIGMA project (Lavreniuk et al., 2015). Both crop masks provide quite good results with very similar statistical properties, while higher accuracy of forecasting could be reached with dynamic crop masks. We plan to implement this approach in our future work with use of high-performance computations (Kussul et al., 2009, 2010a, 2012; Kravchenko et al., 2008, Shelestov et al., 2006). The regression model with the best statistical properties is received for county level when satellite based biophysical predictors (FAPAR or LAI) are used. The results are consistent to our previous study and recent results for European territory (López-Lozano et al., 2015).
At field scale, we also have considered as a regression model based LAI simulated with WOFOST biophysical model. But statistical properties of the regression are much poorer than with satellite based predictors. RMSE error of the crop yield prediction on model based LAI is at least twice higher than for satellite predictors. So we can conclude that model is not calibrated well enough, and do not simulate the real state of the vegetation. For its adequate calibration much more phenological, agronomic and local meteorological data is required. As a rule, such data are missing for agricultural companies or databases contain only very limited amount of data. So, in the nearest future satellite based predictors are expected to be more preferable for use in regression models for crop yield estimation.
ACKNOWLEDGEMENTS
This work was supported by the EC under FP7 Grant “Stimulating Innovation for Global Monitoring of Agriculture and its Impact on the Environment in support of GEOGLAM” (SIGMA) [number 603719].
REFERENCES
Arino, O., Ramos P., Jose J., Kalogirou, V., Bontemps, S., Defourny, P., Van Bogaert, E., 2012. Global Land Cover Map for 2009 (GlobCover 2009). European Space Agency (ESA) & Université catholique de Louvain (UCL), doi:10.1594/PANGAEA.787668
Becker-Reshef, I., Vermote, E., Lindeman, M., Justice, C., 2010. A generalized regression-based model for forecasting winter wheat yields in Kansas and Ukraine using MODIS data.
Remote Sensing of Environment, 114(6), pp. 1312–1323.
Camacho, F., Cernicharo, J., Lacaze, R., Baret, F., Weiss, M., 2013. GEOV1: LAI, FAPAR Essential Climate Variables and FCOVER global time series capitalizing over existing products. Part 2: Validation and intercomparison with reference products.
Remote Sensing of Environment, 137, pp. 310–329.
Duveiller, G., López-Lozano, R., Baruth, B., 2013. Enhanced Processing of 1-km Spatial Resolution fAPAR Time Series for Sugarcane Yield Forecasting and Monitoring. Remote Sensing, 5(3), pp. 1091–1116.
Franch, B., Vermote, E.F., Becker-Reshef, I., Claverie, M., Huang, J., Zhang, J., Justice, C., Sobrino, J.A., 2015. Improving the timeliness of winter wheat production forecast in the United States of America, Ukraine and China using MODIS data and NCAR Growing Degree Day information. Remote Sensing of
Environment, 161, pp. 131–148.
Gallego, F.J., Kussul, N., Skakun, S., Kravchenko, O., Shelestov, A., Kussul, O., 2014. Efficiency assessment of using satellite data for crop area estimation in Ukraine. International
Journal of Applied Earth Observation and Geoinformation, 29,
pp. 22–30.
Gallego, J., Kravchenko, A.N., Kussul, N.N., Skakun, S.V., Shelestov, A.Y., Grypych Y.A., 2012. Efficiency assessment of different approaches to crop classification based on satellite and ground observations. Journal of Automation and Information
Sciences, 44(5), pp. 67–80.
Kogan, F., Kussul, N., Adamenko, T., Skakun, S., Kravchenko, O., Kryvobok, O., Shelestov, A., Kolotii, A., Kussul, O., Lavrenyuk, A., 2013a. Winter wheat yield forecasting in Ukraine based on Earth observation, meteorological data and biophysical models. International Journal of Applied Earth
Observation and Geoinformation, 23, pp. 192–203.
Kogan, F., Kussul, N., Adamenko, T., Skakun, S., Kravchenko, O., Kryvobok, O., Shelestov, A., Kolotii, A., Kussul, O., Lavrenyuk, A., 2013b. Winter wheat yield forecasting: A comparative analysis of results of regression and biophysical models. Journal of Automation and Information Sciences, 45(6), pp. 68-81.
Kowalik, W., Dabrowska-Zielinska, K., Meroni, M., Raczka, T. U., de Wit, A., 2014. Yield estimation using SPOT-VEGETATION products: A case study of wheat in European countries. International Journal of Applied Earth Observation
and Geoinformation, 32, pp. 228–239.
computations. Cybernetics and System Analysis, 44(4), pp. 616– 624.
Kussul, N., Kolotii, A., Skakun, S., Shelestov, A., Kussul, O., Oliynuk, T., 2014. Efficiency estimation of different satellite data usage for winter wheat yield forecasting in Ukraine. In:
Proc. 2014 IEEE International Geoscience and Remote Sensing
Symposium (IGARSS), Quebec City, Canada, 13-18 July 2014,
pp. 5080–5082.
Kussul, N., Shelestov, A., Skakun, S., 2009. Grid and sensor web technologies for environmental monitoring. Earth Science
Informatics, 2(1-2), pp. 37–51.
Kussul N., Shelestov A. Skakun S. Flood Monitoring from SAR Data // In: Kogan F., Powell A., Fedorov O. (Eds.) “Use of
Satellite and In-Situ Data to Improve Sustainability”. — NATO
Science for Peace and Security Series C: Environmental Security, Springer, 2011. — P. 19-29.
Kussul, N., Shelestov, A., Skakun, S., Kravchenko, O., Gripich, Y., Hluchy, L., Kopp, P., Lupian, E., 2010a. The Data Fusion Grid Infrastructure: Project Objectives and Achievements.
Computing and Informatics, 29(2), pp. 319–334.
Kussul, N.N., Shelestov, A.Y., Skakun, S.V., Li, G., Kussul, O.M., 2012. The wide area grid testbed for flood monitoring using earth observation data. IEEE Journal of Selected Topics
in Applied Earth Observations and Remote Sensing, 5(6), pp.
1746–1751.
Kussul, N. N., Sokolov, B. V., Zyelyk, Y. I., Zelentsov, V. A., Skakun, S. V., & Shelestov, A. Y., 2010b. Disaster risk assessment based on heterogeneous geospatial information.
Journal of Automation and Information Sciences, 42(12), pp.
32-45
Kussul O., Kussul N., Skakun S., Kravchenko O., Shelestov A., Kolotii A., 2013. Assessment of relative efficiency of using MODIS data to winter wheat yield forecasting in Ukraine. IEEE International Geoscience and Remote Sensing Symposium (IGARSS 2013), (21-26 July 2013, Melbourne, Australia), pp. 3235–3238.
Lavreniuk, M., Kussul, N., Skakun, S., Shelestov, A., Yailymov, B. 2015. Regional retrospective high resolution land cover for Ukraine: methodology and results. In: Proc. 2015 IEEE International Geoscience and Remote Sensing Symposium
(IGARSS), Milan, Italy, 26-31 July 2015. (submitted)
López-Lozano, R., Duveiller, G., Seguini, L., Meroni, M., García-Condado, S., Hooker, J., Leo, O., Baruth, B., 2015. Towards regional grain yield forecasting with 1km-resolution EO biophysical products: Strengths and limitations at pan-European level. Agricultural and Forest Meteorology, 206, pp. 12–32.
Salazar, L., Kogan, F., Roytman, L., 2008. Using vegetation health indices and partial least square method for estimation of corn yield. International Journal of Remote Sensing, 29 (1–2), 175–189.
Shelestov, A., Kolotii, A., Camacho, F., Skakun, S., Kussul, O., Lavrenuik, M., 2015. Mapping of biophysical parameters based on high resolution EO imagery for JECAM test site in Ukraine.
In: Proc. 2015 IEEE International Geoscience and Remote
Sensing Symposium (IGARSS), Milan, Italy, 26-31 July 2015.
(submitted)
Shelestov, A.Y., Kravchenko, A.N., Skakun, S.V., Voloshin, S.V., Kussul, N.N., 2013. Geospatial information system for agricultural monitoring. Cybernetics and System Analysis, 49(1), pp. 124–132.
Shelestov, A., Kussul, N., Skakun, S., 2006. Grid Technologies in Monitoring Systems Based on Satellite Data. Journal of
Automation and Information Sciences, 38(3), pp. 69–80.
Skakun, S., Kussul, N., Shelestov, A., & Kussul, O., 2015. The use of satellite data for agriculture drought risk quantification in Ukraine. Geomatics, Natural Hazards and Risk, (ahead-of-print), 1-18.
Skakun S., Kussul N., Kussul O., Shelestov A., 2014. Quantitative estimation of drought risk in Ukraine using satellite data. Geoscience and Remote Sensing Symposium
(IGARSS), 2014 IEEE International, pp. 5091-5094.
Skakun, S., Basarab, R., 2014. Reconstruction of Missing Data in Time-Series of Optical Satellite Images Using Self-Organizing Kohonen Maps. Journal of Automation and