SIMILARITY MEASURES OF FULL POLARIMETRIC SAR IMAGES FUSION FOR
IMPROVED SAR IMAGE MATCHING
H. Ding a, b, * a
School of Geosciences and Info-physics, Central South University, Changsha, China – [email protected] b
Chinese Academy of Surveying and Mapping, Beijing, China
Commission VI, WG VI/4
KEY WORDS: SAR Image Matching, Logarithmically Image Transformation, NCC Measure, Information-based Entropy, Similarity Measures Fusion, Full Polarimetric SAR Data
ABSTRACT:
China’s first airborne SAR mapping system (CASMSAR) developed by Chinese Academy of Surveying and Mapping can acquire high-resolution and full polarimetric (HH, HV, VH and VV) Synthetic aperture radar (SAR) data. It has the ability to acquire X-band full polarimetric SAR data at a resolution of 0.5m. However, the existence of speckles which is inherent in SAR imagery affects visual interpretation and image processing badly, and challenges the assumption that conjugate points appear similar to each other in matching processing. In addition, researches show that speckles are multiplicative speckles, and most similarity measures of SAR image matching are sensitive to them. Thus, matching outcomes of SAR images acquired by most similarity measures are not reliable and with bad accuracy. Meanwhile, every polarimetric SAR image has different backscattering information of objects from each other and four polarimetric SAR data contain most basic and a large amount of redundancy information to improve matching. Therefore, we introduced logarithmically transformation and a stereo matching similarity measure into airborne full polarimetric SAR imagery. Firstly, in order to transform the multiplicative speckles into additivity ones and weaken speckles’ influence on similarity measure, logarithmically transformation have to be taken to all images. Secondly, to prevent performance degradation of similarity measure caused by speckles, measure must be free or insensitive of additivity speckles. Thus, we introduced a stereo matching similarity measure, called Normalized Cross-Correlation (NCC), into full polarimetric SAR image matching. Thirdly, to take advantage of multi-polarimetric data and preserve the best similarity measure value, four measure values calculated between left and right single polarimetric SAR images are fused as final measure value for matching. The method was tested for matching under CASMSAR data. The results showed that the method delivered an effective performance on experimental imagery and can be used for airborne SAR matching applications.
* Corresponding author
1. INTRODUCTION
A major research area in SAR image processing is image matching for 3D reconstruction (Toutin, 2000), etc. Area-based image matching methods can provide dense and accurate matching points. However, they are intolerant to radiometric distortions caused by speckles and imaging geometry (Edwards, 2005). Meanwhile, most SAR image matching methods allow match with single polarimetric or fused multi-polarimetric SAR imagery (Toutin et al., 2010) without making full use of multi-polarimetric SAR imagery information. Therefore, in order to obtain a more accurate and robust matching points of two overlapping SAR images, we take a special interest to the full-polarimetric SAR imagery matching method. In this paper, procedures are described to combine four similarity measures calculated from corresponding logarithmically transformed polarimetric images respectively to ensure that the matching points are determined by all data available. The paper is organized as follows: section 2 introduces the similarity measure for matching, section 3 describes the similarity measures fusion procedure, section 4 shows similarity measures and matching points results from CASMSAR airborne full-polarimetric SAR data, and conclusions are drawn in section 5.
2. SIMILARITY MEASURE CALCULATED FROM SINGLE POLARIMETIC SAR IMAGERY
2.1 Overview
Figure 1 illustrates the single polarimetric SAR imagery matching procedure. The goal of this technique is to achieve similarity measures from overlapping SAR images with same polarimetric mode.
The key function of data pre-processing is to improve the subsequent processes by logarithmically transformation. Then, matching from overlapping SAR images is based on the Normalized Cross-Correlation (NCC) similarity measure. Therefore, the procedure consists of two main parts. Part 1 transforms the origin polarimetric image into logarithmically transformed image, in order to change the multiplicative speckles into additivity ones. Part 2 introduces NCC stereo matching similarity measure into SAR image matching.
The International Archives of the Photogrammetry, Remote Sensing and Spatial Information Sciences, Volume XL-7/W4, 2015 2015 International Workshop on Image and Data Fusion, 21 – 23 July 2015, Kona, Hawaii, USA
This contribution has been peer-reviewed.
Logarithmically Transformation Left Single Polarimteric
SAR Image
Right Single Polarimteric SAR Image
Block Pixels Normalization
Similarity Measures
Figure 1. Single polarimetric SAR imagery matching procedure
2.2 SAR Imaging Model
Assuming a linear imaging device is used, the intensity of a pixel can be modelled as the function of wave energy backscattered from the corresponding surface (Guo et al., 2000)
(1)
where = scale factor which includes speckle caused by coherence of radar signal
= additive noise x, y = image coordinates.
As this work is based on the assumption of monostatic radar, is defined by the radar equation
(2)
where = transmitting power of radar = backscattering coefficient = scattering cell area = gain
= wavelength
= slant range between radar and scattering cell area. The possible additive noise is neglected in this paper because it would complicate the study. We can thus derive
simply as follows:
(3)
Meanwhile, gramma correction is used for compression of the dynamic range which is commonly used before the storage process and its influence shown in equation is as follows:
(4)
Where = exponent value of gramma correct.
2.3 Logarithmically Transformation of SAR Imagery
We assume that the multiplicative speckle in equation (4) is signal-independent. In order to reduce the effects of speckles, logarithmically transformation is employed to transform multiplicative speckles into additive ones (Bovik 2000, Gupta and Gupta 2007). The nonlinear relationship is transformed into a linear one as follows:
(5)
According to equation (2) and (5), the can be specified by the following equation:
(6)
where
The receiving power of radar at image point is determined by many factors including transmitting power of radar, gain, wavelength, backscattering coefficient, scattering cell area and slant range. Thereinto, transmitting power of radar, gain, and wavelength obtained by same SAR sensor are considered to be constant (Guo et al., 2000). However, backscattering coefficient, scattering cell area and slant range are dependent on the incident angle and position of SAR sensor. Meanwhile, different matches different incident angle and position of SAR sensor. Therefore, the values of corresponding pixels in overlapping images obtained from different views are different.
2.4 Normalized Cross-Correlation (NCC)
In order to eliminate the effect of transmitting power of radar, gain, and wavelength, we subtract the average of the transformed values in matching window (Block Pixels Normalization), thereby resulting in the removal of . It is defined by the following equation:
(7)
where = matching window = window size
One of the most commonly used SAR image matching similarity measures is Normalized Cross-Correlation (Méric et al, 2011) which is based on an area between two or more SAR images. And it can be stated as follows:
The International Archives of the Photogrammetry, Remote Sensing and Spatial Information Sciences, Volume XL-7/W4, 2015 2015 International Workshop on Image and Data Fusion, 21 – 23 July 2015, Kona, Hawaii, USA
This contribution has been peer-reviewed.
(8)
Where R = reference image M = matching image
= parallax of range direction = parallax of azimuth direction
The computation of NCC values in each polarimetrc band such as HH, HV, VH and VV can be performed similarly. The range of NCC is from -1 to +1.
3. SIMILARITY MEASURES FUSION
Under the influence of the geometric distortion, radiometric distortion, and speckles of SAR images, the discriminability of common similarity measures is very low, and most of which are concentrated between 0.2 and 0.3, and NCC similarity measure is no exception. However, SAR images with different polarimetric mode at the same area contain different image information to a certain extent (Zakharov and Toutin, 2009), the accuracy and robustness of matching points can be improved by fusing the similarity measures of different polarimetric images.
Similarity
Figure 2. Similarity measures fusion procedure
In this study, similarity measures fusion is performed by information-based entropy technique and the definition of entropy is (Li et al., 2010)
(9)
Where = the probability distribution of intensity in the image.
= the number of pixels in the image.
The relative weight of similarity measure of this polarimetric image is calculated as follows:
(10)
Therefore, the final similarity measure of a point in reference image can be defined as:
(11)
In general, there must have one maximum correlation coefficient in the curved surface of correlation coefficients and we assume that it shows the right position of the right matching point.
4. TEST AND RESULTS
In our experiments, we use airborne X-band full-polarimetric SAR images obtained by CASMSAR system. Point A is illustrated in left reference image with HH polarimetric mode and marked by red cross (see Figure 3). The pixel size in azimuth direction is 0.21m, and in range direction is 0.19m. The flight height is 3415m. The range of matching in right matching image is shown in red rectangle in figure 4. Yellow line in Figure 4 passes through the true matching point in right image, and green line is parallel with the yellow one. They are both edges of objects and there is a remarkable resemblance between them visually, so the similarity measures in these two lines will be close to each other. We fixed the window size to be 15-by-15 pixels.
Figure 3. Point A in left image
Figure 4. Range of matching in right image
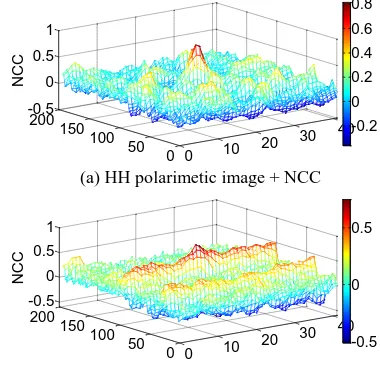
Figure 5 illustrates the curved surface of correlation coefficients between point A in figure 3 and points in rectangle of figure 4 with primary and logarithmically transformed HH polarimetric images respectively. In this search range, the curved surface of correlation coefficients of logarithmically transformed image shown in figure 5(b) is more approximate to real ground based on NCC similarity measure principle especially on the position of green and yellow line. Therefore, logarithmically transformation method weakens the effects of speckles and consequently reveal surface better than primary image.
(a) HH polarimetic image + NCC
0 10 20
(b) Transformed HH polarimetric image + NCC Figure 5. Correlation coefficients obtain from primary and
logarithmically transformed HH polarimetric images
0 10 20
The International Archives of the Photogrammetry, Remote Sensing and Spatial Information Sciences, Volume XL-7/W4, 2015 2015 International Workshop on Image and Data Fusion, 21 – 23 July 2015, Kona, Hawaii, USA
This contribution has been peer-reviewed.
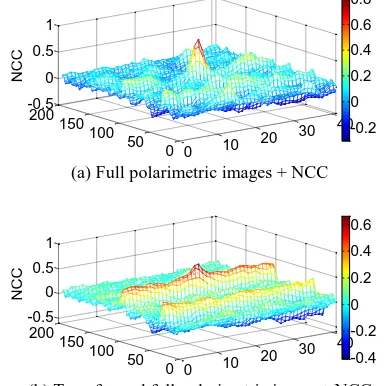
In order to avoid mismatching and further improve matching accuracy, we take advantage of full-polarimetric data by combining the correlation coefficients of them according to their image entropy. Figure 6 illustrates the curved surface of correlation coefficients between point A in figure 3 and points in rectangle of figure 4 with primary and logarithmically transformed full-polarimetric images respectively. The burr of correlation coefficients is weakened after fusion, and the discrimination is also improved. The maximum correlation coefficient on curved surface shown in figure 6(b) is the correct and precise matching point in right image. The result shows that fusion of similarity measures from full-polarimetric images improve the robustness and confidence of the final similarity measure.
0 10 20
30 40
0 50 100 150 200 -0.5 0 0.5 1
NCC
-0.2 0 0.2 0.4 0.6 0.8
(a) Full polarimetric images + NCC
0 10 20
30 40
0 50 100 150 200 -0.5 0 0.5 1
NCC
-0.4 -0.2 0 0.2 0.4 0.6
(b) Transformed full polarimetric image + NCC Figure 6. Correlation coefficients obtain from primaryand
logarithmically transformed full polarimetric images
5. CONCLUSIONS
The method described in this paper combines similarity measures obtained from four polarimetric SAR images, which makes full use of all available image information. The information is always mutually complementary to a certain extent. Moreover, the effect of speckles is reduced by logarithmically transformation. Therefore, this method leads to a more accurate and robust determination of matching points from overlapping full-polarimetric SAR images than only by single polarimetric images.
Further research is needed to find a more reliable method for similarity measures fusion and increase the discrimination between matching and mismatching points. The method will also be tested on different data and objects.
ACKNOWLEDGEMENTS
This work is supported by Special Fund by Surveying & Mapping and Geoinformation Research in the Public Interest (Project No.: 201412002).
REFERENCES
Bovik, A.C., 2000. Handbook of image and video processing. 1st ed. San Diego, CA: Academic Press,
Guo, H.D., 2000. Theories and applications of Radar for earth observation. Beijing, China: Science Press.
Gupta, K.K. and Gupta, R., 2007. Despeckle and geographical feature extraction in SAR images by wavelet transform. ISPRS Journal of Photogrammetry and Remote Sensing, 61, 473-484.
Edwards, E., 2005. Digital surface modelling in developing countries using spaceborne SAR techniques. Nottingham: University of Nottingham.
Li, S., Li, Z.L. and Gong, J.Y., 2010. Multivariate statistical analysis of measures for assessing the quality of image fusion. International Journal of Image and Data Fusion, 1(1), 47-66.
Méric, S., Fayard, F., and Pottier, E., 2011. A multiwindow approach for radargrammetric improvements. IEEE Transactions on Geoscience and Remote Sensing, 49(10), 3803-3810.
Toutin, T., 2000. Evaluation of radargrammetric DEM from RADARSAT images in high relief areas. IEEE Transactions on Geoscience and Remote Sensing, 38(2), 782-789.
Toutin, T., Zakharov, I. and Schmitt, C., 2010. Fusion of Radarsat-2 polarimetric images for improved stereo-radargrammetric DEM. International Journal of Image and Data Fusion, 1(1), 67-82.
Zhkharov, I. and Toutin, T., 2009. Integration of RADARSAT-2 multi-polarization data for stereo image matching. In: 30th Canadian symposium on remote sensing ‘Bridging Excellence’, 22-25 June 2009, Alberta, Canada: Lethbridge.
The International Archives of the Photogrammetry, Remote Sensing and Spatial Information Sciences, Volume XL-7/W4, 2015 2015 International Workshop on Image and Data Fusion, 21 – 23 July 2015, Kona, Hawaii, USA
This contribution has been peer-reviewed.