ASSESSMENT OF SURFACE WATER AT THE SOBRADINHO RESERVOIR UNDER
THE EFFECTS OF
DROUGHT USING MULTI-TEMPORAL LANDSAT IMAGES
E. A. Silva a*, M. M. Pedrosa a, S. C. Azevedo a, G. P. Cardim a, F. P. S. Carvalho a
a
Dept. of Cartography – Univ. Estadual Paulista (UNESP) – 19060-900 – Presidente Prudente – SP, Brazil – [email protected]; [email protected]; samara_calcado;gpcardim; [email protected]
KEY WORDS: Remote Sensing, Digital Image Processing, Monitoring Reservoir, Landsat, Drought.
Commission VIII, WG VIII/4
ABSTRACT:
The matrix of energy generation in Brazil is predominantly hydroelectric power. Consequently, the reservoirs need constant monitoring due to the large volume of artificially dammed water. Images from remote sensing can provide reliable information concerning water bodies. In this paper, we use remote sensing imagery to monitor the Sobradinho dam in three different epochs. The objective was to verify quantitatively the area of the dam’s surface reduced due to the drought of 2015, which was considered the worst in history. The approach used water surface area estimations from bands of Landsat5 and Landsat8 satellites which highlight water bodies betterfrom other features present on surface of the Earth. Through the techniques of growth region and normalized difference water index (NDWI), we determined the surface area of the reservoir in 2011 and calculated the decrease caused by the drought. By analyzing the numbers provided by the results it is possible to estimate how the Sobradinho reservoir has been affected by the drastic drought. The results show that the Landsat images enable the monitoring of large reservoirs. Bearing in mind that monitoring is a primary and indispensable tool, not only for technical study, but also for economic and environmental research, it can help establish planning projects and water administration strategies for future decisions about the hydrical resource priority.
* Corresponding author
1. INTRODUCTION
With approximately 8.5 million km2, Brazil stands in fifth place
among the biggest countries in territorial extension and has around 12% of the entire planet's freshwater available for human consumption, irrigation and industrial applications (ANA, 2005). Although the country is rich in water resources, Brazil is facing a severe water crisis and various cities have been suffering from lack of supply. Gaps or deficiencies in infrastructure, poor management of natural resources and lack of investment and effort towards energy efficiency are examples of the need to revise thepolicies and mechanisms in place for electricity generation considering social, economic and ecological dimensions (Prado Jr. et al., 2016).
Another factor that contributes to the current scenario is the irregular distribution of water resources across the country. An example is that the greatest concentration of freshwater, almost 60%, is situated in the north of the country, where only 7% of the population lives, while in the southeast region, where the majority of population lives (almost 42%), only 6% of thewater is available (Machado, 2003). As well as this uneven distribution of water, there is a serious problem of resource waste at all levels of society. At the same time, population growth and disorderly land occupation contributes to fresh water becoming increasingly scarce.
Northeastern Brazil is characterized by semi-arid climate, irregular rainfall, an economic underdevelopment framework and has a history of constant drought. The lack of regular rainfall is the result of three phenomena: the Atlantic Ocean water temperature, the El Niño phenomena in the Pacific Ocean
and the low atmospheric humidity. The geographical location called Inter-Tropical Convergence Zone (ITCZ), which surrounds the Earth next to the Equator, is not suited torainy periods because the air mass that reaches the northeast is hot and humid, causing rain only in the coastal region. When this mass of air moves to the interior of the northeast, it loses force and humidity and the hinterland regions remain under the influence of the tropical mass for long periods (Namias, 1972).
The water supply crisis becomes even more serious as Brazil’s power generation matrix is predominantly based on sources of hydropower. One of the greatest hydroelectric power plants in the country, the Sobradinho hydroelectric dam, located in this critical northeast region, has faced one of the worst droughts in history. In 2015, the dam reached less than 2.5% of its capacity and the level remains reduced. It is expected that hydropower generation will be stopped until the end of December 2015, due to the depletion of usable volume (Adjuto, 2015). It is therefore important to assess and monitor the dam and reservoir periodically and images acquired by Remote Sensing (RS) are a useful tool for this task.
The RS technique enables changes in the reservoir to be monitored since the images provide synoptic, repetitive and timely information across the whole area of the reservoir (Mialhe et al., 2008). Furthermore, free availability of images from the Landsat program, especially with the new improvements incorporated in the Operational Land Imager (OLI) sensor onboard Landsat-8, which has the potential to monitor changes in the Earth's land cover and take measurements of terrestrial surface waters remotely (Alsdorf et al., 2007; Roy et al., 2014).
This paper carried out the analysis of three different epochs from the Sobradinho reservoir in order to verify quantitatively the dimension of water reduction due to one of the worst droughts in the history of the northeast. Using a growth region methodology combined with multi-temporal satellite images, the proposed methodology aimed to accurately compute the water spread area of the Sobradinho reservoir. The methodology also uses mathematical morphology operators to improve the result of dam area determination. The development of this work is justified by the need to seek fast and cost-effective approaches, which contribute to a systematic water storage monitoring and improved planning and decision-making on water management in those critical regions.
2. REMOTE SENSING FOR MANAGEMENT OF WATER RESOURCES
The availability of water is essential and indispensable for driving the entire ecosystem and supporting all life processes. Water is also very important for economic and social development, since it ensures the maintenance of basic human activities. However, the uneven availability of water resources across different regions and adverse climate conditions, mainly in arid areas, can cause situations of extreme drought and water shortage.
A way to overcome these conditions is through water storage in dams and reservoirs, which contributes to the water supply for domestic use, irrigation and livestock watering. As well as reducing human reliance on the natural availability of water, the building of large dams also plays an important role in providing hydroelectric power (Sawunyama et al., 2006).
Hydropower represents a significant source of electrical energy worldwide. Although water has been exploited as a renewable energy source for centuries, the use of power plants has been responsible for several social and environmental impacts. The negative impacts presented in the literature about dams are related to changes in water quality, climatic alterations, modification of aquatic habitats, the flooding of vast fertile areas, leaving many thousands of local inhabitants and wild animals displaced (Okot, 2013).
Future expectations are that modern society’s dependence on renewable energy, including hydropower, will increase by nearly 85% between now and 2030. Challenges to energy production involve ensuring energy efficiency and minimizing energy's contribution to climate change, achieving sustainable development in the future (Prado Jr et al., 2016). Consequently, much effort is being given to finding alternatives to reduce the impacts of hydropower construction. Adequate knowledge of resources, for instance, the reservoir location and its extension, is one of the main means to access the damage and is essential for planning and management of resources supporting decision-making processes (Sawunyama et al., 2006).
Conventional techniques for estimating the area of reservoirs includes direct measurement through field survey, which is laborious, time-consuming and involves generally more cost due to in situ manpower required. Alternatively, reservoir storage can be monitored from space, based on remotely sensed technology, which can provide high resolution synoptic and repetitive information with short time intervals on a large scale (Ran and Lu, 2012).
Advances incorporated into the remote sensing system enable acquisition of images at finer spatial resolution and with high spectral sensitivity, which improve the discrimination of different materials present within each pixel area (Schowengert, 2007). Furthermore, multi-temporal satellite images contribute to the continuous monitoring of the area over time and are considered more cost effective to accurately measure reservoir surface areas (Rodrigues et al., 2012).
The available studies to delineate water bodies over a large area are based on classification approaches, heuristic threshold and spectral indices (Ko et al., 2015). Even though these methods can produce errors under complex topologies and depend on acquisition being made on cloud- and smoke-free days due to the use of optical imagery, they are simple and use only the thematic information available in satellite data. In addition, the main advantage of quick and simple methods is that they require few parameters to facilitate extraction of objects when time is critical, such as periodic assessment of water resource avoiding disaster response (Gao et al., 2012; Eilander et al., 2014). In particular, the use of water supervised classification algorithms allied to multi-temporal satellite data has been shown to be effective in a large variety of problems, such as to assess water quality automatically and control the rate of sedimentation. Although supervised learning needs expert experience and reference data, it can be extensively used to map surface water bodies and facilitates monitoring of reduction in reservoir storage volumein a cost- and time-effective manner.
3. STUDY AREA
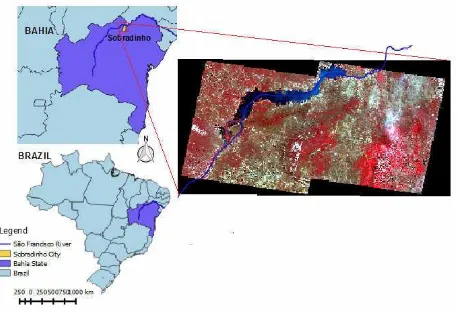
The Sobradinho dam is located in the São Francisco River (the third largest river in Brazil), at the state of Bahia, approximately 40 km from the cities of Juazeiro-Bahia and Petrolina-Pernambuco, as shown in Figure 1. The total storage of the reservoir is 34.1 billion cubic meters and it extends over 350km with an artificial lake surface of 4214km2, so it is one of the biggest reservoirs in the world (Braga et al., 2012).
Figure 1: Localization of Sobradinho reservoir and image TM/Landsat-5, false color composition, acquired in 10 and 16
of june of 2011 with the São Francisco River overlap.
The main objective of constructing Sobradinho was to provide local power generation. The reservoir also provides a water supply for irrigation, navigation and flood protection. In addition to this, the reservoir has a multi annual function to The International Archives of the Photogrammetry, Remote Sensing and Spatial Information Sciences, Volume XLI-B8, 2016
regulate the downstream hydroelectric projects of Itaparica, Moxoto, Paulo Afonso and Xingo (Souza et al., 2015).
This reservoir is located in the Northeast region of Brazil, in an area whose climate is characterized as semiarid, with an average annual temperature of 27 degrees Celsius (Silva, 2005). The semiarid is a typical desert climate but, unlike deserts, the Brazilian Northeast is the most populated semiarid region in the world, with occupation spread throughout whole territory (Kosminsky and Zuffo, 2009). This region is also characterized by irregular rain; normally, in the winter there is a lack of rainfall during a period of five to eight months, and in the summer season there is rainfall, so there is spatial and temporal irregularity in the amount and distribution (Soares, 2013).
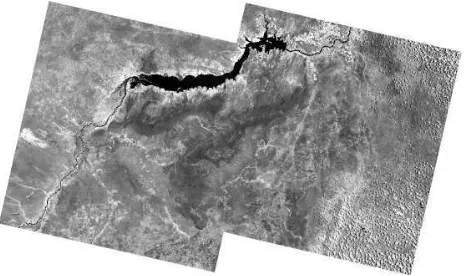
The images used in this work are from Thematic Mapper TM/Landsat-5 and OLI/Landsat-8, freely available from the United States Geological Survey (USGS, 2015). The images from both sensors are multispectral, which allows the discrimination of different targets through each band. The near infrared (NIR) band, bands 4 of TM/Landsat-5 and band 5 of OLI/Landsat-8, is the most appropriate for water discrimination. In addition, the normalized difference water index (NDWI) uses the NIR and the green bands, bands 2 of TM/Landsat-5 and band 3 of OLI/Landsat-8, to estimate the presence of water in the area covered by images. This paper uses the NIR and the green bands from TM/Landsat-5 from June of 2011 and OLI/Landsat-8 from June and October of 2015. The images have 30m of spatial resolution and 8/16 bits of radiometric resolution for TM/Landsat-5 and OLI/Landsat-8, respectively. To cover the whole of the Sobradinho reservoir, two images from each date were necessary and, for a better presentation, Figures 2, 3 and 4 present a mosaic of those images for each date (using NIR bands).
Figure 2: Mosaic of June 2011.
Figure 3: Mosaic of June 2015.
Figure 4: Mosaic of October 2015.
4. METHODOLOGY
To estimate the flooded area of the Sobradinho reservoir, we applied two techniques. The first technique to delimitate the flooded area involved applying the growth region operator using the NIR band images. This operator makes use of samples of the feature of interest provided by the user, to calculate a range of values for the image that can belong to the interest feature. Defining the value range, the operator starts a recursive search around the samples for points between the ranges to mark as interest features. Once marked, the points around are also analyzed. This search stops when there is nothing more to process, so the interest features were detected (Silva et al., 2012). However, this process creates some small holes in the detected feature, such as pepper noise, that needs to be removed. A morphological area open operation was performed to remove them and finish the detection of the reservoir in the images presented. This step ends the first technique applied.
The second technique used to delimitate the flooded area of the Sobradinho reservoir consisted in applying the NDWI index using the NIR and green bands according to the Equation 1. The equation resulted in a value in the range [-1;1] that was transformed to a binary image using the value 0 as the threshold. However, the binarization step produces a lot of salt noise. To remove the salt noise, the area close operation was performed finalizing the delimitation of the reservoir area.
(
)
(
)
NIR Green NDWI
NIR Green − =
+
(1)
Once the reservoir was detected, the next step in the methodology consisted of counting the number of points belonging to it. Since the spatial resolution of the images used is known, the flooded area of the reservoir can be calculated multiplying the total of pixels counted for the pixel area. The last step of the methodology consisted of analyzing the results obtained about the Sobradinho reservoir on the three dates analyzed and using two different methodologies, to quantify the amount of flooded area reduced during the drought period. Figure 5 represents the methodology steps.
Figure 5: Reservoir flooded area calculation methodology.
5. RESULTS
The first step in the methodology consisted of detecting the flooded reservoir area through satellite images. The NDWI results are spatially very similar to the growth region method, so it is very difficult to verify the differences visually. For exemplification, Figures 6, 7 and 8 present the detected area of water spread from the Sobradinho reservoir using growth region and mathematical morphology operators to improve the results of area determination.
Figure 6: Reservoir detected using the image from June 2011.
Figure 7: Reservoir detected using the image from June 2015.
Figure 8: Reservoir detected using the image from October 2015.
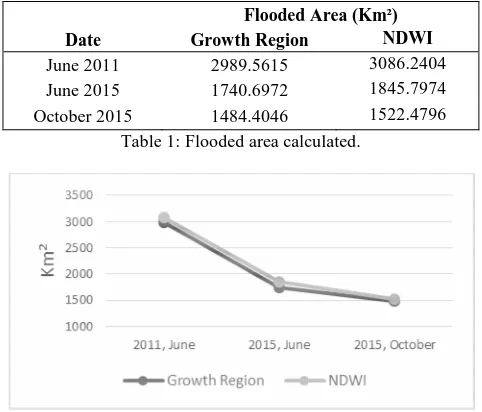
The number of pixels belonging to the reservoirs detected can be counted to calculate the flooded reservoir area. Furthermore, the flooded area reduced during the drought years was calculated to analyze the reservoir situation. Table 1 presents the calculated flooded areas of the Sobradinho Reservoir at different times, while Figure 9 presents a graphic comparison between the areas obtained by both methodologies.
Flooded Area (Km²) Date Growth Region NDWI
June 2011 2989.5615 3086.2404
June 2015 1740.6972 1845.7974
October 2015 1484.4046 1522.4796
Table 1: Flooded area calculated.
Figure 9: Graphical comparison: Growth Region versus NDWI.
The two delimitation techniques used, growth region and NDWI, provided different delimitation for the reservoir analyzed. Although different delimitations were obtained, both methodologies obtained similar area results for all dates calculated, enabling the analysis of the influence of the drought period in the Sobradinho dam. Comparing the calculated area values, it is easy to realize the hard times of drought that the region has experienced in recent years. It needs to be analyzed often to ensure the production of energy by the hydroelectric located in the reservoir. In addition, in four years of little rainfall, the flooded area of the reservoir reduced by around 1240 Km², which represents more than 40% of the flooded area in June 2011. However, four months later, in October, after the drought period, the reduced area of the reservoir was around 1500 Km² representing a reduction over 50% when compared to June 2011. The value calculated in October 2015 represents around 35% of reservoir capacity in the flooded area.
6. CONCLUSION
Images from remote sensing can provide reliable information concerning water bodies. Aiming to assess the effects of an extended drought period in the largest reservoir of the northeastern region of Brazil, we used Landsat imagery to evaluate the reservoir surface area on different dates.
Concerning the drought period faced by the Sobradinho dam region and, consequently, energy production, the flooded area of the reservoir was calculated to assess the effects of the drought. The flooded area showed evidence of the drought faced in recent years when the flooded area was reduced by more than 40% in four years. Furthermore, according to the last analysis performed in October 2015, we are aware of the risk of emptying the reservoir and stopping the production of electric energy, since the flooded area calculated represents only 35% of the reservoir capacity. In fact, electric energy production must be stopped before the reservoir is completely emptied. For this reason, assessing the reservoir situation should occur frequently to reduce the environmental risk.
This paper presents a simple and efficient methodology able to handle the temporal and spatial variability of reservoir storage, which can be used as tool in effective water management and in the decision-making process. Images are the most cost-effective tools for gaining an adequate knowledge of storage capacities without the need to carry out extensive field surveys. Direct investment in sustainable development is required to maintain energy efficiency at the same time as reducing adverse environmental and socio-economic impact.
ACKNOWLEDGEMENTS
The authors would like to thank PROPe, CAPES and FAPESP (Proc. nº 2013/25257-4 and 2014/24392-8) for financial support given to the development of this work
.
REFERENCES
Alsdorf, D. E.; Rodriguez, E., Lettenmaier, D. P. 2007. Measuring surface water from space. Reviews of Geophysics, 45, pp. 1–24.
ANA - Agência Nacional de Águas. Resolução n.411, de 22 de
setembro de 2005. Brazil R.; da Costa, S. C.; Rodrigues, V. 2012. Impacts of Sobradinho Dam, Brazil. In Tortajada C., Altinbilek, D., Biswas, A. K.
(eds.) Impacts of Large Dams: A Global Assessment, Berlin and
Heidelberg: Springer, pp. 153-170.
Eilander, D.; Annor, F.O.; Iannini, L.; van de Giesen, N. 2014. Remotely sensed monitoring of small reservoir dynamics : A bayesian approach. Remote Sens., 6, pp. 1191–1210.
Gao, H.; Birkett, C.; Lettenmaier, D. 2012. Global monitoring of large reservoir storage from satellite remote sensing. Water
Resource Research, 48, W09504.
Ke, Y.; Im, J.; Lee, J.; Going, H.; Ryu, Y. 2015. Characteristics of Landsat 8 OLI-derived NDVI by comparison with multiple satellite sensors and in-situ observations. Remote Sensing of
Environment, v. 164, pp. 298–313.
Ko, B. C.; Kim, H. H.; Nam, J. Y. 2015. Classification of Potential Water Bodies Using Landsat 8 OLI and a Combination of Two Boosted Random Forest Classifiers.
Sensors, 15, pp. 13763-13777.
Kosminsky, L.; Zuffo, A. C. 2009. O Nordeste Seco e a Transposição do rio São Francisco. Integração, 57, pp. 167-175.
Machado, C. J. S. 2003. Recursos Hídricos e Cidadania no Brasil: Limites, Alternativas e Desafios. Ambiente & Sociedade, 6(2), pp. 121-136.
Mialhe, F.; Gunnell, Y.; Mering, C. 2008. Synoptic assessment of water resource variability in reservoirs by remote sensing: General approach and application to the runoff harvesting systems of south India.Water Resources Research, 44, W05411.
Namias, J. 1972. Influence of Northern Hemisphere General Circulation on Drought in Northeast Brazil. Tellus, 24(4), pp. 336-342.
Okot, D. K. 2013. Review of small hydropower technology.
Renewable and Sustainable Energy Reviews, 26, pp. 515–52.
Prado Jr., F. A.; Athayde, S.; Mossa, J.; Bohlman, S.; Leite, F.; Oliver-Smith, A. 2016. How much is enough? An integrated examination of energy security, economic growth and climate change related to hydropower expansion in Brazil. Renewable
and Sustainable Energy Reviews, 53, pp. 1132–1136.
Ran, L.; Lu, X. X. 2012. Delineation of reservoirs using remote sensing and their storage estimate: an example of the Yellow River basin, China. Hydrol Process, 26, pp. 1215–122.
Rodrigues, L.; Sano, E.; Steenhuis, T.; Passo, D. 2012. Estimation of small reservoir storage capacities with remote sensing in the Brazilian Savannah Region. Water Resour.
Manag., 26, pp. 1-10.
Roy, D. P.; Wulder, M.A.; Loveland, T.R.; Woodcock, C.E.; Allen, R.G.; Anderson, M.C.; Helder, D.; Irons, J.R.; Johnson, D.M.; Kennedy, R.; et al. 2014. Landsat-8: Science and product vision for terrestrial global change research. Remote Sens.
Environ., 145, pp. 154–172.
Sawunyama, T.; Senzanje, A.; Mhizha, A. 2006. Estimation of small reservoir storage capacities in Limpopo River Basin using geographical information systems (GIS) and remotely sensed surface areas: Case of Mzingwane catchment. Phys. Chem.
Earth, v. 31, pp. 935-943
Schowengerdt, R. A. 2007. Remote Sensing: Models and
Methods for Image Processing. Academic Press, 3. ed. 560p.
Silva, B. B. da; Lopes, G. M.; Azevedo, P. V. 2005. Balanço de radiação em áreas irrigadas utilizando imagens Landsat 5 – TM.
Revista Brasileira de Meteorologia, 20(2), pp. 243 – 252.
Silva, E. A.; Cardim, G. P.; Best, R. 2012. Semiautomatic Algorithm to Extraction of Cartographic Features in Digital Images. Journal of Communication and Computer, 9, pp. 1247-1251.
Soares, E. 2013. Seca no Nordeste e a transposição do rio São Francisco. Geografias, 9(2), pp. 75-86.
Souza, J. A.; Conte, A. E.; Cavalcanti, A. J. C. T.; Vasconcelos, A. A. 2015. The Sobradinho Reservoir and the São Francisco River Control During Xingo Dam Construction. Document of Comitê Brasileiro de Barragens. Brazil http://www.cbdb.org.br/documentos/the_sobradinho_reservoir. pdf (03 Dec. 2015).
USGS – United State Geological Survey. Landsat. 2015. USA https://landsat.usgs.gov/