PR O C E S S I NG O F C R A W L E D UR B A N I M A G E R Y F O R B UI L D I NG US E
C L A S S I F I C A T I O N
P. T utzauera , N.Haalaa a
Institute for Photogrammetry, University of S tuttgart, Germany - ( Patrick.T utzauer, Norbert.Haala)@ ifp.uni-stuttgart.de
C ommission I I , W G I I /6
K E Y W OR D S : C rawling, S cene Understanding, D ata R egistration, D eep L earning, B uilding C lassification
A B S T R A C T :
R ecent years have shown a shift from pure geometric 3D city models to data with semantics. T his is induced by new applications ( e.g. V irtual/A ugmented R eality) and also a requirement for concepts like S mart C ities. However, essential urban semantic data like building use categories is often not available. W e present a first step in bridging this gap by proposing a pipeline to use crawled urban imagery and link it with ground truth cadastral data as an input for automatic building use classification. W e aim to extract this city-relevant semantic information automatically from S treet V iew (S V ) imagery. C onvolutional Neural Networks (C NNs) proved to be extremel y successful for image interpretation, however, require a huge amount of training data. Main contribution of the paper is the automatic provision of such training datasets by linking semantic information as already available from databases provided from national mapping agencies or city administrations to the corresponding façade images extracted from S V . F inally, we present first investigations with a C NN and an alternative classi fier as a proof of concept.
1. I NT R OD UC T I O N
Over the last few years, there has been a shift in photogrammetry and geoinformation applications from pure geometric reconstruction of virtual cities to ‘ intelligent’ data, models with semantics. B uilding Information Modeling ( B IM) and S mart C ities currently are hot topics. T hese applications feed on a multitude of data sources. However, this reveals a discrepancy at the same time - semantic information as required for a multitude of applications like urban planning and infrastructure management, includes building use, number of dwelling units and more (Hecht, 2014). A key information, from which several other metrics can be derived or at least be approximated, is the aforementioned building use. T herefore, we see a need for large-scale automatic building category classi fication. T he following paper proposes an approach to leverage Google‘ s region wide available S treet V iew data and link the inherent buildings with data from the digital city base map provided by the C ity S urvey Office S tuttgart. T o extract only building-relevant parts from the S treet V iew data we pre-process the images. T herefore, we utilize metadata provided by the S treet V iew A PI (Google D evelopers, 2017) and take advantage of a D eep L earning framework for semantic image segmentation (L ong et al., 2015) to analyze our data for relevant content. B ased on the information obtained in the crawling process we try to link image content with building polygons in the ground truth. T he outcome is a tuple of building images and its corresponding building category. T his data is then used to train a classifier. W ith the trained classifier it will be possible to predict building categories for new input images. F irst experiments are focused on investigating the potential of a B ag-of-W ords ( B oW ) approach and a pre-trained C NN.
F or now, we want to distinguish between four different building use types: residential ( purely residential use), commercial (purely commercial use), hybrid (mixture of commercial and residential use) and special use (which can be a building use of anything else, for example: churches, hospitals, museums, but also construction sites) . T he remainder of this paper is structured as follows: in section 2 we give a brief review on urban
classification using semantic segmentation and deep learning, section 3 describes our approach for the generation of training data to perform building use classification, section 4 shows some first results and in section 5 we discuss and draw some conclusions.
2. R E L A T E D W O R K
W ithin this section, several topics of related work are discussed. S ection 2.1 briefly gives an overview of the subject of Urban C lassification as a whole. In section 2.2 we more speci ficall y address S emantic S egmentation for Urban S cenes. F inally, section 2.3 investigates recent related work in the field of D eep L earning.
2.1 Ur ban C lassification
Urban classification can be hierarchically divided regarding the type of data acquisition the classification is based on. S atellite data provides information to perform classi fication with respect to different land use, based on hyperspectral analyses. (Hoberg et al., 2015) present a multitemporal and multiscale classi fication based on C onditional R andom F ields (C R F ). A s well as there are several approaches to perform building outline detection from satellite imagery ( Niemeyer et al., 2014). W ith aerial data acquisition, urban classification typically further diversifies – not only building outlines are extracted ( Ortner et al., 2007), but typicall y the scenery is divided into vegetation, ground and buildings. B esides pure 2D image segmentation, state-of-the-art is to use 3D point cloud information obtained from dense image matching (Haala and R othermel, 2015) or L iD A R ( Guo et al., 2011) . D ata obtained by L iD A R systems can either stem from airborne laser scanning ( A L S ) or terrestrial – either static (T L S ) or mobile ( ML S ) . Particularly ML S data is in the focus of urban classification and will be discussed in the next section.
2.2 S emantic S egmentation for Ur ban S cenes
W hen dealing with terrestrial urban data a great number of tasks is tackled in literature. In (W einmann et al., 2015) several
approaches (e.g. Nearest Neighbor, D ecision T ree, S V M, R andom F orest, Multilayer Perceptron) are investigated to classify M L S point clouds into semantic urban classes like façade, ground, cars, motorcycles, traffi c signs and pedestrians. T hey report that R andom F orests provide the best trade-off between accuracy and efficiency. W ang et al. (2015) presented an approach for holistic scene understanding, which reasons jointly about 3D object detection, pose estimation, semantic segmentation and depth reconstruction from a single geo-tagged image by using a holistic C R F . S imilarly, (X iao and Quan, 2009) use pairwise Markov R andom F ields across multiple views to perform semantic segmentation for S treet V iew images. W e are aware of the large body of literature concerning building façade segmentation and interpretation. However, since we do not aim on extracting individual façade parts such as windows and doors in the presented work, but rather want to determine a specific building use category, we are not covering this topic here. A n extensive overview on urban reconstruction, including façade interpretation can be found in (Musialski et al., 2013) .
2.3 D eep L ear ni ng
R ecent years have shown rapid development in C NN designs, performances and applications. D eep L earning is not only successfully applied in speech recognition (Hinton et al., 2012) and natural language processing (C ollobert and W eston, 2008) tasks but also state-of-the-art for image classification and segmentation nowadays (R ussakovsky et al., 2015, E veringham et al., 2012). R ecent work proposed an approach to generate full sentences that describe image content (K arpathy and F ei-F ei, 2015) . W ith regards to urban data, (W eyand et al., 2016) presented an approach that treats the photo geo-location problem as classi fication problem, in contrast to the more popular strategy of framing it as an image retrieval problem. T hey subdivide the earth into thousands of multiscale, geographical cells and train a deep network (PlaNet) using millions of geotagged images. F or a query image, PlaNet outputs the probability distribution over the surface of the earth. T he same task is addressed by ( Hershey and W ulfe, 2016). T hey use a GoogL eNet model, pre-trained on a scene classification data set, to geo-locate images taken from GS V from 10 different cities. T hey report human exceeding accuracy of 75%. T he work of ( Movshovitz-A ttias et al., 2015) uses S V images for the classi fication of storefronts, more specificall y the classification into business categories. T hey create a large training data set by propagating business category information with help of an ontology that uses geographical concepts. F or learning, they also use a network based on GoogL eNet. W ith a top1 accuracy of 69%, they are approximately at human level.
3. R E G I S T R A T I O N OF I M A G E D A T A W I T H B UI L D I NG US E C A T E G O R Y
T his part is structured as follows: in section 3.1 we describe the crawling process to extract georeferenced façade images from S V data. S election and preprocessing of i mages to provide suitable image patches for classi fier training is covered in section 3.2. F inally, in section 3.3 we elaborate on linking image patches to existing semantic information using coarse georeferencing information from S treet V iew.
3.1 Ur ban I mage C r awling
A crucial element in performing classification tasks is to obtain an appropriate number of training samples. F requently, these are available from datasets and benchmarks within the fields of
C omputer V ision and Machine L earning. T he S UN database (X iao et al., 2010) consists of almost 4000 object categories but there are only slightly over 1000 images containing buildings. ImageNet ( D eng et al., 2009) provides over 20,000 indexed synsets ( synonymous word fields) and over 14 million images in total.
T here are also several benchmarks for urban scenes – (Geiger et al., 2013) developed a mobile mapping platform and host K IT T I, a benchmark with data for a variety of vision tasks from stereo matching, over scene flow to semantic segmentation. L ikewise, the C IT Y S C A PE S dataset provided by (C ordts et al., 2016) contains scenes from 50 cities with corresponding semantic pixelwise annotations for each frame, obtained by a windshield-mounted stereo camera system. F or these datasets, GPS information of the car’s trajectory is available. However, for our task these datasets are not suitable since we aim on assigning specific usage categories to buildings. W e take another path and make use of municipal surveying data in combination with a publicly available image source. T his way we can narrow down amd merge the variety of building categories, and enforce correctness of ground truth. T here are several reasons why we pursue the proposed framework at all, when there are already huge C NNs that classify hundreds of categories with a reasonable level of correctness, including classes like apartment building or office building. F irst, those very deep C NNs developed by companies are fed with massive amounts of training data – not everybody can provide or produce those huge collections of training examples. Moreover, large C NNs have a broad range of category types they cover, while our work aims on a small subset of those classes. W e are not interested in classifying a plethora of different categories, but rather very few, with potentially high intra-class variance. T he evaluation of state-of-the-art approaches with a multitude of classes is frequently based on the top5 error, however, since we aim on the determination of a rather limited number of classes at a rather high reliability, the top1 error is our main interest.
T he actual crawling is implemented in J ava S cript based on (A shwell, 2015) modified for our use. A s output from the crawling process, we obtain a list of positions (longitude ,lat it u d e ) and headings , where =1,..., , with as the total number of crawl positions. B y dragging the Google Maps marker one can define the initial crawling position. Using the S treet V iew A PI the crawler searches for the next available panorama based on the current position. F igure 1 shows the crawling interface with the initial S treet V iew on the left and all crawled panoramas on the right. W e use two different modes of crawling: panorama-link based and random sampling. T he first method successively visits the link nodes stored in the current panorama until a predefined total number of panoramas is
fetched. However, this method only returns the center heading of the street view car for this position. T herefore, when using F igure 1. L eft: Initial crawling position. R ight: Markers depicting each crawled position after process has finished.
panorama-link based method we add 90° to – thereby we obtain frontal views of the buildings. W hen using the random sampling technique, we generate random offsets for latitude and longitude, thereby performing a random walk of the geographical position. T o prevent from excessive divergence we reset to the initial position in predefined intervals. B ased on the randomly sampled positions we then search for the nearest panorama and calculate the heading. Outcome of both crawling processes is a list of 2D geographic coordinates and a corresponding heading . W e use this data together with the parameters pitch Φ and field of view (F OV ) to query an image Ι as part of the panorama via the S treet V iew A PI. Φ is measured positively looking upwards with respect to the camera’s initial horizontal position.
W e chose Φ =15° and = =90° to
ensure that also larger buildings are covered.
3.2 E xtr action of buildi ng-r elevant i mages
W e aim on the extraction of good training data, which are images with clear view onto only one single building in center. However, many of the initial crawled images do not meet those requirements (see also section 3.2.1 and section 3.2.2) .
T hus, after fetching the S treet V iew data we preprocess all images Ι… to extract only samples with relevant content. One tool we use to analyze the images i s a reimplementation of a F ully C onvolutional Network (F C N) (L ong et al., 2015) provided by (C aesar and Uijlings, 2016). T his end-to-end/pixel-to-pixel trained network uses “raw” images as input and produces a semantic pixelwise labelling. W e use the F C N-16s S IF T F low model, which is based on the S IF T F low dataset with roughly 3000 images and their corresponding pixel labels. In total, there are 33 semantic categories like awning, balcony, bird, over mountain, person to tree and window. However, there are not only semantic, but also geometric labels – the F C N can learn a joint representation and predict both. W e are not interested in all of those classes. E ffectively, we only want to detect whether or not a building is the actual main content of the current image. Hence, we merge several classes – for example, we merge awning, balcony and window to the building class. Similarly, we merge grass and tree to the plant class.
3.2.1 Occlusions: A s stated in the previous section, we have to ensure, that the main image content is the building of interest. T hus, as a first step of processing the crawled urban imagery, we use the described F C N to perform a pixelwise segmentation. B y using the merged classes introduced in the previous section we obtain results like depicted in F igure 2 on the right. If the main content of our segmented image consists of plant or car pixels, we discard this image.
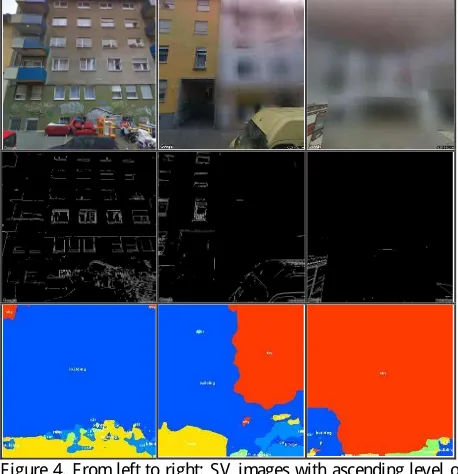
3.2.2 B lur red I mages: E ach building owner has the legal right to demand Google to make his or her private property unrecognizable within the S treet V iew data. Google approaches this the same way they anonymize persons – by blurring the affected buildings. Obviously, we want to discard those images since there is no actual content provided. T here has been a lot of work on edge-based blur detection ( Ong et al., 2003; Narvekar et al., 2011) . In fact, edge detection delivers quite consistent results in our case, as shown in F igure 4. However, as we incorporate the aforementioned F C N, we can make use of a particular property when evaluating images. In that framework, blurred regions are typicall y classifi ed as sky or sea pixels and can thus be detected easily.
F igure 4. F rom left to right: S V images with ascending level of blurriness. F rom top to bottom: S V input data, edge images, output of the F C N evaluation. T he colour coding in the last row is the same as in F igure 2.
3.3 L ink age of images with cor r ect gr ound tr uth
Our ground truth data consists of a 2D shape file with ground plan polygons for each building, enriched with several aspects of semantic information like address, communal district, building block number and, especially of our interest, building use. F or each building polygon we calculate its centroid , where = 1,…, , with as the total number of buildings in the data set. F igure 2. Input image and corresponding output from the F C N
evaluation. T he semantic class building is depicted in blue, sky in red, road in yellow, plant in green and car in bright blue, respectively.
F igure 3. L eft: B uilding Polygons B 0 … of Neighbourhood . ( , based on crawling position 0 ( depicted with a red cross, see also F igure 6) ; R ight: C orresponding S V image Ι.
Once it is ensured, that there is actual building content contained in Ι, we have to link it to the correct corresponding ground truth. Here, we make use of the previously gathered data from the crawling process - we know the actual positions , for each obtained S V image. However, these positions are in geographic coordinates. Ground truth data is located in the Gauß-K rüger coordinate system. T herefore, we perform a datum transformation between geographic coordinates and the reference coordinate systems from the national mapping agency. S ubsequently, for each we carry out a nearest neighbour (NN) search in the ground truth dataset based on the centroids for each building polygon and extract candidates … T hose buildings depict our neighbourhood , in which we have to find the actual building displayed in the image, denoted as Γ. T o obtain the correct Γ we have to address several issues, covered in the following now.
3.3.1 I nteri or s: In the crawling process, especially the random sampling approach is not limited to the required street level imagery but potentially also provides images from interior panoramas. T o eliminate such data, typicall y covering shops, public institutions and suchlike, we take and perform a point-in-polygon for each … in . If the test returns true for one of the polygons, Ι contains indoor scenery and is discarded. However, too limited geolocati on accuracy of these interior panoramas might lead to an actual position outside the building. In future work we have to counteract this problem since the semantic segmentation F C N is trained for outdoor scenes and hence does not provide useful information in this case. Once interiors are handled we make use of the heading information to construct a line of sight with the corresponding predefined
/. W e li mit the length of to 20 meters, to ensure Γ is the central content of Ι. In the next step, we determine whether
hits any of the polygons .
3.3.2 M ultiple H its and V iewing A ngle D ependency: T o verify whether or not there exists a suitable Γ, we use the line of sight and perform a test for intersection with B 0 …. If there are intersections, we call this a hit … . However, it is possible that we obtain multiple hits. T he second hit is likely to be the intersection of the same on its rear or side part. F or multiple buildings in close proximity, there can be more than two hits. If this occurs, we si mpl y sort … by distance to and take the candidate with the shortest E uclidean distance as our correct hit . Multiple hits are more likely i f the viewing angle onto Γ is
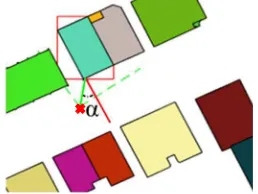
very fl at. Not only therefore we want to avoid flat viewing angles but mainly due to the reason, that we do not consider those samples as good training input. Ideally, we aim on quasi-frontal shots of the building façades. T hus, we proceed as follows. F irst, we determine our hit and detect the edge where Γ is intersected. T his edge is considered our façade plane. On the location we construct the façade normal and determine the angle between and , representing our viewing angle (F igure 6). Ideally, would be close to zero. T he viewing angle depicted in F igure 3 is still in order, however if exceeds a certain threshold we discard this image candidate. In the future, we plan on not only considering the central line of sight but also the bounding rays for our /, in cases where the hit of might not represent the actual central building content but rather a different building polygon within the bounds of the /. F igure 5 depicts crawled imagery for all four classes. T he first two rows show examples we consider as good, whereas the last row demonstrates some negative examples.
4. S T R E E T -V I E W B A S E D I M A G E C L A S S I F I C A T I ON A t the moment, we limit our classification problem in terms of the number of classes. T hus, one mi ght argue about the classifier of choice. F rom our point of view it is worthwhile not to restrict ourselves to handcrafted features like HOG, S IF T or S UR F but also investigate in learned features from C NNs. S everal works show, that on small-scale datasets with homogenous distribution, performance of handcrafted features can be considered on a par with learned ones. W hereas increased and more heterogeneous
datasets lead to superiority of C NNs (A ntipov et al., 2015; F ischer et al., 2014). S ince we are crawling S treet V iew images, we effectively have a vast amount of training data available – our limiting factor is the availability of correct ground truth for the building use.
4.1 B ag-of-W or ds C lassification
F or comparison, we applied an already existing implementation of a B ag-of-W ords classi fier, based on S UR F features and a multiclass linear S V M. T he underlying training and test database is described in section 4.2 in more detail. T he original training set is randomly split in 80% actual training and 20% validation set. S UR F features for each image are extracted and subsequently clustered using K -Means to create the visual vocabulary. B ased on this vocabulary a multiclass linear SV M is trained on the training set and evaluated on the validation set. A verage accuracy on the validation set is only 62%, same holds for average accuracy on the training set, which is at 63%. T his classifier is now applied to a test set with available ground truth (the same as in section 4.2) . T he average accuracy here is at 41%. Obviously, those results are not really useful, thus an alternative approach is required.
F igure 5. C olumns: Our four classes ( f.l.t.r): commercial, hybrid, residential, special use. T he fi rst two rows depict samples considered to be good, whereas the last row shows bad examples.
F igure 6. V iewing angle dependency. T he red bounding box depicts the detected Γ. T he straight line emerging from Γ is the façade normal, whereas is depicted in green. is the enclosed angle between those lines.
4.2 Pr e-tr ai ned C onvolutional Neur al Networ k
T he data we use for training and testing the C NN is the same as in section 4.1, therefore we further elaborate on it here.
Our training set consists of 8000 images (4 classes, each 2000 images) and the validation set contains at least 70 images per class. However, the original training set is smaller – roughly 2200 images with a distribution of 19% commercial, 22% hybrid, 43% residential and 16% special use. T hus, we use data augmentation to provide an equal number of training samples for each class. T herefore we randomly pick images and randomly perform one of these three manipulations: 1.) flip image on its vertical axis, 2.) crop and resize to original dimension, 3.) define random 2D affine transformation (in certain range), warp the i mage and resize to original dimension.
F or our first proof of concept we use transfer learning on the imagenet-vgg-f model from (C hatfield et al., 2014). F or further information about the architecture, we would like to refer to the reference. T o adapt this network to our needs we remove the last two layers ( the fully connected fc8 layer and the softmax layer) and add a custom fc8 layer, which only has an output data depth of 4 as opposed to the original output depth of 1000. A s final layer we add cross-entropy because we want to determine loss. A dditionally, we add two dropout layers between fc6 and fc7, as
well as between fc7 and fc8, with a dropout rate of 0.5 each – since they were probably removed in the testing phase of the original network. D uring training phase, we use jittering to reduce overfitting. W ithin each training batch we randoml y flip and crop images. On top of that, we apply an alternation of the R GB channel intensities using PC A , as reported in (K rizhevsky et al., 2014). W e use a batch size of 40 images and a fixed learning rate =0.0001. A fter 96 epochs, the top1 training error
P
r
e
d
i
c
t
e
d
Ground T ruth
C ommercial Hybrid R esidential Special Use
C
o
m
m
e
r
c
i
a
l
H
y
b
r
i
d
R
e
s
i
d
e
n
t
i
a
l
S
p
e
c
i
a
l
U
s
e
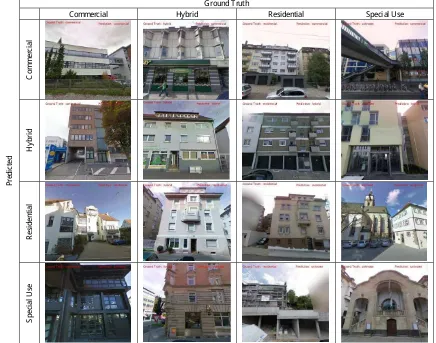
F igure 8. Predictions of the approach described in section 4.2, depicted in the shape of a classification matrix. T he main diagonal entries are correct predictions. Please note how some of the actual ground truth labels themselves are sometimes ambiguous or the correct class is even for humans hard to identify. E xample 1: row 2, column 4 was classi fied as hybrid but has the ground truth label special use – actually this is a care facility and we class the entirety of care facilities as special use. E xample 2: row 4, column 3 is clearl y a building under construction, though the residential label is obviously correct – but we trained the network on several construction sites with the label special use, therefore the respective prediction. (Note: special use class is labelled with unknown in the images here.)
F igure 7. T op1 error after 96 epochs. T raining is depicted in blue, validation in red.
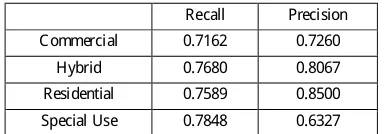
is at 0.725% and the top1 validation error is at 21.4% (F igure 7). W e run this on a test set (the same as for the B oW classifier), which however also contains images from the evaluation set. Here, we obtain an average accuracy of 75.9%. In T able 1, the results for precision and recall are depicted. W ith 85%, the precision for residential is best, whereas the special use category is with 63.3% at the lower end. T his is most likely due to the high intra-class variance of the special use category, whereas the residential class is more homogenous in terms of visual similarity. In F igure 8, some examples of the classification are provided. W e depict correct and wrong examples in terms of a confusion matrix. C olumns represent ground truth, rows are predictions from the C NN, correspondingly. C orrectl y classified images are therefore displayed on the main diagonal, all remaining images are wrong classifications.
R ecall Precision
C ommercial 0.7162 0.7260
Hybrid 0.7680 0.8067
R esidential 0.7589 0.8500
Special Use 0.7848 0.6327
T able 1. Precision and recall after evaluation on our test set ( a value of 1.0 equals 100%).
T r ansfer to unk nown data r epr esentation type: F or comparison purposes we additionally applied our trained net to data we used in a previous test, where humans should classify input images into respective building categories ( T utzauer et al., 2016) . T his database additionally provided two alternative representations for building objects – firstl y screenshots of textured meshes from Google E arth and secondly screenshots of manually modelled untextured L OD 3 building models. W e picked the untextured L OD3 models for input to the C NN, since they only have an abstract resemblance with the original training data. In total we evaluated almost 80 images and achieve an average accuracy of 63.6%. T here are two important issues: a) the C NN has not seen this representation type at all during training phase and b) the L OD 3 models additionally contain several samples with class-specific geometric properties on which the network was not trained. However, this shows the transferability of the network to even a completely different representation type in the input data. S ome examples are depicted in F igure 9.
5. C ONC L US I O NS A ND F UT UR E W O R K In this paper, we successfully linked Google S treet V iew i magery to a database that contains semantic information for every contained building polygon. Such databases are available for a number of cities. Hence, it is potentially possible to generate large amounts of training data, which is a prerequisite for the successful application of D eep L earning frameworks for classification. In a first test, it was verified, that this approach can be promising, however future work will aim exactl y on that very topic. In order to do so, some additional work has to be done in the processing step. Indoor scenes with limited geo-location accuracy have to be detected and eliminated. T he incorporation of the bounding / rays might help in cases where the hit of is not representing the actual central building content. Moreover, the F C N used for image analyses could be replaced by an object detector framework like F aster R -C NN (R en et al., 2015) , since we are ultimately only interested in the bounding boxes of buildings. However, pre-trained models do not contain a building class yet. T herefore, such a network has to be trained from scratch. In our investigations, we found that semantic data
provided by the city administration can be ambiguous or even erroneous. T his is an issue, which at the same time shows the necessity of the proposed approach of automatic building use classification. F or now, obviously wrong or ambiguous samples were discarded in an interactive post-processing step to provide a reasonable training input. In the future, we aim on training a variety of architectural styles as well as performing the training phase in one city and testing in a different one to investigate transferability. F or that purpose we want to train our own C NN architecture from scratch. S ince we ultimately want to further diversify from the current four classes, it is conceivable to leverage the original building-related segmentation classes from the F C N (awning, balcony, door, window) as a meta-classi fier. A s an application for our approach, we think of area-wide enrichment of crowd-source data like OS M building polygons.
A C K NO W L E D G E M E NT S
W e would like to thank the German R esearch F oundation (D F G) for financial support within the project D 01 of S F B /T ransregio 161.
R E F E R E NC E S
A ntipov, G., B errani, S.-A ., R uchaud, N., D ugelay, J .-L ., 2015.
L earned vs. Hand-C rafted F eatures for Pedestrian Gender
R ecognition, In: Proceedings of the 23rd AC M International
C onference on Multimedia, MM ’15. A C M, New Y ork, NY , USA ,
pp. 1263–1266. doi:10.1145/2733373.2806332
A shwell, P. 2015. Street V iew C rawler,
https://github.com/peterashwell/streetview-crawler, 2015.
C aesar, H. and Uijlings, J ., 2016. Matconvnet-C alvin
https://github.com/nightrome/matconvnet-calvin
C hatfield, K ., Simonyan, K ., V edaldi, A ., Z isserman, A ., 2014.
R eturn of the D evil in the D etails: D elving D eep into C onvolutional
Nets. arX iv:1405.3531 [ cs] .
C ollobert, R ., W eston, J ., 2008. A Unified A rchitecture for Natural
L anguage Processing: D eep Neural Networks with Multitask
L earning, In: Proceedings of the 25th International C onference on
Machine L earning, IC ML ’08. A C M, New Y ork, NY , USA , pp. 160–
167. doi:10.1145/1390156.1390177
C ordts, M., Omran, M., R amos, S., R ehfeld, T ., E nzweiler, M.,
B enenson, R ., F ranke, U., R oth, S., Schiele, B ., 2016. T he C ityscapes
D ataset for Semantic Urban Scene Understanding, In: Proceedings
of the IE E E C onference on C omputer V ision and Pattern
Recognition, pp. 3213-3223. arX iv:1604.01685 [ cs.C V ]
F igure 9. R esults from prediction of pre-trained C NN. T he first row shows some correct predictions, f.l.t.r: commercial, residential, special use. T he second row depicts wrong classifications, f.l.t.r. denoted in ground truth vs predicted: residential vs commercial, hybrid vs residential, residential vs special use (note: special use is labelled with unknown here) .
D eng, J ., D ong, W ., Socher, R ., L i, L .J ., L i, K ., F ei-F ei, L ., 2009.
ImageNet: A large-scale hierarchical image database, In: 2009 IE E E
C onference on C omputer V ision and Pattern Recognition, pp. 248–
255. doi:10.1109/C V PR .2009.5206848
E veringham, M., V an Gool, L ., W illiams, C . K . I., W inn, J . &
Z isserman, A . 2012. T he PA SC A L V isual Object C lasses C hallenge
2012 ( V OC 2012) R esults,
http://www.pascal-network.org/challenges/V OC /voc2012/workshop/index.html
F ischer, P., D osovitskiy, A ., B rox, T ., 2014. D escriptor Matching
with C onvolutional Neural Networks: a C omparison to SIF T .
arX iv:1405.5769 [ cs] .
Geiger, A ., L enz, P., Stiller, C . and Urtasun, R ., 2013. V ision meets
robotics: T he K IT T I dataset. The International J ournal of Robotics
Research, 32( 11) , pp.1231-1237. doi:10.1177/0278364913491297
Googl e D evel opers. Street V iew Service | Google Maps J avaScript
A PI | Google D evelopers, 2017.
https://developers.google.com/maps/documentation/javascript/street
view.
Guo, L ., C hehata, N., Mallet, C . and B oukir, S., 2011. R elevance of
airborne lidar and multispectral image data for urban scene
classification using R andom F orests. ISPRS J ournal of
Photogrammetry and Remote Sensing, 66(1), pp.56-66.
doi:10.1016/j.isprsjprs.2010.08.007
Haala, N. and R othermel, M., 2015. Image-based 3D Data C apture
in Urban Scenarios. In: Proc. Photogrammetric Week 2015.
W ichmann, B erlin/Offenbach, pp. 119-130.
Hecht, R obert, 2014. A utomatische K lassifizierung von
Gebäudegrundrissen. D issertation, L eibniz-Institut für ökologische
R aumentwicklung. R hombos-V erlag.
Hershey, D . and W ulfe, B ., 2016 R ecognizing C ities from Street
V iew Images.
Hinton, G., D eng, L ., Y u, D ., Dahl, G.E ., Mohamed, A .R ., J aitly, N.,
Senior, A ., V anhoucke, V ., Nguyen, P., Sainath, T .N. and K ingsbury,
B ., 2012. Deep neural networks for acoustic modeling in speech
recognition: T he shared views of four research groups. IE E E Signal
Processing Magazine, 29(6), pp.82-97.
doi:10.1109/MSP.2012.2205597
Hoberg, T ., R ottensteiner, F ., F eitosa, R .Q. and Heipke, C ., 2015.
C onditional random fields for multitemporal and multiscale
classifi-cation of optical satellite imagery. IE E E Transactions on Geoscience
and Remote Sensing, 53(2) , pp.659-673.
doi:10.1109/T GR S.2014.2326886
K arpathy, A . and F ei-F ei, L ., 2015. D eep visual-semantic alignments
for generating image descriptions. In: Proceedings of the IE E E
C onference on C omputer V ision and Pattern Recognition, pp. 3128–
3137.
K rizhevsk y, A ., Sutskever, I., Hinton, G.E ., 2012. Imagenet
classification with deep convolutional neural networks. In: Advances
in Neural Information Processing Systems, pp. 1097–1105.
L ong, J ., Shelhamer, E . and D arrell, T ., 2015. F ully convolutional
networks for semantic segmentation. In: Proceedings of the IE E E
C onference on C omputer V ision and Pattern Recognition, pp.
3431-3440. arX iv:1411.4038 [ cs.C V ]
Movshovitz-A ttias, Y ., Y u, Q., Stumpe, M.C ., Shet, V ., A rnoud, S.
and Y atziv, L ., 2015. Ontological supervision for fine grained
clas-sification of street view storefronts. In: Proceedings of the IE E E C
on-ference on C omputer Vision and Pattern Recognition, pp.
1693-1702.
Musialski, P., W onka, P., A liaga, D .G., W immer, M., van Gool, L .
and Purgathofer, W ., 2013. A Survey of Urban R econstruction. C om
-puter Graphics F orum 32, pp. 146–177. doi:10.1111/cgf.12077
Narvekar, N.D . and K aram, L .J ., 2011. A no-reference image blur
metric based on the cumulative probability of blur detection ( C PB D).
IE E E Transactions on Image Processing, 20(9), pp.2678-2683.
doi:10.1109/T IP.2011.2131660
Niemeyer, J ., R ottensteiner, F . and Soergel, U., 2014. C ontextual
classification of lidar data and building object detection in urban
ar-eas. ISPRS journal of photogrammetry and remote sensing, 87,
pp.152-165. doi:10.1016/j.isprsjprs.2013.11.001
Ong, E ., L in, W ., L u, Z ., Y ang, X ., Y ao, S., Pan, F ., J iang, L . and
Moschetti, F ., 2003. A no-reference quality metric for measuring
im-age blur. In: Signal Processing and Its Applications, 2003.
Proceed-ings. Seventh International Symposium on, pp. 469-472.
doi:10.1109/ISSPA .2003.1224741
Ortner, M., D escombes, X . and Z erubia, J ., 2007. B uilding outline
extraction from digital elevation models using marked point
pro-cesses. International J ournal of C omputer V ision, 72(2), pp.107-132.
doi:10.1007/s11263-005-5033-7
R en, S., He, K ., Girshick, R . and Sun, J ., 2015. F aster r-cnn: T owards
real-time object detection with region proposal networks. In:
Ad-vances in neural information processing systems, pp. 91-99.
arX iv:1506.01497 [ cs].
R ussakovsky, O., D eng, J ., Su, H., K rause, J ., Satheesh, S., Ma, S.,
Huang, Z ., K arpathy, A ., K hosla, A ., B ernstein, M. and B erg, A .C .,
2015. Imagenet large scale visual recognition challenge.
Interna-tional J ournal of C omputer V ision, 115(3), pp.211-252.
arX iv:1409.0575 [ cs] .
T utzauer, P., B ecker, S., F ritsch, D ., Niese, T ., and D eussen, O.,
2016. A Study of the Human C omprehension of B uilding C ategories
B ased on D ifferent 3D B uilding R epresentations. Photogramm
etrie-F ernerkundung-Geoinformation, 2016(5-6) , pp. 319-333.
doi:10.1127/pfg/2016/0302
W ang, S., F idler, S. and Urtasun, R ., 2015. Holistic 3d scene
under-standing from a single geo-tagged image. In: Proceedings of the
IE E E C onference on C omputer Vision and Pattern Recognition, pp.
3964-3972. doi:10.1109/C V PR .2015.7299022
W einmann, M., J utzi, B ., Hinz, S. and Mallet, C ., 2015. Semantic
point cloud interpretation based on optimal neighborhoods, relevant
features and efficient classifiers. ISPRS J ournal of Photogrammetry
and Remote Sensing, 105, pp.286-304.
doi:10.1016/j.is-prsjprs.2015.01.016
W eyand, T ., K ostrikov, I. and Philbin, J ., 2016. PlaNet - Photo
Geo-location with C onvol utional Neural Networks. In: E uropean C
onfer-ence on C omputer V ision, pp. 37-55. Springer International
Publish-ing. doi:10.1007/978-3-319-46484-8_ 3
X iao, J . and Quan, L ., 2009. Multiple view semantic segmentation
for street view images. In C omputer V ision, 2009 IE E E 12th
Inter-national C onference on, pp. 686-693.
doi:10.1109/IC C V .2009.5459249
X iao, J ., Hays, J ., E hinger, K .A ., Oliva, A . and T orralba, A ., 2010.
Sun database: L arge-scale scene recognition from abbey to zoo. In:
C omputer vision and pattern recognition (C V PR), 2010 IE E E
con-ference on, pp. 3485-3492. doi:10.1109/C V PR .2010.5539970