REPORT OF THE WORLDWIDE SURVEY
ON TEACHING PHY SIOLOGY
T
his report by George G. Somjen, for the Commission on Teaching Physiology, International Union of Physiological Sciences, presents a summary of answers received to a questionnaire concerning the state of Physiology Teaching. One hundred seventeen responses have been received from fifty countries. The results have been tabulated and contain information about the teaching methods and resources as well as the commitment in time and effort by the teaching staff. Free-ranging, sometimes pithy, comments made by the respondents have been excerpted and are included. AM. J. PHYSIOL. 277 (ADV. PHYSIOL. EDUC. 22): S6–S14, 1999.GENERAL REMARKS
This report is based on responses to a questionnaire distributed between 1994 and 1997. Over 350 ques-tionnaires have been sent out, and 117 responses were received from 50 countries, the majority during 1995, with a second, smaller batch following the 1997 Repino (Russia) Workshop on Teaching Physiology. I cannot claim this to be either a comprehensive survey or a statistically valid random sampling. Let us call it a cross section that, I hope, can provide the reader with an impression of the range of the teaching methods used and the conditions under which instruc-tion is given in physiology departments around the globe.
Questions asked in the five-page questionnaire were grouped under the following headings:
• The physiology course(s) you teach
• Students [in your course(s) are] enrolled in which faculty, working toward which degree?
• Personnel teaching the course(s)
• Course structure
• Course content
• Materials available to the students
• Assessment of students
• Professional effort (percentage of your time spent in various activities)
• Evaluation and comment
Under the heading ‘‘Evaluation and comment’’ respon-dents were encouraged to jot down personal opinions on the state of the profession, its present and future, and possible improvements. Needless to say, the deficiencies of the questionnaire became apparent as I was processing the data. It may be useful to repeat this process in a few years’ time to follow the changes in the state of the profession. I will be happy to advise whoever will undertake the task on ways to improve the method of data collection.
For this report I compiled numerical summaries of the answers that are amenable to enumeration.
NOTES ON SUMMARIES
The medical courses were subdivided by geographic region. Because of the small number of responses for the others, separation by region was not meaningful for them.
The number of responses to any particular question does not add up to the total number of questionnaires returned. In part, this is because some of the forms were not completely filled in, and also because some-times a question was not applicable to some of the teaching systems. A case in point is a school at which physiology is not taught in a single comprehensive course but in a series of separate small courses; in this instance there was no way to count the number of lectures or practical exercises in a way that would be comparable to the other schools.
NUMBER OF RESPONSES BY REGION AND COUNTRY
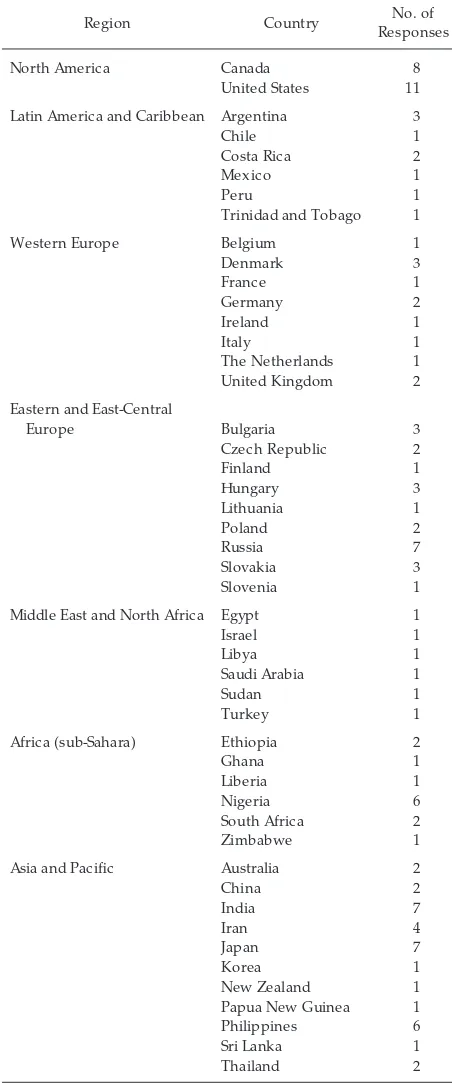
The numbers of responses received from each coun-try are entered in Table 1 under their respective geographic regions. This grouping may seem arbitrary because social and economic conditions are not uniform within continents. I have considered classify-ing countries under ‘‘first, second, and third world’’ or ‘‘developing, emerging, and affluent,’’ but anomalies could, again, not be avoided. In the end, geographic proximity seemed the least subjective criterion or, at least, the best compromise.
COURSE STRUCTURE
The entries in Tables 2 and 3 represent averages followed in parentheses by the number of responses within the category. For example, reports received from 7 North American medical physiology courses showed an average of 72 lectures given per physiology course. Six of the seven North American medical schools reported that practical (laboratory) exercises were given in the medical course, and the average number of practical sessions in these six courses was seven per course. (Zero entries were ignored in the computation of mean values.) Only three of these six courses offered animal experiments within the laboratory exercises, with on average just one animal lab per course.
Table 2 shows medical physiology courses according to geographic regions. Table 3 compares medical, undergraduate sc ienc e, and ‘‘other’’ physiology
TABLE 1
Number of r esponses by r egion and country
Region Country No. of
Responses
North America Canada 8
United States 11
Latin America and Caribbean Argentina 3
Chile 1
Costa Rica 2
Mexico 1
Peru 1
Trinidad and Tobago 1
Western Europe Belgium 1
Denmark 3
Middle East and North Africa Egypt 1
Israel 1
Libya 1
Saudi Arabia 1
Sudan 1
Turkey 1
Africa (sub-Sahara) Ethiopia 2
Ghana 1
Liberia 1
Nigeria 6
South Africa 2
Zimbabwe 1
Asia and Pacific Australia 2
China 2
Papua New Guinea 1
Philippines 6
Sri Lanka 1
courses, whereas the grand averages are in the col-umn labeled ‘‘all.’’
For reasons mentioned earlier, it is not meaningful to compute statistical significance for the differences among the averages. Nonetheless, it appears that the number of lectures per medical course is greater in the Middle East, Africa, and Asia than in the Americas.
COURSE CONTENT
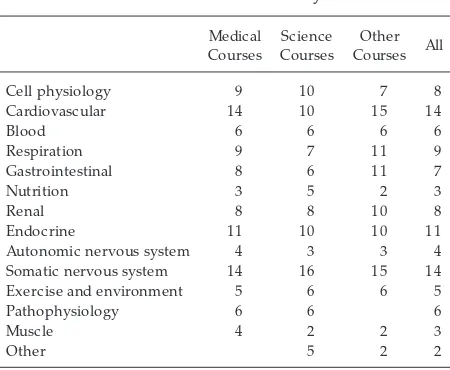
Under this heading, the questionnaire asked for the fraction of time devoted to various major areas of physiology. Some respondents entered percentages; others reported the number of lectures devoted to
each chapter. For Tables 4 and 5, all entries have been converted to a percentage of the total. There were inevitable inconsistencies among responses. For ex-ample, ‘‘blood’’ is often taught under ‘‘circulation’’ and ‘‘nutrition’’ under ‘‘gastrointestinal tract’’ (or not at all); neurophysiology is often separated from the physiology course and taught in an integrated neurosci-ence course. Tables 4 and 5 show the mean values of only those courses that do assign a defined fraction of teaching time to a particular subject; ‘‘zero’’ entries were, again, ignored. Because of the lack of homogene-ity, the columns of averages in Table 4 do not add up to 100%. To facilitate comparisons, for Table 5 the data for ‘‘medical,’’ ‘‘science,’’ and ‘‘all’’ columns have been corrected (i.e., prorated) so as to add up to 100%.
Perhaps not surprisingly, there is less variation among the columns of numbers in Tables 4 and 5 than among those in Tables 2 and 3. Even while laboring under very different conditions, there is a measure of consen-sus among physiology teachers on the weight of the diverse chapters that make up our discipline.
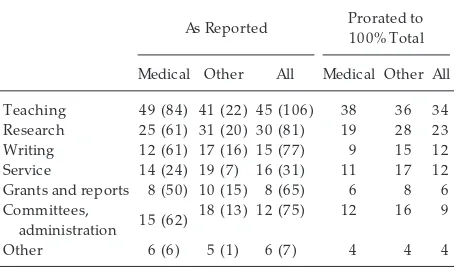
PROFESSIONAL EFFORT
In Tables 6 and 7 the entries show the means of the fraction of time spent on each category of professional activity, followed in parentheses by the numbers reporting. (Absolute time in hours was not asked; when it was reported, it was converted to a percent-age.) The time spent in teaching was further divided in subcategories as shown in square brackets.
TABLE 2
Course structur e: Medical courses
Region
Data are means; nos. in parentheses indicate number of responses within categories.
TABLE 3
Course structur e: Summary
Medical
Number of lectures 114 (77) 49 (18) 37 (14) 94 (109) Practical exercises 39 (75) 16 (18) 13 (10) 33 (101) Animal laboratories 12 (54) 9 (15) 5 (8) 11 (77) Human experiments 12 (57) 8 (12) 6 (10) 11 (79) Computer exercises 3 (26) 1 (7) 1 (7) 2 (40)
Demonstrations 7 (41) 3 (7) 5 (5) 6 (53)
Large conferences 18 (34) 8 (10) 16 (6) 16 (50) Small group conferences 15 (25) 6 (8) 13 (7) 12 (41)
Tutorials 21 (33) 7 (8) 5 (2) 18 (43)
Clinical correlation 15 (25) 7 (3) 14 (30)
Problem-based sessions 15 (2) 5 (4) 42 (2) 15 (31)
For reasons similar to those already mentioned, the columns in Table 6 do not add up to 100%. Table 7 shows the same data twice, the mean values of the numbers as reported, as well as the means ‘‘cor-rected’’ (prorated) so as to add up to 100%.
Whereas the amount of time spent teaching appears to vary among geographic regions, it does not seem
to differ much between ‘‘medical’’ and ‘‘other’’ facul-ties.
NUMBERS OF STUDENTS AND TEACHING STAFF
Because of the strikingly varying numbers, in addition to averages in Tables 8 and 9 the ranges of the values are also shown in the principal categories. The widest extremes are found among the entries from Latin America.
The headings ‘‘other basic science’’ and ‘‘clinical faculty’’ refer to teaching staff of other departments helping to teach a physiology course. In the question-naire a distinction was made between student assis-tants and technicians, but in the tally of Tables 8 and 9 these two categories of ‘‘ancillary’’ staff were lumped for the sake of simplicity. ‘‘Total teaching staff’’ is the mean of the sums, which is not necessarily equal to the sum of the means.
There was some confusion in nomenclature, because in some countries the rank of ‘‘assistant’’ is assigned to junior faculty members, equivalent to ‘‘assistant profes-sor’’ or ‘‘assistant lecturer’’ elsewhere. On the other hand, sometimes ‘‘assistant professors’’ were also reported under ‘‘assistants.’’ Whenever these devia-tions were obvious, the ‘‘assistants’’ were moved to the category of ‘‘physiology faculty.’’
TABLE 5
Cell physiology 9 10 7 8
Cardiovascular 14 10 15 14
Blood 6 6 6 6
Respiration 9 7 11 9
Gastrointestinal 8 6 11 7
Nutrition 3 5 2 3
Renal 8 8 10 8
Endocrine 11 10 10 11
Autonomic nervous system 4 3 3 4
Somatic nervous system 14 16 15 14
Exercise and environment 5 6 6 5
Pathophysiology 6 6 6
Muscle 4 2 2 3
Other 5 2 2
Data represent mean percentages of course contents prorated to 100% of total responses.
TABLE 4
Course content: Medical courses
Region
Cardiovascular 24 12 13 17 17 14 17
Blood 4 7 11 8 7 7 7
Respiration 17 13 7 9 11 10 10
Gastrointestinal 10 8 10 7 8 7 9
Nutrition 5 3 3 4 6 3
Renal 12 10 9 8 11 8 10
Endocrine 14 13 10 10 14 13 13
Autonomic nervous system 3 5 5 6 3 3 4
Somatic nervous system 6 11 22 25 14 18 17
Exercise and environment 4 7 5 7 6 6
Pathophysiology 11 10 2 2 8 7
Muscle 4 1 6 2 7
Other 1
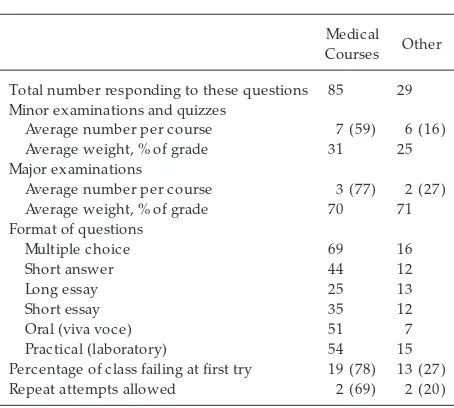
ASSESSMENT
Table 10 should be read as illustrated by the following examples:
• Out of 85 respondents who teach in medical physiol-ogy courses, 59 administer minor examinations or tests or ‘‘quizzes’’; in these 59 courses, the average number of minor tests is 7 per course; and the aggregate result of these tests counts, on average, as 31% of the final grade.
• Out of 85 respondents teaching in medical
physiol-ogy courses, 69 report using multiple-choice ques-tions in examinaques-tions or tests; 44 use short answers; etc.
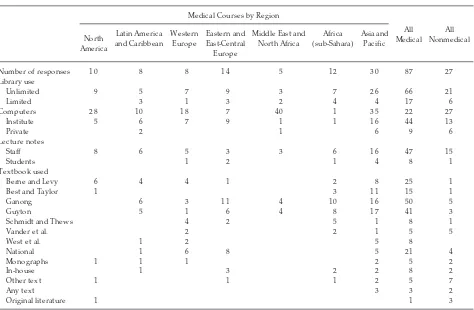
MATERIALS AND RESOURCES
In Table 11 the first row shows the total number of responses returned that are relevant to the questions. Read this data as illustrated by the following ex-amples:
• Out of the 10 responding medical schools in North America, 9 reported library use for the students as ‘‘unlimited.’’ (Under ‘‘unlimited’’ were also in-cluded those responding that the library hours available to the students are 6 days per week, 9:00 AM to 5:00 PM. Anything less was entered as ‘‘limited.’’)
• Out of the 10 responding North American medical schools, 5 provide computers for use by the stu-dents, and in these 5 schools, the average number of computers is 28.
‘‘Computers by institute’’ refers to equipment pur-chased and provided by the school; ‘‘computers, private’’ refers to personal property of the students. In some cases both were listed for the same course. It should be noted that, of all the data, computer use is likely to have changed most in the years that have elapsed between receiving the data and compiling them.
TABLE 6
Pr ofessional effort: Medical courses
Region
Student contact [11] [15] [13] [27] [23] [18] [24]
Lecture preparation [9] [16] [20] [14] [20] [23] [19]
Marking papers [4] [6] [8] [8] [7] [6] [8]
Data are means of fraction of time (%) spent on professional activity; nos. in parentheses indicate number of responses within categories. Values in square brackets indicate time spent in various teaching activities.
TABLE 7
Pr ofessional effort: Summaries
As Reported Prorated to 100% Total
Medical Other All Medical Other All
Teaching 49 (84) 41 (22) 45 (106) 38 36 34
Concerning textbooks:
• Only the textbooks crossing national boundaries are listed by author. This was done only to avoid expanding the listings until an overview becomes
impossible, and it should not be interpreted as a value judgment. Czech or Japanese or Indian texts, entered under the category ‘‘national,’’ may be as good as or better than the international best-sellers.
TABLE 10 Assessment
Medical Courses Other
Total number responding to these questions 85 29 Minor examinations and quizzes
Average number per course 7 (59) 6 (16)
Average weight, % of grade 31 25
Major examinations
Average number per course 3 (77) 2 (27)
Average weight, % of grade 70 71
Format of questions
Multiple choice 69 16
Short answer 44 12
Long essay 25 13
Short essay 35 12
Oral (viva voce) 51 7
Practical (laboratory) 54 15
Percentage of class failing at first try 19 (78) 13 (27)
Repeat attempts allowed 2 (69) 2 (20)
Data for percentage of class failing at first try and number of repeated attempts allowed are means. Data for question format indicate number of respondents using each format. Nos. in parenthe-ses indicate number of responparenthe-ses within categories.
TABLE 8
Students and staff: Medical courses
Region
Number of students in course
Mean 126 (7) 509 (7) 143 (3) 226 (12) 250 (4) 193 (10) 159 (27)
Range 72–200 70–2,700 70–180 100–300 100–450 33–350 50–720
Number of physiology faculty
Mean 8 (7) 13 (8) 7 (8) 7 (13) 10 (5) 6 (12) 8 (27)
Range 7–13 2–50 4–13 1–13 1–14 1–14 3–19
Other basic science faculty
Mean 1 (3) 4 (2) 11 (3) 2 (3) 2 (3) 3 (10)
Clinical faculty in physiology course
Mean 5 (7) 6 (4) 7 (2) 1 (6) 3 (1) 2 (7) 3 (9)
Assistants and technicians
Mean 6 (2) 50 (8) 14 (7) 12 (9) 12 (5) 7 (5) 5 (27)
Total teaching staff
Mean 15 (7) 73 22 31 21 17 19
Range 9–27 11–300 4–43 8–39 6–47 5–32 5–36
Data are means or ranges, as indicated; nos. in parentheses indicate number of responses within categories. Values for total teaching staff are means of sums.
TABLE 9
Students and staff: Summary
Medical
Courses Other
Number of students in course
Mean 211 (70) 112 (29)
Range 40–2,700 8–300
Number of physiology faculty
Mean 8 (79) 4 (25)
Range 1–50 1–8
Other basic science faculty
Mean 2 (20) 3(8)
Clinical faculty in physiology course
Mean 4 (30) 3 (4)
• Translated textbooks are counted with the original.
• Numerous courses assign more than one textbook; for these, each was entered.
• Under ‘‘other text’’ are books mentioned by just one respondent.
• ‘‘Guyton’’ includes Guyton and Hall.
• ‘‘Monographs’’ refer to textbooks limited to a topic, whereas ‘‘original literature’’ refers to assigned read-ing of research papers or review articles.
EVALUATION AND COMMENT
Fifty respondents have submitted comments, and most of these were thoughtful, pertinent, and
insight-ful. They ranged from a couple of sentences to essays of two or more pages. Unfortunately, it is not possible to reproduce all of them in full. I have attempted to distill their general flavor, with apologies to all whose thoughts are so inadequately represented here.
The questionnaire expressly asked whether, in the opinion of the respondent, teaching is improving or deteriorating in his or her institution or country, or worldwide. Optimists outnumbered pessimists in this respect 14 to 4, whereas 2 noted progress in some areas and regression in others. Among those reporting improvement were three from the USA, two from Slovakia, two from India, two from Iran, and three from the Philippines; the others were scattered single individuals. Three of the four who reported regression were from Nigeria. Lack of money and shortage of staff
TABLE 11 Materials and r esour ces
Medical Courses by Region
All Medical
All Nonmedical North
America
Latin America and Caribbean
Western Europe
Eastern and East-Central Europe
Middle East and North Africa
Africa (sub-Sahara)
Asia and Pacific
Number of responses 10 8 8 14 5 12 30 87 27
Library use
Unlimited 9 5 7 9 3 7 26 66 21
Limited 3 1 3 2 4 4 17 6
Computers 28 10 18 7 40 1 35 22 27
Institute 5 6 7 9 1 1 16 44 13
Private 2 1 6 9 6
Lecture notes
Staff 8 6 5 3 3 6 16 47 15
Students 1 2 1 4 8 1
Textbook used
Berne and Levy 6 4 4 1 2 8 25 1
Best and Taylor 1 3 11 15 1
Ganong 6 3 11 4 10 16 50 5
Guyton 5 1 6 4 8 17 41 3
Schmidt and Thews 4 2 5 1 8 1
Vander et al. 2 2 1 5 5
West et al. 1 2 5 8
National 1 6 8 5 21 4
Monographs 1 1 1 2 5 2
In-house 1 3 2 2 8 2
Other text 1 1 1 2 5 7
Any text 3 3 2
Original literature 1 1 3
and equipment was a recurrent complaint among respondents from Latin America, Africa, Asia, and Eastern Europe. Lack of resources was, nonetheless, not always correlated with a perception of deteriora-tion. On the contrary, several of our colleagues feel that teaching has improved in their institutions de-spite material obstacles.
There were numerous requests for assistance in the dissemination of information by the International Union of Physiological Sciences (IUPS) and other bodies. Ideas ranged from a worldwide bank of examination questions, or, more generally, a network of teaching under IUPS auspices, to a computerized exchange of up-to-date class notes and a guidebook produced by the IUPS on physiology teaching.
An oft-repeated concern was the poor appreciation of teaching by deans and other higher authorities. It is felt that promotion, tenure, and salary are functions of success in research and only research. Whereas this opinion is hardly new, it is surprising that it is prevalent not only at institutions addicted to the flow of funds collected as research overhead but also in places where government funding is determined mainly by the number of students enrolled.
Many of our colleagues in the developing countries expressed appreciation for the congress workshops and regional meetings devoted to teaching physiol-ogy, sponsored either by the IUPS or by their national physiology societies. Many hope that the IUPS will take an even more active role in assisting their efforts, especially in disseminating information in print as well as by electronic means.
The following is a sampling of some of the more striking thoughts expressed, excerpted and para-phrased; each paragraph is extracted from one per-son’s response (phrases in square brackets are my explanatory notes, or, more rarely, my comment on a comment).
Fr om the USA
‘‘I am a convert to Problem Based Learning. I am impressed, how fast ideas on innovative teaching have spread.’’
‘‘Clinicians complain that students arrive at the wards with too much detail crammed into their heads. Yet clinicians also cooperate in the teaching of Physiol-ogy.’’
‘‘Students arrive already full of information on cell and molecular biology [from undergraduate college], none on organ physiology.’’
‘‘The future is in the hands of teams, rather than individual researchers.’’
‘‘Experienced teachers should mentor beginning teach-ers.’’
United Kingdom
‘‘Increased admissions brings more weak students into the class, and results in more dropouts.’’
Finland
‘‘Physiologists not only have the most important role in the education of future health professionals; they should also take responsibility in informing the gen-eral public.’’
Lithuania
‘‘Here we feel isolated and ‘out of the loop’ [of information exchange].’’
Hungary
‘‘Even as technology augments the efficiency of teach-ing, the expansion of the material thwarts progress.’’
Poland
‘‘Universities should be [remain?] publicly funded and tuition should be free. Admission must be based on merit only, not the ability to pay.’’
Slovakia
‘‘Animal experimentation is threatened by student activists, but the threat has so far been successfully resisted.’’
Mex ico
‘‘We are turning out good researchers but bad scien-tists. We should stimulate creativity, but everybody is too busy collecting data.’’
Peru
[A change in course design: ‘‘active learning’’ adapted to a large class:] ‘‘Students receive lecture outline ahead of the lecture; obligated to read relevant chap-ter; lecture itself is spent in discussion. Also: students must prepare a topic in depth, to be presented in a seminar.’’
South Africa
‘‘A burning issue here: should course emphasize content, or should it concentrate on improving logical thought processes?’’
Zimbabwe
‘‘Too much detail hinders understanding.’’
China
‘‘Teachers should acknowledge that most students train to be practicing physicians.’’
‘‘Computer-based experiments can substitute for ani-mal laboratory and save money, but many universities still use kymographs in student laboratories [not a bad instrument to demonstrate basic physiological pro-cesses].’’
India
‘‘A good physician is a good physiologist.’’
‘‘Refresher courses are needed for practicing physi-cians.’’
‘‘Appreciation of our teachers based on their com-mand of content, not of method of instruction.’’
‘‘Teaching should be adapted to the needs of each country.’’
Japan
‘‘We are always discussing improvement, but nothing changes. In Japan, the [more] old, the more conserva-tive.’’
Philippines
‘‘The philosophy of teaching must be different for each institution and must be adapted to needs of each country.’’
‘‘Our students adopted the slogan: ‘We love Physiol-ogy’.’’
Comment on the Comments
There seems to be a widespread unease concerning the diminishing support, financial and moral, for teaching in general, and for teaching physiology in particular. There is a consensus that research is rewarded and encouraged, but teaching is not. Blamed for this imbal-ance is university leadership as well as government oversight and funding agencies. Nonetheless, many are of the opinion that teaching is improving in their institutions and/or their country. In fact, the number of optimists exceeded the number of pessimists.
It was not a surprise that the ratio of teachers to students was lower in developing countries than in the wealthy industrialized parts of the world, but the class size in some of the Latin American universities seems staggering even if the faculty in these institu-tions is assisted by an unusually large number of assistants and technicians.
It has been pointed out that university professors are, as a rule, trained as scientists or scholars, almost never as teachers.
Enthusiasm for innovation is crossing boundaries, geographic as well as economic. I also share a prefer-ence for teaching in small groups and problem-based learning sessions over formal lectures, and I see the utility of technological teaching aids. Yet some of the formal lectures I have heard in my life were truly inspiring and even instructive. I plead, we should not indiscriminately discard all that which has worked well for a long time.
G. G. SOMJEN
Department of Cell Biology Duke University Medical Center Durham, NC 27710