Tuition Assistance Grant Program
Thomas J. Kane
a b s t r a c t
The D.C. Tuition Assistance Grant program dramatically changed college prices for District of Columbia residents, allowing them to pay in-state tuition at public institutions around the country. Between 1998 and 2000, the number of D.C. residents attending public institutions in Virginia and Maryland more than doubled; when public institutions in other states were added, this number again nearly doubled. The impact was largest at nonselective public four-year colleges, particularly predominantly black institutions. The total number of financial aid applicants, Pell Grant recipi-ents, and college entrants from D.C. also increased by 15 percent or more.
I. Introduction
In the United States, state and local governments heavily subsidize higher education, keeping tuition charges low for students at public two- and four-year institutions, regardless of need. The impact of subsidized public college tuition and its distributional implications have been the subject of intense debate for decades.1 However, because such subsidies are an established feature of the U.S. higher edu-cation landscape, it has been difficult as an empirical matter to identify their impact.
Thomas J. Kane is a professor of education and economics at Harvard University. He gratefully acknowledges support from the Ford Foundation and the Atlantic Philanthropies. Laurent Ross, the original director of the D.C. Tuition Assistance Grant (D.C. TAG) program, suggested this project in the spring of 2000. Leonard Proctor, program director from 2002 to 2004, and staff member Rehva Jones provided much helpful data. Daniel Madzelan at the U.S. Department of Education provided data on FAFSA applicants and Pell Grant recipients from Maryland, Virginia, and Washington, D.C. Douglas O. Staiger, Jens Ludwig, Enrico Moretti, Argelia Rodriguez, Sarah Turner, Wayne Upshaw, and an anonymous referee offered a number of helpful suggestions. Jennifer Kron, Rehva Jones, and Laurent Ross offered comments on an earlier draft. Virginia Nguyen provided research assistance. The data used in this article can be obtained beginning January 2008 through December 2010 from Thomas J. Kane, Gutman 455, Appian Way, Harvard Graduate School of Education, Cambridge, MA 02138, kaneto@gse.harvard.edu.
[Submitted March 2006; accepted September 2006]
ISSN 022-166X E-ISSN 1548-8004Ó2007 by the Board of Regents of the University of Wisconsin System T H E J O U R NA L O F H U M A N R E S O U R C E S d X L I I d 3
idents of the District of Columbia. Before the fall of 2000, residents of the district were offered subsidies at one public institution, the University of the District of Columbia (UDC), an open-admissions institution that operates much like a commu-nity college. With UDC as their only subsidized public option, two-thirds of district residents (64 percent) enrolled at institutions outside the district.2(Elsewhere in the United States, only 15 percent of college entrants attended schools outside their state.) Moreover, because of the lack of publicly subsidized options, roughly half of district residents enrolled in private institutions prior to 2000—twice the rate of students elsewhere in the United States.3
Before the D.C. Tuition Assistance Grant program (D.C. TAG) was created, the average D.C. resident paid much more to attend college than residents of other states. For example, during the 1999–2000 school year, dependent undergraduates from the District of Columbia paid $7,890 per year in tuition, minus all grant aid (including means-tested federal grants).4 This was more than twice the national average of $3,215 for dependent students, despite the fact that the percentage of families in D.C. who live below the poverty line is among the highest in the nation.
Beginning in the fall of 2000, district residents became eligible for a D.C. TAG to pay the difference, up to $10,000, between in-state and out-of-state tuition at public institutions in other states.5In so doing, the D.C. TAG program essentially provided the same menu of subsidized options offered to residents of other states—in fact, it offered the best of options across all the states. In this paper, I evaluate the impact of the D.C. TAG program on the college enrollment decisions of D.C. residents.
I have found that between 1998 and 2000, the first years the program was imple-mented, the number of D.C. residents attending public institutions in Virginia and Maryland more than doubled. Between 2000 and 2002, when public institutions outside Virginia and Maryland were added, the number of D.C. residents attending such institutions again nearly doubled. The increases were largest at nonselective public four-year institutions, particularly predominantly black public institutions in Maryland and Virginia. The percentage of D.C. residents deciding to enter college also apparently increased: The number of first-time federal financial aid applicants, first-year college students receiving Pell Grants, and D.C. residents reported enrolled as freshmen by colleges and universities nationwide all climbed by 15 percent or more. The magnitude of the increase, although large, was consistent with prior esti-mates of the elasticity of demand for college enrollment.
I also studied the neighborhoods from which grant recipients were drawn. Al-though residents of neighborhoods with median incomes close to the median for
2. Digest of Education Statistics, 2002, Table 203.
3. Author’s tabulation of proportion of first-time freshmen, recent high school graduates attending public institutions in fall of 1998.
4. Author’s tabulation of the National Postsecondary Student Aid Survey, 1999–2000.
the district were more likely to receive grants than those from the lowest-income neighborhoods (presumably reflecting higher college enrollment with higher family income), recipient rates were similar in middle- and higher-income neighborhoods.
II. Description of D.C. Tuition Assistance
Grant Program
The legislative history of the District of Columbia College Access Act was remarkably brief, its introduction and swift passage fitting neatly between the end of one college admission cycle and the beginning of the next. Sponsored by Rep. Eleanor Holmes Norton of Washington, D.C., Rep. Thomas Davis of Virginia, Rep. Constance Morella of Maryland, and eight others, the legislation, known as H.R. 974, was introduced in the U.S. House of Representatives in March 1999, just as the college admission season for the fall of 1999 would have been closing. The bill was passed by the House in May 1999 and by the Senate in October. The legislation, P.L. 106-98, was signed into law by President Clinton on November 12, 1999, just as the new admission season was heating up.
In addition to providing grants for students at public institutions, the law provided smaller grants for those choosing selected private institutions in D.C., Maryland, and Virginia. D.C. residents attending private nonprofit institutions in the D.C. metro-politan area and private nonprofit historically black institutions in Maryland and Virginia received $2,500.6 Students attending public historically black institutions qualified for the full grants. Students attending private for-profit institutions, such as those that provide certificates for occupational training, were not eligible for the D.C. TAG program.
The program originally was limited to D.C. residents who did not have a bache-lor’s degree and had graduated from high school in 1998 or later.7 Students who had already started college were eligible, as long as they met the residency require-ment and had graduated in 1998 or later. The program was not limited to those grad-uating from D.C. public schools; district residents attending private or public schools outside the district were also eligible.
To meet the residency requirement, applicants were required to provide D.C. tax returns and other documentation, such as drivers’ licenses and utility bills. For de-pendent students (those who had been claimed as a dede-pendent on a parent’s tax return), the parents needed to prove residency. For independent students, residency depended upon the student’s place of residence.
The program was limited originally to public institutions in Virginia and Maryland, but the legislation allowed the D.C. mayor to expand the program to public
6. Those receiving the $10,000 grants to attend public institutions face a lifetime cap of $50,000. There is a $12,500 cap on the grants for those attending private institutions. Originally, the qualifying private institu-tions were American University, Capitol College, Catholic University, Columbia Union College, the Cor-coran School of Art, Gallaudet University, George Washington University, Georgetown University, Hampton University, Howard University, Maryland College of Art and Design, Marymount University, Saint Paul’s College, Southeastern University, Trinity College, Virginia Union University, Washington Ad-ventist Hospital School of Radiography, and Washington Bible College.
institutions outside of Virginia and Maryland. Coming so late in the spring, the an-nouncement left little chance for students to apply to public colleges outside those two states in the first year of the program.8I present evidence that the impact on en-rollment at public institutions outside of Maryland and Virginia did not occur until after fall 2000. In April 2002, the program was changed again in several ways. Most importantly, all private historically black institutions—not just those in Maryland and Virginia—were made eligible for the $2,500 awards.9
III. Literature Review
In an extensive literature, researchers have attempted to measure the impact of various types of tuition and financial aid policies on college-going. Much of that work has focused on the decision to enroll in college (often referred to as col-lege access). Others have studied the impact of colcol-lege prices on the percentage of students attending a specific institution or type of institution (often referred to as col-lege choice). In their review of the literature on student responsiveness to changes in college cost, Leslie and Brinkman (1988) report a consensus estimate that a $1,000 change in college costs (in 2001 dollars) is associated with a four- percentage-point difference in college enrollment rates. A number of papers have used between-state differences in state tuition policy, and they essentially compare the college entry rates of otherwise similar youth in high- and low-tuition states.10The empirical strat-egy in this literature typically assumes that the relevant price for marginal students is the tuition at public institutions in their state and evaluates the effect of tuition and college-going by comparing college-going rates in high- and low-tuition states. Such studies also assume that the supply of college slots is perfectly elastic: Given a change in price, it is solely student demand that determines enrollment and not the supply of college slots.
An important weakness of these studies is that they rely on relatively fixed differ-ences in tuition levels between states. For instance, California has been a relatively low-tuition state for the past 40 years and also has built a number of community col-lege. These studies, therefore, may be attributing the effect of these other policy dif-ferences to tuition policy. Using Current Population Survey data, Kane (1994) and Card and Lemieux (2000) include state fixed effects in their analyses and find that the effect of public tuition levels is often not statistically significant. Kane (1994) finds a negative and statistically significant effect of tuition on African American
8. Students are likely to have been even more confused when, in the fall of 2000, four large public institutions—the University of Michigan, the University of Florida, the University of California, and the State University of New York—refused to sign the participation agreement, complaining that the report-ing requirements were too burdensome. An agreement was eventually reached with these institutions in December 2000, just in time for the new admission season.
9. In addition, those who had graduated before 1998 were made eligible, as long as they could show that they were enrolled in a D.C. TAG-eligible institution in 2002 and could provide evidence of D.C. tax returns going back five years. D.C. residents who were not citizens or permanent residents of the United States were made ineligible.
youth after including state fixed effects, but the coefficient on tuition is no longer sig-nificant for whites with the inclusion of state fixed effects. Card and Lemieux (2000) report small (one- to two-percentage-point differences in college enrollment per $1,000 difference in tuition) and occasionally statistically insignificant effects of tu-ition on college-going.
Dynarski (2003) estimates the impact of ending college benefits for Social Secu-rity Survivors, as well as a number of state merit-based aid programs. She finds that after the discontinuation of the Social Security Student Benefit Program, college-go-ing by students with deceased parents declined dramatically relative to other youth, by 19 to 26 percentage points, implying a three to four-percentage-point reduction in enrollment per thousand dollar change in price. In a second paper, Dynarski (2004) compares the change in enrollment rates for youth in Georgia to those in other southern states after the HOPE Scholarship program was initiated in that state.11She estimates that the program increased college enrollment rates of youth aged 18 to 19 by 7.0 to 7.9 percentage points. (This estimate converts to 2 to 3 percentage points per $1,000 difference in cost.) Dynarski also analyzes the impact of a number of other state merit-aid programs created during the 1990s and finds broadly similar results.
In these papers, the source of variation in price is plausibly exogenous. However, in the analysis of tuition benefits for Social Security Survivors, it is difficult to know whether the responsiveness of such a narrow subgroup—youth with deceased parents— can be generalized to other groups. Moreover, the estimate is based on an exceed-ingly small sample—107 children of deceased parents before the change in policy and 49 after the change. With Georgia’s HOPE Scholarship program, it must be pre-sumed that the impact estimates reflect some combination of supply-and-demand parameters; it is probably not plausible that the supply of college slots was perfectly elastic, because the program was affecting so many residents in the same state.
Others have focused on the effect of price on college choice. Manski and Wise (1983) found large effects of price relative to family income on the choice of college. More recently, Wilbert van der Klaauw (2002) exploited discontinuities in the for-mula determining fellowship offers at a major Eastern university to identify the effect such offers had on students’ decision to attend that institution. His estimates suggest that each $1,000 in aid (in 2001 dollars) raises the likelihood of attending the univer-sity by three to four percentage points.
A paper by Abraham and Clark (2003) studied the impact of the D.C. Tuition As-sistance Grant program on student application decisions. Using data on SAT-takers in D.C. and a comparison set of cities, they studied changes in the percentage of D.C. residents having SAT scores sent to institutions outside D.C. Beginning with high school students taking the SAT in 1999–2000, they report a nine-point rise in the per-centage of D.C. residents sending their scores to a public institution in Maryland or Virginia and a six-point increase in the percentage sending their students to public institutions in any state. They find an additional six-percentage-point rise in both fig-ures relative to the comparison group in the 2000–2001 school year. They also report a larger impact on D.C. residents attending private high schools than for those attending
compared to nine points for public school students. They also reported that the impact was larger on white students in D.C. (23 points) than for black students (ten points).
However, the program’s impact on application decisions may be very different from the impact on enrollment decisions. Submitting an application is similar to pur-chasing an option: With the availability of the D.C. TAGs, the chance of admission at a flagship public institution—such as the University of Virginia, University of Maryland, University of North Carolina, or University of California—became an in-creasingly valuable if far-from-certain prospect for many D.C. residents, since they had to be admitted first. The fact that private school students and white youth were more likely to purchase that option does not necessarily mean that their enrollment decisions were more likely to be affected.
IV. Data
I use three sources of data in this analysis. First, I use data on state of residence for first-time freshmen from the Integrated Postsecondary Education Data System (IPEDS) from fall 1994 through 2002. Institutions were asked to report the total number of first-time freshmen by their state of residence prior to entry, as well as the subset of first-time freshmen from each state who had graduated from high school in the previous 12 months.12
Second, I obtained data from the U.S. Department of Education on all students submitting federal financial aid applications from D.C., Maryland, and Virginia in the 1998–99 through 2001–2002 award cycle. The federal financial aid form allows students to list the codes for up to six institutions to which they want their financial aid data to be sent. I use those data to study the change in the likelihood that a student would list a public institution on the form. Like Abraham and Clark (2003), I study the change in the likelihood of D.C. residents listing a public institution before and after 2000, relative to Maryland and Virginia residents. Moreover, I identify the insti-tutions attended by the subset of financial aid applicants receiving Pell Grants. Since private for-profit institutions participate in the federal student aid programs, the Free Application for Federal Student Aid (FAFSA) data offer more reliable measures of proprietary school enrollment before and after the start of the D.C. TAG program.
Finally, working with data from the D.C. TAG program office, I identify the loca-tion of D.C. TAG grant recipients in D.C. by 2000 census block group. I report ev-idence on the characteristics of the neighborhoods from which the D.C. TAG recipients were drawn, as well as the high schools they attended.
V. Impact on Enrollment of Freshmen from D.C.
I begin by analyzing the percentage changes in enrollment of D.C. residents at various institutions associated with changes in the prices they faced. If
all residents have the same preferences as the representative consumer, the resulting coefficient on the price change has a natural interpretation as a parameter from a con-ditional logit specification.13Although tuition and state are the only school character-istics used in the model, taking differences over time accounts for other institutional characteristics that are fixed but more difficult to measure.
In 1998, half of all D.C. freshmen attending an institution outside D.C. attended schools where they made up less than 1 percent (0.8 percent) of the freshmen at the school. The maximum representation of D.C. residents at schools outside D.C at all grade levels in 1998 was at the Maryland College of Art and Design, where they made up 12 percent of the student body. Given that D.C. residents accounted for a small share of students, it seems reasonable to assume that even a large change in attendance by D.C. students was unlikely to lead to much change in total enroll-ments or institutional environenroll-ments.
Table 1 reports the tuition paid by D.C. residents (in 2002 dollars), net of D.C. TAG awards, at different types of institutions from 1998 through 2002. (In calculat-ing these means, each institution’s tuition was weighted by the number of freshmen D.C. residents attending the institution in the fall of 1998, before the change in pol-icy.) The first two rows describe categories of institutions whose prices were not directly affected by the change in policy—UDC and private nonprofit institutions outside the D.C. metropolitan area that were not historically black institutions. Tu-ition for D.C. residents at UDC actually fell in real value between 1998 and 2002, from $2,218 to $2,070, while prices rose by about $2,000 at the private institutions outside D.C. over the same period.
The next category of institutions, public two- and four-year colleges outside D.C., was most directly affected by the D.C. TAG program. The price of public four-year institutions in Maryland and Virginia fell by $6,213 relative to the price at UDC be-tween 1998 and 2000. Then, bebe-tween 2000 and 2002, the price of public four-year institutions in the rest of the country fell by $5,512 relative to UDC. The staggered timing of the tuition changes—first at institutions in Maryland and Virginia and then at public institutions elsewhere—will be helpful in identifying the impact of the program.
The timing and magnitude of the price changes also varied among private histor-ically black colleges and universities (HBCUs) in the D.C. area. The policy first af-fected only the private institutions in the D.C. area and private HBCUs in Maryland and Virginia. The prices at these institutions fell by $1,735 and $2,511, respectively, relative to the price of UDC. Then, between 2000 and 2002, private HBCUs outside D.C. became eligible for the benefits and their prices also declined, by $1,805 rela-tive to UDC.
The last two columns of Table 1 report the changes in absolute numbers of D.C. residents attending each category of school between 1998 and 2000 in the IPEDS
13. Using the conditional logit specification (McFadden 1974), the utility the representative person gains from choosing theith school out of m choices isUit¼bTit+dit+eitwhere Titis the tuition at the school and direpresents college characteristics that are fixed in the short term (such as the quality of the faculty) andeit
represents unobserved variation in tastes and school attributes. If the residuals,eit,are i.i.d. with the type I
Table 1
Relative Prices and Enrollments of DC Residents Before and After DC TAG
Tuition for DC Residents (net of DC TAG)
Difference-in-Difference Relative to UDC
DC Freshmen Enrollment
Enrollment 1998
Change
1998 2000 2002 2000–1998 2002–2000 2002–1998 2000–1998 2002–2000
Univ. of District of Columbia $2,218 $2,163 $2,070 $0 $0 $0 260 215 25
Priv, Non-HBCU, Outside DC 21,289 21,829 23,115 595 1,379 1,974 428 50 266
Pub 4-Year in MD, VA 10,783 4,515 5,201 26,213 779 25,434 146 252 259
Pub 2-Year in MD, VA 7,126 4,085 3,994 22,986 2 22,984 30 35 5
Pub 4-Year in Other States 10,063 10,219 4,614 211 25,512 25,301 286 253 245
Pub 2-Year in Other States 2,876 3,129 1,465 308 21,571 21,263 6 5 24
Priv HBCU in DC, MD, VA 10,373 7,807 8,161 22,511 447 22,064 139 260 0
Priv HBCU Elsewhere 9,466 10,502 8,604 1,091 21,805 2714 119 27 17
Priv Colleges in DC 20,819 19,029 20,375 21,735 1,439 2296 158 236 32
Total: $12,830 $12,003 $11,394 2$772 2$516 2$1,288 1,572 171 165
Note: Based on tuition and enrollment data in IPEDS database and DC TAG program rules. Enrollment figures are reported for first-time freshmen who had graduated within the last 12 months. Tuition estimates net of DC TAG assumed that expansion of the program to public institutions outside of MD and VA was not effective until after 2000. All figures in $2002 using CPI-U-X1. Tuition figures were weighted by the number of DC residents attending institution in 1998.
Journal
of
Human
data. Between 1998 and 2000, the number of D.C. residents enrolling as first-time freshmen at public four-year institutions in Maryland and Virginia more than dou-bled, from 146 to 398. The 252 additional students represented a 176 percent in-crease. However, the 15-student decline at UDC was small, in both absolute and relative turns.
The big declines occurred not at UDC but at public institutions outside Maryland and Virginia and at private colleges and HBCUs in D.C., Maryland, and Virginia. Re-call from Table 1, before the change in policy, that the price of public four-year col-leges in Maryland and Virginia was similar on average to the price of a private historically black college—$10,783 versus $10,373. However, between 1998 and 2000, the price of a public four-year college fell to almost half the price of a private HBCU—$4,515 versus $7,807. The institution for many of those on the margin for entering a public four-year institution in Maryland and Virginia seems to have been a private college in D.C. or a public four-year institution in other states, rather than UDC. Between 2000 and 2002, when public institutions outside Maryland and Virginia were added to the list of eligible institutions, these institutions witnessed a large increase in the number of D.C. freshmen, rising by 252 students after falling by 53 students between 1998 and 2000.
Table 2 reports the effects of regressing log enrollment of D.C. residents on tuition for D.C. residents, time dummies, and institutional fixed effects. To exploit the extra identification offered by the staggered implementation of the program for public institutions in Maryland and Virginia in fall 2000 and subsequent expansion to insti-tutions elsewhere, I first focus on the two periods initially showing differences— 1998 to 2000 and 2000 to 2002—before pooling the three years. I also report the results separately for the two different freshmen enrollment series—total first-time freshmen from D.C. and the subset of freshmen from D.C. who had graduated from high school in the previous 12 months.
The top two panels in Table 2 report the results using any institution with one or more D.C. resident enrolled. Between 1998 and 2000, each $1,000 relative price de-crease was associated with an 8 percent inde-crease in D.C. freshmen enrollment and a 10 percent increase in freshmen enrollment of recent high school graduates from D.C. Between 2000 and 2002, when a different set of institutions faced the change in relative price, each $1,000 relative price change was associated with respective five- and six-percentage-point increases in enrollment. (The somewhat smaller im-pact of the latter change may have been because D.C. residents were less likely to attend institutions far from D.C., even with the price change.) When pooling the three years, the results are again in the range of 5 percent and 6 percent respective increases in enrollment for every $1,000 decline in price for D.C. residents.
Table 2
Fixed Effect Regressions of Log of DC Resident Enrollment on Price for DC Residents, 1998–2002
Ln(First-Time Freshmen)
All Institutions (>¼1 DC Residents)
Ln(F-T Fresh, Recent HS Gr)
All Institutions (>¼1 DC Residents)
2000–1998 2002–2000 2002–1998 2000–1998 2002–2000 2002–1998
Tuition net of DC TAG (/1000)
20.075 20.052 20.054 20.095 20.062 20.063
(0.032) (0.018) (0.012) (0.032) (0.020) (0.014)
Observations 759 796 1180 632 655 960
>¼10 DC Residents >¼10 DC Residents
2000–1998 2002–2000 2002–1998 2000–1998 2002–2000 2002–1998
Tuition net of DC TAG (/1000)
20.069 20.105 20.074 20.075 20.090 20.080
(0.045) (0.030) (0.024) (0.061) (0.042) (0.035)
Observations 93 96 145 76 81 118
Note: All regressions include year dummies and fixed effect for each institution. The data are based on tuition and enrollment data in IPEDS database and DC TAG program rules. In estimating tuition for DC residents net of DC TAG, I assumed that the expansion of the program to public institutions outside of MD and VA was not effective until 2001. All tuition figures in 2002 dollars using CPI-U-X1. Huber-White heteroskedasticity-robust standard errors reported.
Journal
of
Human
Table 3 reports the results for various subsets of institutions, using the change in the log of the number of recent high school graduates from D.C. enrolled as the de-pendent variable. The top left panel limits the sample to institutions in D.C., Virginia, Pennsylvania, Maryland, North Carolina, New York, Georgia, and Delaware. (In the order listed, institutions in these states enroll the largest shares of D.C. residents, to-gether accounting for 76 percent of D.C. resident enrollments in 1998.) The top right panel reports the results for institutions in the remaining states. In the period 1998 to 2000, the standard error is quite large on the change in tuition in the states not near D.C., reflecting the fact that the change in D.C. TAG policy did not affect those insti-tutions. (There was still some natural variation in tuition prices due to differences in tuition policies, but apparently not enough to identify an effect.) Between 2000 and 2002, when the D.C. TAG program was expanded to include public institutions in these other states, the impact of a tuition increase on D.C. resident enrollment was negative and statistically significant in both sets of states, but the point estimate was slightly larger (although not statistically significant) in the states where D.C. res-idents typically attend college.
The second pair of results in Table 3 compares the impact at two- and four-year colleges. Arguably, we might expect the D.C. TAG program to have had a larger ef-fect on four-year college enrollment than on two-year colleges, since UDC continued to provide D.C. residents who were seeking that type of education a lower-cost op-tion. As reported in Table 1, even after accounting for the D.C. TAG grants, the tu-ition at public two-year colleges in Maryland and Virginia averaged $4,085 in 2000, compared to $2,163 at UDC. The estimates of enrollment responses with respect to tuition are large and statistically significant at four-year colleges, but not at two-year colleges. However, the small number of two-year colleges enrolling D.C. residents makes it difficult to identify the difference in responses.
The third pair of results in Table 3 compares the estimated impact of the D.C. TAG program among institutions that were more than 50 percent black in 1998 (before the change in policy) and those that had fewer African American students. The point estimates are larger for institutions that had more than 50 percent African American enrollment in 1998, although only the difference in coefficients for the 1998 through 2002 period was statistically significant.
The last pair of results in Table 3 reports the results for selective and nonselective institutions, using as the metric of selectivity the 75th percentile SAT math score of the students at the college. The impact of the program on enrollment appeared to be much larger at the nonselective institutions and were statistically significant when the results are pooled for the 1998 to 2002 period.
Table 3
Fixed Effect Regressions for Selected Subsamples of Log of DC Resident Enrollment on Price for DC Residents, 1998–2002
Institutions in
DC, VA, PA, MD, NC, NY GA, DE
Institutions in Other States
2000–1998 2002–2000 2002–1998 2000–1998 2002–2000 2002–1998
Tuition net of DC TAG (/1000)
20.099 20.082 20.078 0.083 20.051 20.042
(0.032) (0.027) (0.018) (0.125) (0.027) (0.020)
Observations 327 333 493 305 322 467
Four-Year Colleges and Universities
Two-Year Colleges
2000–1998 2002–2000 2002–1998 2000–1998 2002–2000 2002–1998
Tuition net of DC TAG (/1000)
20.093 20.062 20.062 0.134 20.003 20.036
(0.032) (0.019) (0.014) (0.406) (0.064) (0.141)
Observations 602 623 918 30 32 42
Journal
of
Human
2000–1998 2002–2000 2002–1998 2000–1998 2002–2000 2002–1998
Tuition net of DC TAG (/1000)
20.177 20.126 20.133 20.083 20.052 20.056
(0.062) (0.059) (0.041) (0.038) (0.022) (0.015)
Observations 85 87 130 547 567 829
Non-Selective Institutions (75th Ptile Math SAT <650)
Selective Institutions (75th Ptile Math SAT >¼650)
2000–1998 2002–2000 2002–1998 2000–1998 2002–2000 2002–1998
Tuition After DC TAG (/1000)
20.140 20.060 20.094 20.019 20.055 20.023
(0.039) (0.027) (0.020) (0.027) (0.033) (0.017)
Observations 313 322 471 196 207 305
Note: All regressions include year dummies and fixed effect for each institution. The data are based on tuition and enrollment data in IPEDS database and DC TAG program rules. In estimating tuition for DC residents net of DC TAG, I assumed that the expansion of the program to public institutions outside of MD and VA not effective until 2001. All tuition figures in 2002 dollars using CPI-U-X1. Huber-White heteroskedasticity-robust standard errors reported.
Kane
the percentage increases were more in line with increases at public institutions else-where, the changes in absolute numbers were quite small, from 13 to 25 and back to 18 between 1998 and 2002.
One reason for these numbers may be the high admission standards for out-of-state students at the selective public institutions in Maryland and Virginia.14At the Uni-versity of Maryland, enrollment of nonresident students is capped at 25 percent. At the University of Virginia, the admission rate for state resident applicants for the fall of 2002 was nearly twice the rate for out-of-state students: Approximately 53 percent of resident applicants were admitted, compared to 30 percent of nonresidents.15The D.C. residents who have the credentials to meet the high out-of-state admission stan-dards at selective public institutions—such as University of Virginia or University of Maryland—may simply be less sensitive to price.
(Schools with 75th Percentile SAT Math Scores > 650)
Change Change
Institution Name: 1998 2000 20021998–2000 2000–2002
GEORGE WASHINGTON UNIVERSITY 60 23 17 237 26
GEORGETOWN UNIVERSITY 13 5 24 28 19
HOWARD UNIVERSITY 86 29 48 257 19
JOHNS HOPKINS UNIVERSITY 3 3 3 0 0
UNIVERSITY OF
MARYLAND-BALTIMORE CNTY
5 8 3 3 25
UNIVERSITY OF
MARYLAND-COLLEGE PARK
13 25 18 12 27
COLLEGE OF WILLIAM AND MARY 3 3 6 0 3
UNIVERSITY OF RICHMOND 0 1 1 1 0
VIRGINIA POLYTECHNIC INSTIT & STATE UNIV
4 6 8 2 2
UNIVERSITY OF VIRGINIA-MAIN CAMPUS
14 14 13 0 21
VIRGINIA MILITARY INSTITUTE 0 0 0 0 0
WASHINGTON AND LEE UNIVERSITY 2 2 2 0 0
Note: Figures are number of first-time freshmen, graduating from high school in the last 12 months, who were residents of the District of Columbia, as reported in the IPEDS database.
14. Some institutions are adjusting their admission requirements for D.C. residents. For example, the D.C. TAG program reports that North Carolina A&T has adjusted its admission requirements for D.C. residents to match the criteria for North Carolina residents.
Did the increase in enrollment of D.C. residents ‘‘crowd out’’ students from other states?16To test this hypothesis, I reestimated specifications similar to those in Table 2 for Maryland and Virginia institutions, using both freshman enrollment of in-state students within each state and the freshmen enrollment of out-of-state students from residences other than D.C. as dependent variables. I studied how changes in prices for D.C. residents may have led to the crowding out of in-state students or other out-of-state students. However, I did not find evidence that the variation in price for D.C. residents was related to changes in enrollment of in-state students or other out-of-state students. This need not mean that there was no crowding out; it may sim-ply have been too minimal to discern empirically. The number of D.C. residents at-tending public four-year institutions in Maryland rose from 105 to 184, a 77 percent increase, while the number entering public four-year institutions in Virginia rose from 69 to 269, a 290 percent increase. Even after such sizable increases, D.C. res-ident enrollment rose from only 0.8 percent to 1.4 percent of freshman enrollment in Maryland and from only 0.3 percent to 1 percent in Virginia.
VI. Impact on Applications and Enrollment in Federal
Financial Aid Data
In this section, I report on an analysis of federal financial aid appli-cations from D.C., Maryland, and Virginia for the school years 1998–99 through 2001–2002. I focus on dependent students who reported the same state of legal res-idence as their parents on the financial aid application. I limited the sample to first-year students who reported that they had not previously attended college.
FAFSA applicants are allowed to list up to six institutions to which they want their financial aid information sent. Figures 1 and 2 portray the trends in the number of D.C., Maryland, and Virginia FAFSA applicants who requested that their information be sent to various types of institutions. (Figure 1 reports the trend in application rates for the types of institutions qualifying for D.C. TAG aid.) The top left panel portrays the percentage of D.C. residents listing a Maryland or Virginia public institution on their FAFSA, which was stable between the 1998–99 school year (listed as 1998 in the graph) and the 1999–2000 school year, but rose sharply between 2000–2001 and 2001–2002, from 35 percent to 46 percent. There was little change for residents of Virginia or Maryland. The top right panel reports the percentage of D.C. residents listing a public institution outside of D.C., Maryland, or Virginia. The number of D.C. residents applying to public institutions in other states declined from 1999 to 2000 from 36 percent to 34 percent (when only public institutions in Maryland and Virginia were eligible) and rose between 2000 and 2001 from 34 percent to 39 per-cent (when public institutions outside of Maryland and Virginia became eligible).
The bottom two panels report the trends in the proportion of FAFSA applicants listing a private institution qualifying for the $2,500 grants under the D.C. TAG pro-gram. The percentage of D.C. residents listing a private historically black institution in D.C., Maryland, or Virginia on the FAFSA remained steady at approximately 20 percent between 1998 and 2001. The percentage listing private nonblack institutions
Figure 1
Proportion of Dependent Federal Aid Applicants Listing an Institution on the FAFSA by Type of Institution, State, and Year
Journal
of
Human
Proportion of Dependent Federal Aid Applicants Listing an Institution on the FAFSA by Type of Institution, State, and Year
Figure 2 portrays the proportion of dependent FAFSA applicants applying to the types of institutions that did not qualify for a D.C. TAG. The percentage of D.C. res-idents applying to a private historically black institution outside D.C., Maryland, and Virginia remained constant at about 15 percent between 1999 and 2001, while the percentage of D.C. residents applying to private nonblack institutions outside the D.C. area declined sharply, from 42 percent in 1999–2000 to 32 percent in 2001– 2002. The percentage of D.C. residents listing a private for-profit institution on the FAFSA form also declined sharply, from 19 percent to 14 percent. Over the period when the application behaviors of D.C. residents were changing, the proportion of Maryland and Virginia residents applying to these institutions remained stable.
Figure 3 plots the proportion of FAFSA applicants listing a public institution in Maryland or Virginia by family income, state, or residence and year. (I divided the sample using $10,000 intervals of family income up to $150,000, and then included all of those with incomes above $150,000 in one group.) As reported in the top left panel, the proportion of D.C. residents listing a public institution in Maryland or Virginia on their FAFSA form was quite similar in 1998 and 1999, declining slightly in family income. Between 1999 and 2000, when the D.C. TAG program was cre-ated, the rates for all groups rose sharply, and they remained high in 2001. In the first year of the program, the increase was larger for families with incomes from $50,000 to $120,000 than for low-income families. Between 2000 and 2001, however, the rates rose for low-income families. Even by 2001, the increase remained small for families with incomes above $150,000.
Table 5 reports the results from several probit specifications, using a binary mea-sure of whether or not an applicant applied to a public college in Maryland or Virginia as the dependent variable. The table reports the marginal impact on the probability of applying to a Maryland or Virginia public institution. The marginal impact of the interaction between D.C. and the year dummy variables measure the differential change in application behavior for D.C. residents relative to Maryland and Virginia residents. (The baseline difference is the difference that existed in 1999, the year prior to the D.C. TAG program’s establishment.) The first column includes no other regressors and suggests a ten-percentage-point differential increase in the probability of D.C. residents applying to a Maryland or Virginia public insti-tution between 1999 and 2000. The difference grew to 14 percentage points in 2001. The second column of Table 5 includes additional regressors—including dummy variables for parental education, income categories, and asset categories, and an in-dicator for those with a zero expected family contribution (which would have qual-ified them for a maximum Pell Grant). The point estimates on the effects of year do not change substantively, implying that there was little differential change in the composition of the applicant pool between 1999 and other years.
Proportion of FAFSA Applicants Listing a Public Institution in Maryland or Virginia by Family Income, State, and Year
Changes in the Probability of Applying to a Public College in MD and VA: 1998–99 to 2001–02
Estimated Separately for Selected Subsamples:
Total Add
Controls
Parents No College
Parent w/ Some College
Family Income <75k
Family Income >¼75k
Zero EFC
P(Apply to a Public College in Maryland or Virginia)
DC 20.3764 20.3854 20.3685 20.4082 20.3718 20.4506 20.3945
(0.0109) (0.0109) (0.0144) (0.0166) (0.0121) (0.0242) (0.0193)
Year 1998–99 20.0154 20.0234 20.0285 20.0155 20.0172 20.0283 20.0237
(0.0027) (0.0027) (0.0044) (0.0034) (0.0031) (0.0053) (0.0073)
Year 2000–01 20.0120 20.0089 20.0238 0.0011 20.0140 0.0007 20.0202
(0.0026) (0.0026) (0.0041) (0.0034) (0.0031) (0.0048) (0.0067)
Year 2001–02 20.0018 0.0046 0.0005 0.0053 0.0054 20.0005 0.0088
(0.0026) (0.0026) (0.0040) (0.0034) (0.0031) (0.0047) (0.0067)
DC*Year 1998–99 0.0225 0.0253 0.0261 0.0302 0.0133 0.0856 20.0033 (0.0140) (0.0139) (0.0184) (0.0210) (0.0147) (0.0379) (0.0246) DC*Year 2000–01 0.0995 0.0986 0.0872 0.1193 0.0853 0.1765 0.0600
(0.0111) (0.0111) (0.0145) (0.0165) (0.0116) (0.0272) (0.0197) DC*Year 2001–02 0.1362 0.1332 0.1375 0.1194 0.1184 0.1849 0.1129
(0.0095) (0.0096) (0.0117) (0.0164) (0.0101) (0.0258) (0.0161)
Other Covariates? No Yes Yes Yes Yes Yes Yes
Observations 254448 254448 103137 151311 176236 78212 38535
Note: The coefficients on the DC*year interactions measure the change in the probability of applying to a public college in Maryland or Virginia for DC residents relative to the change for MD, VA residents. (The baseline year was 1999–2000.) The sample consisted of all financial aid applicants from DC, MD and VA during the 1998–99 through 2001–2002, in which both the student and the parent listed the same state as their permanent legal address. The above represent marginal effects on probabilities evaluated at the mean characteristics of the sample or subsample, based on probit specifications. Other covariates included dummy variables for mother’s education, father’s education, four income categories, four asset categories, a zero EFC indicator and a zero asset indicator.
Journal
of
Human
for those with higher family income levels and those with parents with some college. However, by the second year of the program, the estimated impact for all subgroups was in the range of 12 to 18 percentage points.
VII. Impact on College Choice by Pell Grant Recipients
For the subset of financial aid applicants receiving a federal Pell Grant, I also observed the college the student subsequently attended. The Pell Grant program is the main federal means-tested grant program for undergraduate college students. Eligibility for Pell Grants was expanded between 1998 and 2001, as the maximum Pell Grant was raised from $3,000 to $3,750. In order to focus on similar students over time, I limit the sample to Pell Grant recipients with expected family contributions less than $2,600—a group that would have been Pell Grant eligible in all four years. Among this group, the median family income was $22,403 in the three states.17
The percentage of Pell Grant recipients from D.C. attending public institutions in Maryland or Virginia doubled in the first year of the program, from 14 percent to 30 percent, and remained at 30 percent in 2001. Moreover, the percentage of Pell Grant recipients from D.C. attending public institutions anywhere outside D.C., Maryland, and Virginia actually declined by roughly one-third in the first year of the program, from 12 percent to 8 percent (when public institutions in these other states were only added late in the spring) and bounced back from eight percent to 13 percent between 2000 and 2001 (when public institutions nationwide were eligible). Although private institutions in D.C. were eligible for $2,500 awards, these schools typically lost en-rollment among low-income D.C. residents. The percentage of D.C. Pell Grant recip-ients attending private institutions in the D.C. area declined from 8 percent in 1998 and 1999 to 6 percent in 2000 and 2001. The percentage attending private historically black institutions in D.C., Maryland, and Virginia also declined, from 5 percent to 4 percent. However, the biggest declines in enrollment of low-income students from D.C. oc-curred at private nonblack institutions outside D.C. and for-profit proprietary schools. The percentage of D.C. Pell Grant recipients attending private nonblack institutions outside D.C. declined from 17 percent to 10 percent, and the percentage attending proprietary schools declined from 23 percent in 1999 to 14 percent in 2001.
Table 6 reports results the marginal effects for a series of binary variables measur-ing the type of college attended by Pell Grant recipients. Each specification includes the full set of covariates, including family income, assets, and parental education, and an indicator for zero expected family contribution status. There was a 17-percentage-point differential rise in the proportion of D.C. Pell Grant recipients attending public institutions in Maryland or Virginia between the baseline academic year of 1999– 2000 (immediately before the creation of D.C. TAG) and 2000–2001 (the first year of the program). Moreover, there were sizeable declines in the percentage of D.C. Pell Grant recipients attending private nonblack institutions outside of Maryland and Virginia and for-profit proprietary schools. Interestingly, there was no substantial change in the percentage of Pell Grant recipients from D.C. attending UDC.
Changes in the Probability of Attending Various Types of Colleges for DC, MD and VA Pell Grant Recipients 1998–2001
Public MD,VA
Public Outside MD,VA, DC
Private College in
DC Area
Private HBCU in DC, MD,VA
Private HBCU Outside MD,VA, DC
Private non-HBCU
Outside MD,VA, DC
For-Profit Proprie-tary
School UDC
DC 20.525 0.070 0.072 0.021 0.056 0.079 0.062 0.0916
(0.013) (0.011) (0.010) (0.006) (0.008) (0.014) (0.011) (0.0183)
Year 1998–99 0.009 20.005 0.000 20.004 20.002 20.006 0.006 20.0002
(0.005) (0.002) (0.001) (0.001) (0.001) (0.003) (0.003) (0.0002)
Year 2000–01 0.010 0.001 0.000 20.003 20.003 20.007 0.001 20.0001
(0.005) (0.003) (0.001) (0.001) (0.001) (0.003) (0.003) (0.0002)
Year 2001–02 0.025 0.004 20.002 0.004 0.000 20.014 20.013 0.0001
(0.005) (0.003) (0.001) (0.001) (0.001) (0.003) (0.003) (0.0002)
DC* 0.019 0.004 0.000 0.011 20.001 0.000 20.022 0.0005
Year 1998–99 (0.027) (0.010) (0.002) (0.007) (0.002) (0.014) (0.009) (0.0005)
DC* 0.169 20.020 20.002 0.003 20.004 20.039 20.015 0.0001
Year 2000–01 (0.018) (0.007) (0.002) (0.005) (0.002) (0.011) (0.010) (0.0003)
DC* 0.160 0.008 20.002 20.002 20.002 20.054 20.041 0.0001
Year 2001–02 (0.018) (0.010) (0.002) (0.004) (0.002) (0.009) (0.007) (0.0003)
Observations 74734 74734 74734 74734 74734 74734 74734 74734
Note: The coefficients on DC*year interactions measure the change in probability of attendance for DC residents relative to the change for MD and VA residents. (The baseline year was 1999–2000.) To ensure comparability as the Pell Grant maxima increased, the sample was limited to Pell Grant recipients with an EFC < 2600 from DC, MD and VA during the 1998–99 through 2001–2002 award cycles. The above represent marginal effects on probabilities evaluated at the mean characteristics of the sample or subsample, based on probit specifications. Other covariates included dummy variables for mother’s education, father’s education, four income categories, four asset categories, a zero EFC indicator and a zero asset indicator.
Journal
of
Human
VIII. Impact on College Entry
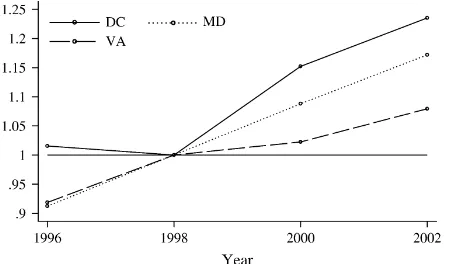
The results above suggest that the D.C. TAG program had a large im-pact on the types of colleges chosen by D.C. residents. However, there also has been a large increase in the proportion of youth from D.C. choosing to enter any college. Figure 4 reports the proportional increases in the number of D.C., Maryland, and Virginia students reported as first-time freshmen (recent high school graduates) in the IPEDS data, the number of FAFSA applications filed by dependent first-time college students, and the number of first-time college students who received a Pell Grant. Between 1998 and 2002, there was a 23 percent increase in the number of D.C. residents reported as first-time freshmen by colleges and universities around the country. Between 1999 and 2001, there was a 15 percent increase in the number of FAFSA applications submitted by dependent first-time freshmen in the District of Columbia. Moreover, there was a 21 percent increase in the number of first-time freshmen Pell Grant recipients from the District.18All three increases were consid-erably larger than the changes observed in Maryland or Virginia. Over the same time period, the number of graduates from D.C. public high schools remained flat.19
The D.C. TAG program created a number of low-cost options that had not been available previously to residents of the district. Kane (1999) used variation in tuition at public two- and four-year colleges across states to evaluate the impact on college enrollment using the cross-section of the National Education Longitudinal Study. According to Table 1, the D.C. TAG program lowered the tuition cost for D.C. res-idents of public two- and four-year colleges in Maryland and Virginia by approxi-mately $3,000 and $6,200, respectively. Based only on the cross-sectional variation in state tuition policies, Kane’s estimates would have implied a 25-percentage-point rise in college enrollment.20 Therefore, the increases in enrollment, applications, and Pell Grant recipients that occurred following the creation of D.C. TAG program seem consistent with prior cross-sectional estimates.
However, it may not be appropriate to attribute all of the increase to the D.C. TAG program. The D.C. College Access Program (D.C. CAP)—a private program funded primarily by corporations and foundations—also began operations in six public high schools in D.C. for those graduating in the spring of 2000. The program was ex-panded to all D.C. public high schools the following year. The program provided col-lege counselors in the high schools and ‘‘retention advisers’’ to help students remain in college. The program also provided $2.2 million in scholarships to D.C. residents in the 2002–2003 school year, as compared to $17 million for the D.C. TAG program that year.
18. I am only counting Pell Grant recipients with expected family contribution (EFCs) below $2,600. As a result, this is not simply due to the growth in the Pell Grant maximum over time.
19. The number of D.C. public high school graduates for the years 1998 through 2002 was 2,777, 2,675, 2,695, 2,808, and 2,894, respectively.
Figure 4
Proportional Changes in Enrollment, Number of FAFSA Applications and Pell Grant Recipients by State and Year Note: Year refers to fall of academic year.
Journal
of
Human
The D.C. CAP probably accounts for some share of the increase in enrollment ob-served over that time period. The expansion of the D.C. CAP to all the district public high schools in the fall of 2000 corresponded with the rise in the proportion of low-income D.C. residents applying to public institutions in Maryland and Virginia, as reported in Figure 4. But the D.C. CAP probably does not account for all of the in-crease. Recall that much of the rise in college enrollment for D.C. residents seemed to occur for those graduating from high school in the spring of 2000, when the D.C. CAP would have been serving only six of the 16 public high schools in D.C.
IX. Distributional Impact
When subsidizing public institutions, states typically offer the same low-tuition policies to all resident students, regardless of need. Similarly, the D.C. TAG program is not means tested. Unfortunately, because income data were not con-sistently collected for D.C. TAG recipients, it is not possible to use administrative data to measure directly the income or family background of recipients of D.C. TAG aid.21As a result, I use the domicile information to identify the characteristics of the neighborhoods in which the D.C. TAG recipients were living.
Out of 4,980 observed who received D.C. TAG aid at some point between 2000 and 2002 (those receiving grants in multiple years are counted only once), domicile data were matched to block group identifiers from the 2000 U.S. Census for 96 per-cent of the cases. There were 426 block groups within the District of Columbia, with a median population of 1,100 in the 2000 Census.22
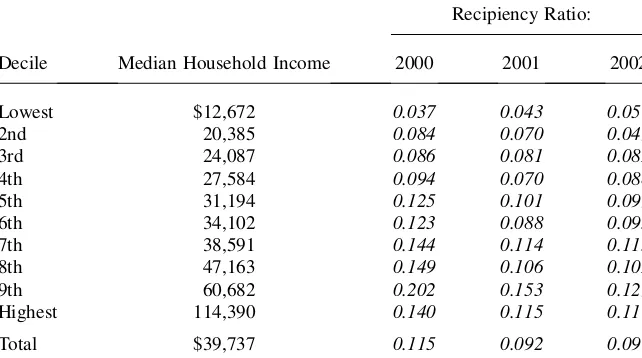
A simple map of the residential locations of recipients reveals that they were spread out across the District, including low-income neighborhoods (see Kane 2004).23However, beyond offering a sense of geographic dispersion, it is difficult to measure systematically the relationship between neighborhood income and recip-ient rates with such figures. To evaluate differences in receipt of D.C. TAG aid in high- and low-income neighborhoods, I calculated the total number of new grants (not counting renewed grants) in each block group in each year. Then, for each block group I calculated the ratio of the number of new grants in each year to the number of own and related children between the ages of 15 and 17 in the block group at the time of the 2000 Census.24Finally, I sorted each of the block groups into ten deciles, based on median household income in the block group. Table 7 reports the mean re-cipient ratio for the census tracts in each of these neighborhood income deciles.
There are three facts worth noting. First, the recipient ratio rises substantially be-tween the neighborhoods in the lowest decile and those in the fifth decile. In the first
21. They do collect tax returns to confirm family domicile. Such data could potentially be used to identify incomes of recipients. Moreover, in 2003–2004 they began to collect information on applicants’ incomes, but such data were not available for the early years of the program.
22. Of these 426 neighborhoods, there were 28 block groups with more that 50 people living in college dormitories—presumably parts of college campuses. These block groups were dropped.
year of the program, neighborhoods in the fifth decile of neighborhood incomes (with a median household income of $31,194) had a mean recipient ratio roughly three times the recipient ratio in the bottom decile (0.125 versus 0.037). Second, for the fifth-decile neighborhoods and higher, the differences in the recipient rate associated with neighborhood income are much smaller. For instance, the recipient ratio in the highest-decile neighborhoods (with a median household income of approximately $114,390) was 0.140, only slightly higher than for the recipient ratio for the middle decile. In fact, the recipient ratio seems to peak around the ninth decile and then declines between the ninth and tenth deciles. Finally, the differences in the neighbor-hood recipient ratios seem to flatten out between 2000 and 2002.
The higher recipient ratios in middle- and higher-income neighborhoods reflect some combination of two effects: differences in the proportion of youth entering col-lege, and differences in the proportion of youth attending the types of institutions that qualify for the grants. Even though college enrollment rates tend to rise monotoni-cally with family income, Kane (1999) reports that higher-income families are more likely to attend private institutions—few of which would have qualified for D.C. TAG aid. The greater likelihood of attending private institutions at higher income levels may partially offset the regressivity arising from the greater likelihood of at-tending college at higher income levels. This may explain the flattening out of the recipient ratios by neighborhood family income.
Median HH Income in Block Group
Recipiency Ratio:
Decile Median Household Income 2000 2001 2002
Lowest $12,672 0.037 0.043 0.057
2nd 20,385 0.084 0.070 0.049
3rd 24,087 0.086 0.081 0.082
4th 27,584 0.094 0.070 0.088
5th 31,194 0.125 0.101 0.099
6th 34,102 0.123 0.088 0.093
7th 38,591 0.144 0.114 0.115
8th 47,163 0.149 0.106 0.102
9th 60,682 0.202 0.153 0.129
Highest 114,390 0.140 0.115 0.117
Total $39,737 0.115 0.092 0.091
Using data provided by program administrators, I also calculated the proportion of recipients reporting to have graduated from different types of high schools. The vast majority of recipients (74 percent) graduated from a regular D.C. public school, while another 4 percent attended public charter schools in D.C. and 5 percent attended public schools outside D.C. Seventeen percent of recipients attended private high schools.
X. Conclusion
The D.C. Tuition Assistance Grant program dramatically changed the menu of college prices offered to residents of the District of Columbia. Between 1998 and 2000, when the effective price of public two- and four-year colleges for D.C. residents was reduced by approximately $3,000 and $6,200, respectively, the number of D.C. residents attending public institutions in Virginia and Maryland more than doubled. When public institutions in other states were included in subsequent years, there were also large increases in D.C. students enrolling in public institutions in more distant states, although the percentage changes were smaller. The increases were largest at nonselective public four-year institutions in the Mid-Atlantic States, particular predominantly black public institutions.
The D.C. TAG program also seems to have had a large impact on the percentage of D.C. residents entering college. The number of first-time federal financial aid appli-cants, the number of first-year college students receiving Pell Grants, and the number of freshmen from D.C. reported by colleges and universities nationally all increased by 15 percent or more. The magnitude of the increase was consistent with prior estimates of the effect of tuition changes on enrollment, based primarily on cross-sectional data.
Although the program did seem to have an impact on the proportion of youth en-tering college, it also led to a widespread reshuffling of students from private non-profit and proprietary schools toward public colleges and universities, particularly in Maryland and Virginia. As Peltzman (1973) recognized, the net effect of in-kind subsidies to higher education (those that are limited to public higher education insti-tutions) on bachelor’s degree completion rates and total investments in higher edu-cation is ambiguous. On the one hand, more people seem to be entering college. On the other hand, actual expenditures per student and BA degree completion rates tend to be lower at public institutions than at the private institutions they left behind. The net effect of the D.C. TAG program on the proportion of D.C. residents complet-ing higher education degrees and in the quality of education they receive remains to be seen. Future work will need to focus on changes over time in eventual BA com-pletion and the quality of education received by D.C. residents by comparing the out-comes of those who graduated from D.C. high schools in 2000 and after with the outcomes for those who graduated in earlier years.
References
Cameron, Stephen V., and James J. Heckman. 1998. ‘‘Life Cycle Schooling and Dynamic
Selection Bias: Models and Evidence for Five Cohorts of American Males.’’Journal of
Political Economy106(2):262–333.
Card, David, and Thomas Lemieux. 2000. ‘‘Dropout and Enrollment Trends in the Post-War Period: What Went Wrong in the 1970’s.’’ NBER Working Paper 7658. Cambridge, Mass.: National Bureau of Economic Research.
Dynarski, Susan. 2000. ‘‘Hope for Whom? Financial Aid for the Middle Class and Its Impact
on College Attendance.’’National Tax Journal53(3):629–62.
———. 2003. ‘‘Does Aid Matter? Measuring the Effect of Student Aid on College
Attendance and Completion.’’American Economic Review93(1):279–88.
———. 2004. ‘‘The New Merit Aid.’’ InCollege Choices: The Economics of Where to Go,
When to Go and How to Pay for It.Ed. Caroline Hoxby, 63-100, Chicago: University of Chicago Press.
Hansen, W. Lee, and Burton Weisbrod. 1969. ‘‘The Distribution of Costs and Direct Benefits
of Public Higher Education: The Case of California.’’Journal of Human Resources
4(2):176–91.
———. 1971. ‘‘On the Distribution of Costs and Benefits of Public Higher Education:
Reply.’’Journal of Human Resources6(3):363–74.
Hartman, Robert. 1970. ‘‘A Comment on the Pechman-Hansen-Weisbrod Controversy.’’
Journal of Human Resources5(3):519–23.
Kane, Thomas J. 1994. ‘‘College Attendance by Blacks since 1970: The Role of College Cost,
Family Background and the Returns to Education.’’Journal of Political Economy102(5):
878–911.
———. 1999.The Price of Admission: Rethinking How Americans Pay for College.
Washington, D.C.: Brookings Institution and Russell Sage.
———. 2004. ‘‘Evaluating the Impact of the D.C. Tuition Assistance Grant Program.’’ NBER Working Paper, No. 10658. Cambridge: Mass.: National Bureau of Economic Research.
Leslie, Larry L., and Paul T. Brinkman. 1988.The Economic Value of Higher Education. New
York, N.Y.: Macmillan.
Manski, Charles I., and David A. Wise. 1983.College choice in America. Cambridge, Mass.:
Harvard University Press.
McFadden, Daniel. 1974. ‘‘Conditional Logit Analysis of Qualitative Choice Behavior.’’ In
Frontiers in Econometrics,ed. Paul Zarembka, 105–42. New York: Academic Press. Pechman, Joseph A. 1970. ‘‘The Distributional Effects of Public Higher Education in
California.’’Journal of Human Resources5(3):361–70.
———. 1971. ‘‘The Distribution of Costs and Benefits of Public Higher Education: Further in
Comments.’’Journal of Human Resources6(3):365–76.
Peltzman, Sam. 1973. ‘‘The Effect of Government Subsidies-in-Kind on Private
Expenditures: The Case of Higher Education.’’Journal of Political Economy81(1):1–27.
U.S. General Accounting Office. 2002.D.C. Tuition Assistance Grants: Program May
Increase College Choices, but a Few Program Procedures May Hinder Grant Receipt for Some Residents.GAO Report 02–265. Washington, D.C.: U.S. General Accounting Office. University of Virginia, Statistics & Facts. University of Virginia. Accessed October 3, 2006
from http://www.virginia.edu/stats&facts/.
van der Klaauw, Wilbert. 2002. ‘‘Estimating the Effect of Financial Aid Offers on College
Enrollment: A Regression-Discontinuity Approach.’’International Economic Review
43(4).
Walzer, Philip. 2003. ‘‘Portion of In-State Admissions Rises: Balance Responsibility to