Citation: Sujatha K, Srilatha Ch, Rao TSC and Sreenivasulu D. Lead Residues in Different Animal Tissues at Selected Areas of Chittoor District of Andhra Pradesh, India. Austin J Vet Sci & Anim Husb. 2016; 3(2): 1026. Austin J Vet Sci & Anim Husb - Volume 3 Issue 2 - 2016
ISSN: 2472-3371 | www.austinpublishinggroup.com
Sujatha et al. © All rights are reserved
Austin Journal of Veterinary Science &
Animal Husbandry
Open Access
Abstract
The present study was aimed to know the concentrations of lead in different tissues of cattle and sheep found in different localities of Chittoor district of Andhra Pradesh, India. From cattle and sheep, a total of 120 samples and 80 samples of liver, kidney, muscle and testis were collected from different selected areas in Chittoor, Tirupati and Renigunta. These samples were subjected to acid digestion method and estimated lead concentration by following atomic absorption spectrophotometer. The highest concentration of lead was observed in kidneys (1.00 mg/kg) followed liver (0.6 mg/kg) and muscle (0.5 mg/kg) of cattle reared in and around Renigunta when compared to other areas. The samples of sheep collected from two different urban areas revealed highest lead content in kidneys (0.23 mg/kg) followed by liver (0.10 mg/kg) muscle (0.09 mg/kg) and testis (0.02 mg/kg) of sheep samples which were collected from Chittoor urban area when compared to the samples of Tirupati Urban area. The lead concentration was high in different tissue samples (Kidney, liver, muscle) of cattle when compared to sheep tissue samples.
Keywords: Lead residues; Atomic absorption spectrophotometer; Cattle; Sheep; Tissues; Polluted areas
interferes with the development of the nervous system and is therefore particularly toxic to children, causing potentially permanent learning and behavior disorders [5].
he aim of the present study was to evaluate the concentrations of lead in liver, kidney, muscle and testis of cattle and sheep which are liable to contamination by lead. Also the investigation provided information about the concentration of lead in diferent selected areas in Chittoor district of Andhra Pradesh.
Ma te ria ls a n d Me th o d s
For estimation of lead residues in animal tissues, those that are reared in diferent polluted areas were selected for tissue residual analysis.
From cattle a total of 120 samples of liver, kidney, muscle and testis were collected from diferent areas in Chittoor (polluted area i.e. in and around Nutrine & Sugar factory), Tirupati (polluted Battery factory area) and Renigunta (polluted & heavy traic area and near-by Railway station). Tissues were also collected from sheep a total of 80 samples which represent four organs (liver, kidney, muscle & testis) from Chittoor (polluted & factories area) and Tirupati (polluted area). he samples were collected randomly, irrespective of age, sex and breed. All the samples in cattle and sheep were packed separately and stored at -20°C until analysis.
he tissue samples of cattle and sheep were subjected to acid digestion method [6], then these samples were used for lead residual estimation by following the method of Perkin-Elmer 3100 (USA) double-beam atomic absorption spectrophotometer with hallow cathode lamp of lead.
In tro d u ctio n
Metal intoxication is one of the most frequent diseases in farm animals, particularly in those grazed on pasture in the vicinity of metallurgic/other industrial complexes, mining communities and busy roads. Grazing animals are directly afected by the consumption of forage and feed contaminated by airborne lead and somewhat indirectly by the up-take of lead or other metals through plant roots. he risk of metal poisoning through the food chain increases as the soil metal level rises above the permissible concentration for a given metal [1,2]. his implies that grazing animals are more at risk as forage grasses are consumed directly without being washed.
Lead is the most important poison to the farm animals. For farm animals signiicant pollution is likely to occur from lead mining, painted and metallic lead in storage batteries, licking paints/puttyans from rubbish dumps. Areas near lead industrial establishments may be enriched by aerial deposition as a consequence; soil pollution as well as quality deterioration of edible portions of vegetation can be produced due to metal enrichment. Animals by eating this vegetation can accumulate enough lead to produce clinical signs of lead poisoning. Young animals are usually poisoned when they lick painted pens, troughs etc because of allatrophagia. Chronic lead poisoning commonly seen in young children from sucking lead paint or lead toys, in workers engaged in painting and petroleum industries.
Lead is a metabolic poison and a neurotoxin that binds to essential enzymes and several other cellular components and inactivates them [3]. Toxic efects of lead are seen in haemopoeitic, nervous, gastrointestinal and renal systems [4]. It interferes with a variety of body processes and is toxic to many organs and tissues including the heart, bones, intestines, kidneys, reproductive and nervous systems. It
Research Article
Lead Residues in Differen t An im al Tissues at Selected
Areas of Chittoor District of An dhra Pradesh, In dia
S u ja th a K*, S rila th a Ch , Ra o TS C a n d S re e n iva s u lu D
Departm en t of Veterin ary Pathology, College of Veterin ary Scien ce, Sri Ven kateswara Veterin ary Un iversity, In dia
*Co rre s p o n d in g a u th o r: Sujatha K, Departm en t of Veterin ary Pathology, College of Veterin ary Scien ce, Sri Ven kateswara Veterin ary Un iversity, Tirupati-51750 2, An dhra Pradesh, In dia
Re ce ive d : August 26, 20 16; Acce p te d : Decem ber 0 6,
Austin J Vet Sci & Anim Husb 3(2): id1026 (2016) - Page - 02
Sujatha K Au s tin Pu blis h in g Gro u p
Submit your Manuscript | www.austinpublishinggroup.com
Re s u lts
Tissue lead content in cattle
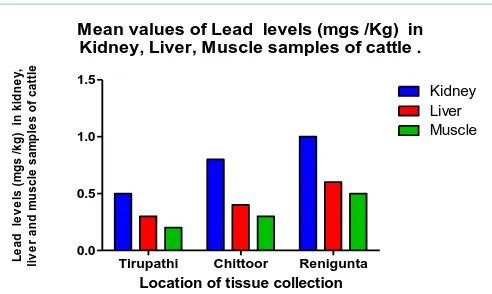
he mean concentrations of lead in analyzed samples of cattle kidney, liver and muscle which were collected from urban and heavy traic areas such as Tirupati, Chittoor and Renigunta and the values are 0.50, 0.80 and 1.00 (Kidney), 0.30, 0.40 and 0.60 (Liver) and 0.20, 0.30 and 0.50 (muscle) mg/kg respectively and was shown in Table 1 and Figure 1. he levels of lead varied according to the locality and organ, among the tissues the highest concentrations of lead were detected in kidney followed by liver and muscle samples of cattle that lived in and around Renigunta when compared to other mentioned areas (Tirupati and Chittoor).
Tissue lead content in sheep
he data pertaining to the pooled tissue lead content in sheep was displayed in Table 2 and Figure 2 and the values of lead in pooled kidney, liver, muscle and testis of sheep that lived at Tirupati and Chittoor were 0.21 and 0.23, 0.10 and 0.10, 0.07and 0.09, 0.01and 0.02 (mg/kg) respectively. he highest concentration of lead was noticed in kidney followed by liver, muscle and testis of sheep that lived at Chittoor when compared to Tirupati area. Whereas no signiicant diference was found in liver lead level of sheep that reared in both areas.
D is cu s s io n
he highest concentration of lead was observed in kidneys (1.00 ppm) followed liver (0.6 ppm) and muscle (0.5 ppm) of cattle reared in and around Renigunta when compared to other areas like Chittoor and Tirupati. Abou Donia [7] noticed highest concentration in kidney (0.59±0.790 mg/kg), Liver (0.510 & 0.623 mg/kg) and muscle (0.09 mg/kg). Mariam et al. [8] reported mean lead concentration of 2.18±0.38 ppm and 2.02±0.44 ppm for livers and kidneys respectively of beef in Lahore. he results indicates that the concentration of lead in the livers and kidneys were less than permissible limit of 1 ppm [9].
In present study the samples of sheep collected from two diferent urban areas revealed highest lead content in kidneys (0.23 mg/ kg) followed by liver (0.10 mgs/kg) muscle (0.09 mg/kg) and testis (0.02 mgs/kg). he highest concentration of lead was noticed in sheep samples collected from Chittoor urban area when compared to the samples of Tirupati Urban area. he values recorded in this study were lower than maximum permissible level of 1 ppm and the least concentration was noticed in testis of sheep. In contrary to the present indings Gervos et al. [10] reported higher concentration of lead in liver (0.85 mg/kg) followed by kidney (0.36 mg/kg) and meat (0.04 mg/kg).
he lead concentration was high in diferent tissue samples (Kidney, liver, muscle) of cattle when compared to sheep tissue samples. Coni et al. [11] determined the levels of lead in the speciic organs of cow, sheep and goat and found that liver and kidney of cows had higher levels of lead than the liver and kidney of sheep and goat. he lower lead levels in sheep might be due to slaughtering at early age and generally sheep will be maintained in far away from urban area hence exposure to less pollution. No reports available to compare this.
Co n clu s io n
Cattle and other animals serve as bio-indicators of environmental contamination with heavy metals. he presence of lead in the tested samples of animal tissues serves as an indication that the environment where these animals grazed before they were purchased for slaughtering was contaminated with lead. Consumption of meat of these animals may pose a serious health problem to man especially children <5 years old as a result of bioaccumulation of lead in the
Kidney, Liver, Muscle samples of cattle .
Location of tissue collection
Figure 2: Mean Values of lead levels (mgs/kg) in kidney, liver, muscle and
testis samples of sheep.
Locality KIdney LIver Muscle
Tirupati 0.5±0.029 0.03±0.012a 0.2±0.025ab
Chittoor 0.8±0.23 0.4±0.34a 0.3±0.25a
Renigunta 1±0.03 0.6±0.04a 0.50±0.5a
Table 1: Lead levels (mg /kg) in kidney, liver and muscle samples of cattle from
different regions (mgs/kg).
Mean values with different superscripts differ signiicantly (P < 0.05); ANOVA;
SE: Standard Error.
Localities Kidney Liver Muscle Testis
Tirupathi 0.21±0.015 0.10±0.0089a 0.07±0.0025a 0.01±0.0012abc
Chittoor 0.23±0.010 0.10±0.009a 0.09±0.002a 0.02±0.0032abc
Table 2: Mean values of Lead levels (mgs/kg) in kidney, liver, muscle and testis
samples of sheep (mgs/kg).
Mean values with different superscripts differ signiicantly (P < 0.05); ANOVA;
Austin J Vet Sci & Anim Husb 3(2): id1026 (2016) - Page - 03
Sujatha K Au s tin Pu blis h in g Gro u p
Submit your Manuscript | www.austinpublishinggroup.com
body tissues. his however varies among individuals and depends on duration of exposure.
References
1. Singer MJ, Hanson L. Soil Science Society of America Proceedings. 1969; 33: 152-153.
2. Rolfe GL, A Haney, Reinbold KA. Ecosystem Analysis. Institute for Environmental Studies. University of Illinois, Urbana-Champaign. 1977; 112.
3. Cunningham, Saigo. Environmental Science a Global concern, 4th edition
WMC Brown Publisher, New York. 1997; 389.
4. Baykov BD, Stoyanov MP, Gugova ML. Cadmium and Lead bioaccumulation in male chickens for high food concentration. Toxicology Environmental Chemistry. 1996; 54: 155-159.
5. Venkatesh T, Shambhavi T. Treating Lead Toxicity: Possibilities beyond Synthetic Chelation. JKIMSU. 2013; 2: 4-31.
6. Kolmer JA, Spaudling EH, Robinson HW. Approved lab technique, 5th edition,
Appleton century– crofts. Inc. Newyork. 1951; 1090-1091.
7. Abou Donia MA. Lead concentrations on different animals muscles and
consumable organs at speciic localities in Cairo. Global Veterinaria. 2008;
2: 280-284.
8. Mariam I, IQbal S, Nagra SA. Distribution of some trace and Macrominerals
in beef, mutton and poultry. International Journal of Agricultural and Biology. 2004; 5: 816-820.
9. Iwegbue CMA. Heavy metal composition of livers and kidneys of cattle from
Southern Nigeria. Veterinary Archives. 2008; 78: 401-410.
10. Gervos Hans, Lammers Wount, Van Delft. Arsenic, Cadmium, lead and
mercury in meat, livers and kidneys of sheep slaughtered in the Netherlands.
Zeits chrift Fur lebensmittelunter suchung and forschung A. 1998; 187: 1-7.
11. Coni E, Bocca A, Coppolelli P, Corolis C, Cavallucci M, Marinucci T. Minor and trace element content in sheep and goat milk and dairy products. Food Chemistry. 1996; 17: 253-260.
Citation: Sujatha K, Srilatha Ch, Rao TSC and Sreenivasulu D. Lead Residues in Different Animal Tissues at Selected Areas of Chittoor District of Andhra Pradesh, India. Austin J Vet Sci & Anim Husb. 2016; 3(2): 1026. Austin J Vet Sci & Anim Husb - Volume 3 Issue 2 - 2016
ISSN: 2472-3371 | www.austinpublishinggroup.com