ANALYZING THE CUSTOMER DECISION MAKING ON USING
KARTU HALO TELKOMSEL IN MANADO BASED ON
PSYCHOGRAPHIC SEGMENTATION
Prischa Rarung
1, David P. E. Saerang
2, Frederik Worang
3 123Jurusan Manajemen – Internatinal Business Administration (IBA) Program Fakultas Ekonomi dan Bisnis, Universitas Sam Ratulangi,Manado, 95114, Indonesia
E-mail: [email protected]
ABSTRACT
The new inventions in communication technology caused the industries development in telecommunication aspect grows rapidly. Telkomsel is a telecommunication service company that runs in GSM (Global System for Mobile Communication) basis which offer some kind of cellular cards to the consumers. This research is conduct in Manado, North Sulawesi. The objectives of this research are to analyze the customer decision making on using Kartu Halo based on psychographic segmentations, partially and simultaneously. This research is the causal type of research where it will investigate the influence of factors towards decision making on using Kartu Halo. Use multiple regression models to answer the resea rch problem. The population in this study is a consumers of Kartu Halo, whereas samples taken by each respondent 100 respondents. The hypothesis testing, this research conduct a conclusion of there is a significant influence of Attitude, Value and Lifestyle simultaneously and there is a significant influence of Lifestyle partially on customer decision making on using Kartu Halo. This study reveals that customers lifestyle has a strong influence factors in order to use Kartu Halo.
1. INTRODUCTION
Research Background
The new inventions in communication technology caused the industries development in telecommunication aspect grows rapidly. In the middle of telecommunication industry development there must be lots of companies run their businesses within the industry to advance their business and maximize profits that brings tight competition among those companies. All of
them try to win consumer’s heart to buy the product they offer. Thus, the consumer is faced
with a lot of choices in satisfying their needs.
As we know one of the characteristics in communication technology development recently is minimization, cheap and practical in giving and receiving the desired information. This characteristic is what the consumer needs to satisfy their desire in communication. The
information tool that can fulfill the consumer’s needs in cellular phone which can easily obtained in market nowadays. This trend drive the society starts from lower, middle and upper level to enjoy the communication technology. Along with the communication technology
advance, there’s shifting in society’s behavior especially about their needs in doing long distance communication. Previously the consumers who will make a long distance call have to go to the telephone office to make it. But nowadays with the advance and innovations in telecommunication sector the consumers will be easier, cheap and practical in doing communication. Surely the industry and the telecommunication companies attempt to increase
their product’s quality and the telecommunication service quality so the consumer’s may satisfy.
When the consumers get the satisfaction the companies of course will gain profits from time to time.
PT. Telkomsel is a telecommunication service company that runs in GSM (Global System for Mobile Communication) basis which offer some kind of cellular cards to the consumers. PT. Telkomsel issued some cellular cards such as Kartu Halo, simPATI and Kartu As. In order to win the market, the company must able to determine to whom the product have to sell. This thing known as market segmentation, where the market is divided into some segments like geographic segmentation, demographic segmentation, psychographic segmentation and behavioral segmentation. This thing executed because of any kind of purpose but mainly to
serve consumer better and fix the company’s competitive position.
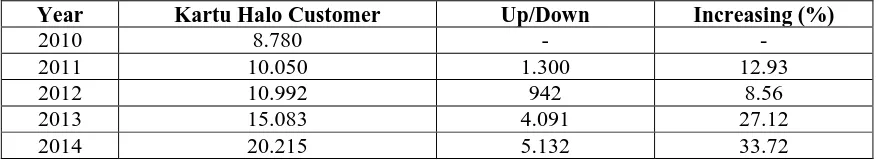
Therefore, the customer of Kartu Halo in PT. Telkomsel Manado on year 2010-2014 is as follow:
Table 1.1. The customer amount development of Kartu Halo in PT. Telkomsel Manado from year 2011-2015
Year Kartu Halo Customer Up/Down Increasing (%)
2010 8.780 - -
2011 10.050 1.300 12.93
2012 10.992 942 8.56
2013 15.083 4.091 27.12
2014 20.215 5.132 33.72
Based on the Table 1.1 we may see that the customer of Kartu Halo PT. Telkomsel is increase every year and the highest increasing is in 2014 which is 33.72%. The customer of Kartu Halo is focused on the consumer who have stable income because Kartu Halo is a post-paid card.
Theoritical Review Marketing
Kotler, et.al (2005:5) broadly defined marketing as “a social and managerial process by which
individuals and groups obtain what they need and want through creating and exchanging value with other. In marketing, there are three major steps when company wants to create value and
attract customers. According to Kotler, et.al (2005:192), “first, market segmentation dividing a
market into distinct groups with distinct needs, characteristics, or behavior who might require separate products or marketing mixes.
Consumer Behavior
Consumer behavior includes a series of mental and physical processes that continues through before and after purchase. (Peer & Olsen, 1999). Studying consumer behavior includes the study of what, how, and why people are buying. Consumer behavior indicates how consumer decisions are made, how the goods or services are used (Mc Daniel, 2003). Berkman and Gilson explain consumer behavior as activities in which people are involved in actual or potential use of various products of market including goods, services, ideas and environment of the market.
Market Segmentation
The market segmentation is mentioned as being one of the key elements of modern marketing and is, as mentioned, the process of dividing the market into several groups and/or segment(s) based on factors such as demographic, geographic, psychological and behavioral factors. By doing so the marketers will have a better understanding of their target audience and thereby make their marketing more effective (Gunter and Furnham, 1992: 1).
Psychographic Segmentation
Psychographic segmentation therefore divides people according to their attitudes, values and lifestyles (Pickton and Broderick, 2005: 377).
1. Attitudes
Kotler defines attitude as “a person’s enduring favorable or unfavorable cognitive
evaluations, emotional feelings, and action tendencies toward some object or idea”.
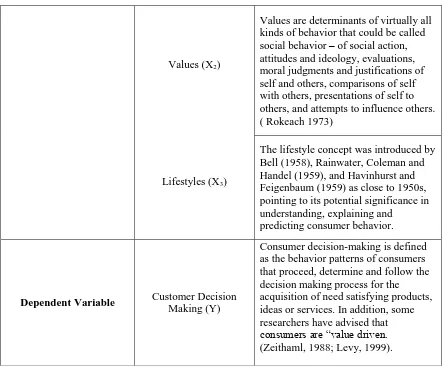
2. Values
Values are determinants of virtually all kinds of behavior that could be called social behavior – of social action, attitudes and ideology, evaluations, moral judgments and justifications of self and others, comparisons of self with others, presentations of self to others, and attempts to influence others.
3. Lifestyles
2. RESEARCH METHODOLOGY
Type of Research
This research is causal type of research where it will analysis the customer decision making on using Kartu Halo based on psychographic segmentation.
Population and Sample
According to Sekaran and Bougie (2009), population is “the entire group of people, events, of things of interest that the researcher wishes to investigate”. The population that are mainly
observed in this current research is telkomsel customers. And According to Sekaran and Bougie
(2009), a sample is “a part of the population”. The sample of this research are telkomsel
customers as many as 100 customers or respondents. The sampling design is random sampling, collect sample of group, workers, students, and society or community.
Data Collection Method
For this current research, there are two types of data that are used to make a appropriate result, which are:
1. Primary data, in this study, the primary data get from respondent. The researcher also gets primary data from the result of questionnaires
2. Secondary data, The secondary data taken from journals, textbook and relevant literature from internet.
Operational Definition and Measurement of Research Variable
In this research, the general explanation about three variables in this current research that will be analyzed, are stated as follows:
Independent Variables: 1. Attitudes (X1) 2. Values (X2) 3. Lifestyles (X3)
Dependent Variable:
Customer Decision Making (Y)
Table Definition of Research Variables
Variables Definition
Independent Variables Attitudes (X1)
Attitude as “a person’s enduring favorable or unfavorable cognitive evaluations, emotional feelings, and action tendencies toward some object
Measurement of Research Variable
A scale is a tool or mechanism by which individuals are distinguished as to how they differ
from one to another on the variables of interest to our study. Likert Scale as “An Interval scale that specifically uses the five response categories ranging from ‘strongly disagree’ to ‘strongly agree’ which requires the respondents to indicate a degree of agreement or disagreement with a
series of statements related to the stimulus”.In this kind of scale, variables will be measured on
five points of scale (1, 2, 3, 4, and 5) as shown below:
Table Likert Scale Grading Point
(Source: Research Methods for Business, 5th edition, 2009) Values (X2)
Values are determinants of virtually all kinds of behavior that could be called social behavior – of social action, attitudes and ideology, evaluations, moral judgments and justifications of self and others, comparisons of self with others, presentations of self to others, and attempts to influence others. ( Rokeach 1973)
Lifestyles (X3)
The lifestyle concept was introduced by Bell (1958), Rainwater, Coleman and Handel (1959), and Havinhurst and Feigenbaum (1959) as close to 1950s, pointing to its potential significance in understanding, explaining and
predicting consumer behavior.
Dependent Variable Customer Decision Making (Y)
3. DATA ANALYSIS AND DISCUSSION
Data Analysis
Charactheristics based on Gender.
Source: Processed Data, 2016
First, most of respondents in this research are female respondents (61 respondents or 61% of the required sample) and the remaining one is male respondents (39 respondents or 39% of the required sample).
Charactheristics based on Age
Source: Processed Data, 2016
Second, most of respondents in this research are aged above 30 years old (59 respondents or 59% of the required sample), and is followed by: respondents who are aged between 26 until 50 Years Old (29 respondents or 29% of the required sample), respondents who are aged between 21 until 25 years old (7 respondents or 7% of the required sample) and the remaining one who are aged under 20 years old (5 respondents or 5% from the required sample).
39.39%
61.61%
Characteristic based on Gender
Male
Female
5.50%
7.70%
29.29% 59.59%
Characteristic based on Age
< 20 Years Old
21 until 25 Years Old
26 until 30 Years Old
Based on Educational Level
Charactheristic based on Educational Level
Source: Processed Data, 2016
Third, most of respondents in this research have Under Graduated as educational level (54 respondents or 54% of the required sample), and is followed by: respondents who have Diploma as educational level (28 respondents or 28% of the required sample), respondents who have Senior High School as educational level (10 respondents or 10% from the required sample) and the remaining one has other educational level that are excluded in this research (8 respondent or 8% of the required sample).
Validity and Reliability Test Validity Test
By comparing correlation index in Pearson Product Moment with significance level of 5%, it can be seen valid or not a research instrument. If probability of correlation is less than 0.05 (5%) then the research instrument is stated as valid.
Sum of Squares and
Cross-**. Correlation is significant at the 0.01 level (2-tailed).
Source: Data Processed 2016
From the table above, it can be seen that the validity for each variable is good where the values are above minimum level of 0.30 (Sekaran, 2003). It means that all independent variables in are above the minimum level.
Realibility Test
The purpose of reliability test is to check the consistency of a measurement instrument. The reliability test in this research uses Alpha Cronbach. A result of reliability test generated by using statistical software SPSS 24.0, and it is showed in table 5.1. if Alpha is less than 0.6 then it is unreliable. The interpretation of Alpha Cronbach (Sekaran, 2003:) is:
- <0.6 indicates unsatisfactory internal consistency or consider that the data is unreliable.
- 0.7 indicates that the data is acceptable
- 0.8 indicates good internal consistency or consider that the data result is reliable.
Moreover, it shows that the instrument is acceptable because the Alpha Cronbach coefficient has a value of 0.739; it proves that the data is up to standard and can move forward to the next step.
Reliability Test
Source: Data Processed 2016
Classic Asumption Multicollinearity
Multicollinearity is the intercorrelation of independent variables. This test is done by
determining the Tolerance and VIF value. This value is computed by the SPSS 24.0 software as shown in table 5.6.
Reliability Statistics
Cronbach's
Alpha N of Items
Table 5.6 Multicollinearity Test
Coefficientsa
Model
Collinearity Statistics Tolerance VIF
1 Attitudes .776 1.288
Values .838 1.193
Lifestyle .802 1.246 a. Dependent Variable:
Customer_Decision_Making
Source: Data Processed 2016
From table above, the tolerance of attitudes is 0.776, value is 0.838, lifestyle is 0.802, it means that the tolerance value of those three variables are more than 0.2, while the VIF value of reference attitudes is 1.288, value is 1.193, lifestyle is 1.246, it means that the VIF value of those three variables are less than 10, the model concluded to be free from multicollinearity.
Heteroscedasticity
One assumption of regression model is Heterocedasticity where models in which the error terms do not all have the same variance. In figure 5.7 were shown the result of heteroscedasticity test
Heteroscedasticity Test Output
Source: Data Processed 2016
Figure above, shows that the pattern of the dots is spreading and does not create a clear pattern, and the dots are spreading above and below 0 (zero) in the Y axis, thus this proves that the model is free from heteroscedasticity.
Normality Test
Normality Test
Source: Data Processed 2016
Figure above, shows that the data collected in this research that is represented by dots are spreading near the diagonal line and spreading follows the direction of the diagonal line. This proves that the model has passed the Normality Test.
Autocorelation
Autocorrelation Test Output
Model Summaryb
Model
Durbin-Watson
1 1.969
b. Dependent Variable: Customer_Decision_M aking
Source: Data Processed 2016
This table shows the critical value is 1.969, which means the model is free from autocorrelation. For more explanation see the table of Critical Values
This research used α = 0.05 to identify the autocorrelation which could be examined in table
5.10. From Table 5.10 shows that the critical value of Durbin-Watson are 1.969which in the area No Autocorrelation, concludes that the model is free from autocorrelation.
Hypothesis Test
Simultaneously Test
F-test is used to determine the whole effect of all independent variables to dependent variable. This test is done by comparing the Fcount with Ftable. If Fcount is higher than Ftable, H0 is rejected and H1 is accepted.
Table 5.11
F-Test Result
ANOVAa
Model
Sum of
Squares df
Mean
Square F Sig.
1 Regression 21.992 3 7.331 43.327 .000b
Residual 16.243 96 .169
Total 38.235 99
a. Dependent Variable: Customer_Decision_Making b. Predictors: (Constant), Lifestyle, Values, Attitudes
Source: Data Processed 2016
This value shows that overall independent variables namely:Attitudes, Values, and Lifestylehave strong and positive relationship with Customer Decision Making. Thus hypothesis is accepted.
Partially Test
T-Test is used to determine the partial effect of each independent variable to dependent variable. T-test value is obtained by comparing value of Tcount with Ttable,. If Tcount is higher than Ttable, then H0 is rejected and Ha is accepted. The values of each variable are shown on the table 5.12below:
T-Test Result
Dependent Variable
Tcount Ttable Description
X1 0.707 1.9849 Rejected
X2 1.268 1.9849 Rejected
X3 9.421 1.9849 Accepted
Discussion
The research was conducted in Manado. The total number of questionnaires is 100 derived from 100 respondents. The 100 questionnaires have been distributed among Kartu Halo users. The period of this research is during January 2016. The questionnaires were distributed to 100 respondents consisted of male andfemale respondent. There are 60%female respondents and 40% male respondent. The result indicates that female customers are mostly the users of Kartu Halo
The respondent are divided into four age groups, that is, those under 20 years old, 21 - 25 years old, 26 - 30 years old, and those above 30 years old. The highest number of respondents derived from age above 30 years old with 59% and the lowest number of respondents is age under 20 years old as much as 5%.
This research is conducted with Multiple Linear Regression Model where this research has identified Customer Decision Making as the dependent variable and other characteristics such as Attitudes, Value and Lifestyle as the independent variables. From this research shows that all independent variables have a positive relationship with the Customer Decision Making aas the dependent variable.
The multiple regression result showed that, attitudes (X1) doesn’t have significant influence on customer decision making, this result happen because some of respondents are not interested in Kartu Halo. Because they can get other cheaper provider and they have other reasons that
doesn’t discuss in this research study.
Value (X2) also does not has significant influence on Customer Decision Making on Kartu Halo. This may happen because some of the respondents still did not get the value on using Kartu Haloand they argued that every other provider is just as good Kartu Halo.
Lifestyle (X3) have significant influence on Customer Decision Making on Kartu Halo. Most of the respondents understand that using Kartu Halo can increase their lifestyle and also supported by the satisfaction when they use Kartu Halo.
4.
CONCLUSSION AND RECOMMENDATION
Conclusions
There are two constructive findings that can be concluded from the overall result in this research, which are listed as follow:
1. Attitude and Value does not have significant influence, while Lifestyle have significant influence on customer decision making on Kartu Halo
2. Based on this research, I found that Y = 1.122 + 0.049 x1 + 0.078 x2 + 0.614 x3 + Ɛ, it means the most significant influence factor is lifestyle.
Recommendations
There are two practical recommendations that can be concluded from the overall result in this research, which are listed as follow:
1. The marketing division of Kartu Halo in manado city need to be more focus on raising the awareness in order to increase the attitude and value to get more consumers. 2. On the other hand, Kartu Halo also needs to evaluate the most influential factor for
ensuring their products will always be choosing by people in Manado.
REFERENCES
Paper in Journal
[1] Bell, Wendell. (1958). “Social Choice, Lifestyle, and Suburban Residence” in the The Suburban Community, ed. William M. Dobriner, New York: G. P. Putnam’s Sons, 225-242
[2] Dibb, Sally and Simkin, Lyndon (1996).The market segmentation workbook: Target marketing for marketing managers Routledge. London
[3] Gunter, Barrie and Adrian Furnham (1992).Consumer profiles: An introduction to psychographics. Routledge, London.
[4] Havighurst, Robert, J., and Feigenbaum, K. (1959). Leisure and Life Style, American Sociologist, 64, 396-404.
[5] Hunjra, Ahmed Imran., Niazi, GhulamShabbir., Khan, Hashim. (2012). “Relationship Between Decision Making Styles And Consumer Behavior.”
[6] Kenney, Matthew & Weinstein, Art. (2010). “Psychographic Segmentation of The Self -employed: An Exploratory Study
[7] Kotler, P., Armstrong G., Ang Swee Hon, Leong Siew Meng, Tan Cin Thion, and TseDavid K.(2005), “Principles of Marketing An Asian Perspective”, Tenth Edition, Prentice-Hall: Singapore.
[8] Kotler, P. & Keller, K.L. (2009). Marketing Management, Twelfth Edition, Prentice-Hall, New Jersey.
[9] McDaniel, S.R. (2003). Reconsidering the relationship between sensation seeking and audience preferences for viewing televised sports. Journal of Sport Management, 17, 13-36.
[10] Peter, P. &. J. C. Olsen, (2005). Consumer Behavior and Marketing Strategy. McGraw-Hill Irwin 7th edition, New York.
[11] Pindyck, Robert S. and Daniel L. Rubinfeld.(2001). Microeconomics.5th Ed. Saddle River, NJ: Prentice Hall.
[12] Rainwater, Lee, Richard P. Coleman and Gerald Handel. (1959).Workingman’s Wife. Oceans Publications: New York.
[13] Rokeach, Sandra J. (1973). American Sociology Review. American Sociological Association