Brain Signals
Pouya Ghaemmaghami1
Abstract. Despite the rapid advances in Brain-computer Interfacing
(BCI) and continuous effort to improve the accuracy of brain decoding systems, the urge for the systems to reconstruct the experiences of the users has been widely acknowledged. This urge has been investigated by some researchers during the past years in terms of reconstruction of the naturalistic images, abstract images, video and audio. In this study, we try to tackle this issue by regressing the stimuli spectrogram using the spectrogram analysis of the brain signals. The results of our regression-based method suggest the feasibility of such reconstructions using the neuroimaging techniques that are appropriate for out-of-lab scenarios.
1
Introduction
Extracting stimulus-related information from the brain activity using machine learning algorithms is known as brain decoding which has been used widely in neuroscience community in the past decade. Prior works on brain decoding have mostly focused on the classification of the stimuli into a set of pre-defined cat-egories [10,4,18,28,3,6,9]. A typical classification pipeline includes the following steps: First, different categories of stimuli are presented to the participant of the experiment, while his/her concurrent brain activity is recorded. Then a machine learning algorithm is trained on the subset of the samples in order to learn the mapping function between the brain activity pattern and the stimulus category from a training data set. If the algorithm, can predict the target stimulus cat-egory of the remaining subset (test-set) better than the chance level, we can hypothesize that the stimulus-related information is encoded in the brain data. However, such classification approaches are not able to capture all aspects of the stimulus, since they are constrained by the stimulus category. Instead, a more challenging scenario can be the stimulus’ reconstruction that aims at recre-ating the stimulus using the recorded brain activity, free from the constraint of the categories [19]. Such scenario has been investigated by some researchers dur-ing the past years in terms of reconstruction of the naturalistic images [12,21], abstract images [16], video [22] and audio [23]. However, almost all of these stud-ies are conducted using either invasive methods or bulky expensive non-invasive methods such as fMRI (Functional magnetic resonance imaging) or MEG (Mag-netoencephalography) which are not appropriate for out-of-lab scenarios. In this study, instead, we try to tackle this issue using EEG (Electroencephalography)
S"muli Wave
EEG signal
S"muli Spectrogram
EEG Spectrogram
Regression Coefficients
S"muli Spectrogram Reconstruc"on
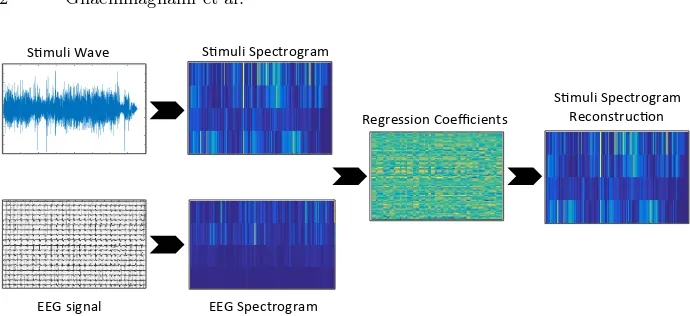
Fig. 1. Stimuli reconstruction pipeline:In the first step of the analysis the
spectro-gram of the EEG signal and audio wave (after generic preprocessing steps) is computed. Then, in the training phase, the EEG features are regressed (Ridge Regression) onto the audio spectrogram to find the proper mapping function. After that, the resulting weight matrix is used on the test EEG data to predict the spectrogram of the audio wave.
that is the most commonly used signal acquisition technique in BCI. In particu-lar, we aim at regressing the stimuli spectrogram using the spectrogram analysis of the EEG signal. Figure 1 illustrates the overall framework used in our study. To our knowledge, we are one of the first showing the possibility of reconstructing stimuli spectrogram using EEG signals.
The remainder of this study is organized as follows: Section 2 reviews related literature on this topic. Section 3 explains the employed dataset and the data analysis methods used for data compilation. The results of such analysis are pre-sented and discussed in Section 4. Finally Section 5 concludes this paper with the key observations and some possible future directions.
2
Literature Review
Reconstruction of someone’s experiences from his/her brain activity patterns can be considered as the ultimate goal of “Mind Reading”. During the past recent years, many researchers tried to tackle this task in many different ways using different neuroimaging modalities and different methodologies. Here, we briefly review some of the major works on this topic.
2.1 Reconstructing image-based stimuli
dependency between a brain region and a particular set of stimuli features. Once these models are learned, they can be employed to predict the brain activity patterns of the new stimuli. Such prediction can be validated by correlating the predicted brain response with the original brain response. This procedure was employed in numerous studies in order to reconstruct images [12,21], movies [22], remembered scenes [25,20] and handwritten characters [24]. However, in order to improve the quality of recosntruction, the authors generally used a database of priors [12,21,22], hence as authors in [22,24] conclude, the exact reconstruction is not possible and the quality of such reconstructions are highly dependent to the number and the quality of the priors. In other words, changing the prior, can yield to a completely different reconstruction.
Unlike these studies, Thirion et al. [27], Miyawaki et al. [19] and Kuo et al. [16] tried to reconstruct visual stimuli from brain activity, without any kind of image priors. This is based on the assumption that there exists a function that maps the visual stimuli with the corresponding brain responses elicited from such stimuli. By inverting this function, the stimuli can be reconstructed given the brain activity patterns. However, authors just used very simple-abstract images with limited shapes. Even in such case, the correlation coefficient between the reconstruction and the original stimulus was not significant for all stimulus and all subjects.
2.2 Reconstructing audio-based stimuli
Reconstructing audio-based stimuli has received less attention compared to the visual types of stimuli (i.e. images and videos). However, recently, researchers began to explore this type of stimuli as well. In [23,17], authors tried to recon-struct the spectro-temporal auditory features from neural responses using an invasive neuroimaging technique (ECoG). They obtained significant correlation, between the reconstructed spectrogram and the original wave spectrogram.
Strum et al., [26], tried to reconstruct the musical stimuli power-slope using a non-invasive approach (EEG). Using a Ridge Linear Regression approach, they were able to regress the temporally embedded EEG features into power-slope of the musical stimuli. However in most of the cases the correlation coefficient is very low and insignificant.
2.3 Spotting the gap
Our examination of the related literature reveals that reconstructing the experi-ences of the users are recently capturing attention across many communities and will be a hot topic with the continuous advances in signal acquisition techniques and machine learning algorithms. However, these studies are conducted using the neuroimaging techniques that are not appropriate for out-of-lab scenarios (except the work of [26] which is explained above and the works of [13,15] on hand movement reconstrcution). Since EEG is probably the most common sig-nal acquisition technique in BCI, hence, it would be interesting to investigate whether the EEG responses to the stimuli can be utilized to obtain information regarding the stimulus or not. In light of this, in the present study, we propose an approach to regress the spectrogram of the stimulus using spectrogram anal-ysis of the EEG signals in order to complement a possible link between stimulus structure and brain signals.
3
Materials and Methods
In this section, we describe the employed dataset, feature extraction scheme, and data analysis procedure.
3.1 Dataset
In our experiments, we used DEAP dataset [14] that contains the electroen-cephalographic (EEG) data of 32 participants who watched 40 music video clips. The music video clips were projected onto a screen at a screen refresh rate of 60 Hz. The electroencephalographic data were recorded at a sampling rate of 512 Hz using a 32 channel device.
3.2 Data Analysis
EEG Signal Processing: In this study, the pre-processed EEG data in [14] is employed and processed further. The whole processing steps are as follows:
1. Down-sampling the EEG signal to 128 Hz. 2. EOG artifacts removal.
3. Bandpass frequency filtering (4 - 45 Hz).
4. Estimating the spectral power of each channel of the EEG trials with a window size of 64 samples (500 milliseconds) with 8 samples overlap between windows.
The output of this procedure for each trial is a matrix with the following dimensions: 32 (number of the EEG sensors) × 4 (major frequency bands) ×
137 (number of segmented temporal windows).
Sensor Selection:Not all brain regions involve in processing the auditory in-formation in humans. The auditory cortex that is located bilaterally at the top of the temporal lobes, involves in perception and understanding of voices [2,29]. In light of this, in this study, we used the sensors located in the temporal area of the brain (T7 and T8). In order to increase the signal to noise ratio, for each subject and on each clip, we averaged the time-frequency outputs of these two sensors.
Stimuli Processing: For each stimulus (music video clip), the signal power is determined as follows:
1. Downsampling the audio signal to the sampling frequency of the EEG signal (128 Hz).
2. Segmenting the audio signal into the 12.5 % overlapping time frames of 500 milliseconds width.
3. Estimating the average signal power for each window for every frequency. 4. Calculating the stimuli spectrogram by averaging the signal power over four
frequency bands: theta (3:7 Hz), alpha (8:15 Hz), beta (16:31 Hz) and gamma (32:45 Hz). The output of this procedure is a 3-dimensional matrix with the following dimensions: 40 (number of the music video clips)×4 (major frequency bands)×137 (number of segmented temporal windows).
3.3 Regression Analysis
We adopted Linear Ridge Regression model (1) under leave-one-sample-out cross-validation schema in order to minimize the distance between the spectrogram of the EEG signals and the spectrogram of the audio signal. Thus, for a given stimulus on a particular subject a mapping function (β) is learned based on the EEG/Audio spectrogram of 39 stimulus in the training set (Xtrain). Then, the
mapping function is applied to the EEG spectrogram of the remaining stimulus in the test set (Xtest) in order to predict the spectrogram of the audio stimulus
(Y). Such procedure is repeated 40 times so that each stimulus for each subject is once used in the test set.
ˆ
βridge=argminkY −βXk22+λkβk22 (1)
4
Results
4.1 Experiment 1: Reconstructing Spectrogram
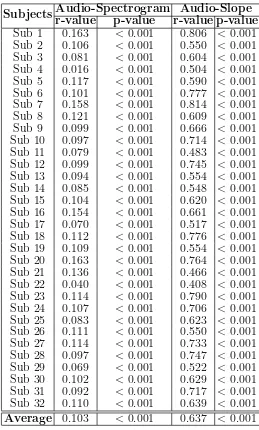
In the first experiment, we aimed at reconstructing the spectrogram of the au-dio stimulus from the EEG signals. On this, the auau-dio wave is smoothed using a Gaussian filter (σ= 2). Then, as explained in the previous section, we employed a ridge regression model for such task. Under leave-one out cross validation scheme, the model was trained using the 39 stimuli, and was tested on the re-maining stimulus. This has been done 40 times so that each stimulus was tested one time. The ridge parameter (λ) in the ridge regression model was tuned using a 5-fold cross validating in the “training set” by employing a range of values. Once, the audio signal (regarding the stimulus in the test set) is reconstructed using the EEG features, we calculate the Pearson correlation between the spec-trogram of the stimulus (in the test set) and the reconstructed specspec-trogram of the same stimulus using the EEG signals. This procedure, finds 40 correlation coefficient (r-values and their corresponding p-values) for each stimulus of each subject. To compare the results on a subject level basis, the correlation coeffi-cients are averaged for each subject. Accordingly, for each subject, the obtained p-values are fused over all clips using the Fisher’s method [5,1]. The results of such analysis are demonstrated in Table 1.
4.2 Experiment 2: Reconstructing Slope
In the second experiment, following [26], we aimed at reconstructing the slope of the audio stimulus from the EEG signals. On this, the audio signal power is averaged over all frequency bands (theta, alpha, beta and gamma). Subse-quently, the first derivative is taken and the resulting signal is smoothed using a Gaussian filter (σ= 2). Then, the same Linear Ridge Regression model under leave-one-sample-out cross-validation schema is adopted in order to predict the audio slope given the EEG signals spectrogram. The rest of the correlation anal-ysis is the same the first experiment. Table 1 demonstrates the results of such analysis.
5
Conclusion
Table 1. Correlation analysis.
Subjects
Audio-Spectrogram Audio-Slope
r-value
p-value
r-value p-value
Sub 1
0.163
<
0.001
0.806
<
0.001
Sub 2
0.106
<
0.001
0.550
<
0.001
Sub 3
0.081
<
0.001
0.604
<
0.001
Sub 4
0.016
<
0.001
0.504
<
0.001
Sub 5
0.117
<
0.001
0.590
<
0.001
Sub 6
0.101
<
0.001
0.777
<
0.001
Sub 7
0.158
<
0.001
0.814
<
0.001
Sub 8
0.121
<
0.001
0.609
<
0.001
Sub 9
0.099
<
0.001
0.666
<
0.001
Sub 10
0.097
<
0.001
0.714
<
0.001
Sub 11
0.079
<
0.001
0.483
<
0.001
Sub 12
0.099
<
0.001
0.745
<
0.001
Sub 13
0.094
<
0.001
0.554
<
0.001
Sub 14
0.085
<
0.001
0.548
<
0.001
Sub 15
0.104
<
0.001
0.620
<
0.001
Sub 16
0.154
<
0.001
0.661
<
0.001
Sub 17
0.070
<
0.001
0.517
<
0.001
Sub 18
0.112
<
0.001
0.776
<
0.001
Sub 19
0.109
<
0.001
0.554
<
0.001
Sub 20
0.163
<
0.001
0.764
<
0.001
Sub 21
0.136
<
0.001
0.466
<
0.001
Sub 22
0.040
<
0.001
0.408
<
0.001
Sub 23
0.114
<
0.001
0.790
<
0.001
Sub 24
0.107
<
0.001
0.706
<
0.001
Sub 25
0.083
<
0.001
0.623
<
0.001
Sub 26
0.111
<
0.001
0.550
<
0.001
Sub 27
0.114
<
0.001
0.733
<
0.001
Sub 28
0.097
<
0.001
0.747
<
0.001
Sub 29
0.069
<
0.001
0.522
<
0.001
Sub 30
0.102
<
0.001
0.629
<
0.001
Sub 31
0.092
<
0.001
0.717
<
0.001
Sub 32
0.110
<
0.001
0.639
<
0.001
Average
0.103
<
0.001
0.637
<
0.001
brain domain [7,8]). Secondly, the variance of the correlation coefficient between stimuli within (and between) subjects has not been explained yet and should be explored in future experiments. Thirdly, other characteristics of the music stimulus (rather the signal spectrogram) need to be examined in the subsequent studies. In addition, it would be interesting to probe whether or not such stimuli can cause significant correlation with physiological responses, such as heart rate.
References
1. Bailey, T.L., Gribskov, M.: Combining evidence using p-values: application to se-quence homology searches. Bioinformatics 14(1), 48–54 (1998)
2. Belin, P., Zatorre, R.J., Lafaille, P., Ahad, P., Pike, B.: Voice-selective areas in human auditory cortex. Nature 403(6767), 309–312 (2000)
3. Carlson, T.A., Hogendoorn, H., Kanai, R., Mesik, J., Turret, J.: High temporal resolution decoding of object position and category. Journal of vision 11(10), 9–9 (2011)
4. Cox, D.D., Savoy, R.L.: Functional magnetic resonance imaging (fmri)”brain read-ing”: detecting and classifying distributed patterns of fmri activity in human visual cortex. Neuroimage 19(2), 261–270 (2003)
5. Fisher, R.A.: Statistical methods for research workers. Quarterly Journal of the Royal Meteorological Society 82(351) (1956)
6. Ghaemmaghami, P., Abadi, M.K., Kia, S.M., Avesani, P., Sebe, N.: Movie genre classification by exploiting meg brain signals. In: ICIAP (2015)
7. Ghaemmaghami, P., Nabi, M., Yan, Y., Sebe, N.: Sparse-coded cross-domain adap-tation from the visual to the brain domain. In: ICPR (2016)
8. Ghaemmaghami, P., Nabi, M., Yan, Y., Sebe, N.: A cross-modal adaptation ap-proach for brain decoding. In: ICASSP (2017)
9. Ghaemmaghami, P., Sebe, N.: Brain and music: Music genre classification using brain signals. In: EUSIPCO (2016)
10. Haxby, J.V., Gobbini, M.I., Furey, M.L., Ishai, A., Schouten, J.L., Pietrini, P.: Dis-tributed and overlapping representations of faces and objects in ventral temporal cortex. Science (2001)
11. Huth, A.G., de Heer, W.A., Griffiths, T.L., Theunissen, F.E., Gallant, J.L.: Nat-ural speech reveals the semantic maps that tile human cerebral cortex. Nature 532(7600), 453–458 (2016)
12. Kay, K.N., Naselaris, T., Prenger, R.J., Gallant, J.L.: Identifying natural images from human brain activity. Nature 452(7185), 352–355 (2008)
13. Kim, J.H., Bießmann, F., Lee, S.W.: Reconstruction of hand movements from eeg signals based on non-linear regression. In: International Winter Workshop on Brain-Computer Interface (BCI) (2014)
14. Koelstra, S., Muhl, C., Soleymani, M., Lee, J.S., Yazdani, A., Ebrahimi, T., Pun, T., Nijholt, A., Patras, I.: Deap: A database for emotion analysis; using physiolog-ical signals. IEEE Transactions on Affective Computing 3(1) (2012)
16. Kuo, P.C., Chen, Y.S., Chen, L.F., Hsieh, J.C.: Decoding and encoding of visual patterns using magnetoencephalographic data represented in manifolds. NeuroIm-age 102, 435–450 (2014)
17. Martin, S., Brunner, P., Holdgraf, C., Heinze, H.J., Crone, N.E., Rieger, J., Schalk, G., Knight, R.T., Pasley, B.N.: Decoding spectrotemporal features of overt and covert speech from the human cortex. Frontiers in neuroengineering 7, 14 (2014) 18. Mitchell, T.M., Hutchinson, R., Niculescu, R.S., Pereira, F., Wang, X., Just, M.,
Newman, S.: Learning to decode cognitive states from brain images. Machine Learning 57(1-2), 145–175 (2004)
19. Miyawaki, Y., Uchida, H., Yamashita, O., Sato, M.a., Morito, Y., Tanabe, H.C., Sadato, N., Kamitani, Y.: Visual image reconstruction from human brain activity using a combination of multiscale local image decoders. Neuron 60(5), 915–929 (2008)
20. Naselaris, T., Olman, C.A., Stansbury, D.E., Ugurbil, K., Gallant, J.L.: A voxel-wise encoding model for early visual areas decodes mental images of remembered scenes. Neuroimage 105, 215–228 (2015)
21. Naselaris, T., Prenger, R.J., Kay, K.N., Oliver, M., Gallant, J.L.: Bayesian re-construction of natural images from human brain activity. Neuron 63(6), 902–915 (2009)
22. Nishimoto, S., Vu, A.T., Naselaris, T., Benjamini, Y., Yu, B., Gallant, J.L.: Recon-structing visual experiences from brain activity evoked by natural movies. Current Biology 21(19), 1641–1646 (2011)
23. Pasley, B.N., David, S.V., Mesgarani, N., Flinker, A., Shamma, S.A., Crone, N.E., Knight, R.T., Chang, E.F.: Reconstructing speech from human auditory cortex. PLoS Biol 10(1), e1001251 (2012)
24. Schoenmakers, S., Barth, M., Heskes, T., van Gerven, M.: Linear reconstruction of perceived images from human brain activity. NeuroImage 83, 951–961 (2013) 25. Stansbury, D.E., Naselaris, T., Gallant, J.L.: Natural scene statistics account for
the representation of scene categories in human visual cortex. Neuron 79(5), 1025– 1034 (2013)
26. Sturm, I., D¨ahne, S., Blankertz, B., Curio, G.: Multi-variate eeg analysis as a novel tool to examine brain responses to naturalistic music stimuli. PloS one 10(10) (2015)
27. Thirion, B., Duchesnay, E., Hubbard, E., Dubois, J., Poline, J.B., Lebihan, D., Dehaene, S.: Inverse retinotopy: Inferring the visual content of images from brain activation patterns. NeuroImage 33(4), 1104 – 1116 (2006), http://www. sciencedirect.com/science/article/pii/S1053811906007373
28. Wang, J., Pohlmeyer, E., Hanna, B., Jiang, Y.G., Sajda, P., Chang, S.F.: Brain state decoding for rapid image retrieval. In: ACM Multimedia (2009)