Zainal A. Hasibuan, PhD ([email protected])
STUDY PROGRAM:
MAGISTER INFORMATION TECHNOLOGY, COMPUTER SCIENCE FACULTY,
Research Methods
(upon which methodologies can be built)
Case Study
Types of
Experimental Group Designs
Three Types
What is Experimental Design?
•
An experimental design:
“Is the tradi?onal approach to conduc?ng
quan?ta?ve research”
Experimental Design
•
Treatment, control, comparison
•
do something to subjects (guinea pigs?)
•
who are randomly selected and randomly assigned to
groups
CharacterisDcs of Experiments
•
Random assignment
•
Control over extraneous variables
•
Manipula?on of the treatment condi?ons
•
Outcome measures
•
Group comparisons
Random Assignment
•
Random assignment
is the process of assigning individuals to
the treatments.
•
The random assignment of individuals to groups (or condi?on
within a group) dis?nguishes a rigorous’
“true”
experiment
Experimental Research
•
Experiment
: The inves?ga?on of the
rela?onship between two or more variables by
deliberately producing a change in one
variable in a situa?on and observing the
effects of that change on other aspect of the
situa?on.
Experimental Research
•
Experimental manipula?on
: Change that an
experimenter deliberately produces in a
situa?on
•
Treatment
: the manipula?on implemented by
experimenter
•
Experimental
group: any group receiving a
Experimental Research
•
In an
observa(onal study
, measurements of variables
of interest are observed and recorded, without
controlling any factor that might influence their
values.
•
An
experiment
, on the other hand, deliberately
imposes some treatment on individuals in order to
observe their responses.
Steps In ConducDng Experimental Research
•
Step 1. Decide if an experiment addresses your research problem
•
Step 2. Form hypotheses to test Cause‐and‐effect Rela?onships
•
Step 3. select an Experimental Unit and Iden?fy Study par?cipants
•
Step 4. Select an Experimental Treatment and Introduce it
•
Step 5. Choose a Type of Experimental design
•
Step 6. Conduct the Experimental
•
Step 7. Organize and Analyze the Data
•
Step 8. Develop an experimental Research Report
Types of Experimental Designs
•
Between‐Group Designs
–
True experiments (pre‐and posaest, posaest only)
–
Quasi‐experiments (pre‐and posaest, posaest only)
–
Factorial Design
•
Within‐Group or Individual Designs
–
Time series experiments (interrupted, equivalent)
–
Repeated measures experiments
Types of Experimental Design
True
Experiment
Quasi
Experiment
Factorial Time Series Repeated
Measures
Single Subject
Random assignment? Yes No May be Used No No No
Number of groups/ individuals compared?
Two or more Two or more Two or more One group One group One individual studied at a time
Number of
interventions used?
One or more interventions
One or more interventions
Two or more interventions
One or more interventions
Two or more interventions
One or more interventions
Number of times the dependent variables measured/observed?
Once Once Once After each intervention
After each intervention
Multiple points
Controls typically used?
Pretest matching, blocking, covariates
Pretest matching, blocking, covariates
Pretest matching, blocking, covariates
Group becomes its own control
Types of Between‐Group Designs
(True Experimental Designs)
Pre-and Posttest Design Time
Random assignment
Control Group
Pretest No Treatment Posttest
Random assignment
Experimental Group
Pretest Experimental
Treatment
Posttest
Posttest-Only Design Time
Random assignment
Control Group No Treatment Posttest
Random assignment
Experimental Group
Experimental Treatment
Types of Between‐Group Designs
(Quasi Experimental Designs)
Pre-and Posttest Design Time
Select Control Group
Pretest No Treatment Posttest
Select Experimental Group
Pretest Experimental
Treatment
Posttest
Posttest-Only Design Time
Select Control Group No Treatment Posttest
Select Experimental Group
Experiment Example
•
New
“instant breakfast” product.
•
To assess its nutri?onal quality, researchers in the lab
feed 30 newly weaned male white rats and measure
their weight gains over a 28‐day period.
•
They randomly select 15 rats and feed them using
the new product.
Design of Experiments
•
Experimental units: individuals on which the experiment is
done, also called subjects when the units are human beings.
– The rats
•
Treatment: the specific experimental condi?on applied to the
units.
– “instant breakfast” diet
•
Factors: the explanatory variables, which ogen have levels.
Principles of Experimental Design
•
Control
–
Researcher decides which subjects areassigned to the
treatment group
•
Randomiza?on
–
Impar?al and objec?ve
•
Replica?on
Experimental Research
• Experimental Research: research that allows for the causes of behaviour
to be determined
• Experiment: a carefully regulated procedure where one or more factors
are deliberately manipulated and all other factors are held constant.
• Cause‐effect rela?onship occurs if:
– The cause is correlated with the effect.
– The cause occurred before the effect.
– We can rule out other plausible explana?ons of the causal rela?onship
Experimental Research: Factors
• Independent Variable (IV): factor that is manipulated
• Dependent Variable (DV): factor that is measured
• Experimental condiDon: subjects that are manipulated
• Control condiDon: subjects that are not manipulated
• Confounding variable: an extraneous variable that should be
controlled, but is not. Can lead to false/spurious conclusions!
• Anecdote:
– Day 1: drink water + beer. Result? Drunk!
– Day 2: drink water + wine. Result? Drunk!
– Day 3: drink water + whiskey. Result? Drunk!
Examples of Experimental
Examples of Experimental Research Design
(Adopted from : Efficient and Effec?ve Keyword Searching in P2P System, Nizar 2007)
• Problem: A variety of peer‐to‐peer (P2P) systems for sharing documents are currently available. The challenging is how to design a rou?ng strategy that leads the user finding the documents needed.
• Research Ques?on: What mechanisms to effec?ve and efficient keyword‐ based searching for documents in unstructured P2P system?
• Purpose: To explore the efficiency and effec?veness of keyword‐based searching of documents in P2P system by proposing reinforcement learning mechanism.
Experimental Research Methodology
(Adopted
from Nizar, 2007)
• Problem analysis
– Comparing several learning algorithm – Choose the algorithm
• Simula?on set up
– Technological sepng
• Running in PC Pen?um 4 – Experimental sepng
• Apply simple keyword‐based rou?ng on……. • Control the searching process
• Run several ?mes • Data Analysis
– Record the amount of ?me used and the number of document relevant – Tabulated the data
• Data Interpreta?on – Based on the chart
Another Example: The Use of Maximal Frequent Sequences to Improve Document Ranking in Informa?on Retrieval System for Indonesian Language
(Dwi Astu?, 2006)
• Background and Problem
– The amount of textual informa?on available through the World Wide Web has increased drama?cally in recent years
– Web users need effec?ve search mechanism in order to find useful informa?on from the enormous quan??es of available text data
Experimental Research Methodology, AstuD
(2006)
•
Data Sets
– The data sets used in this experiment were comprised of 2 Indonesian corpuses, a news corpus and a scien?fic corpus.
– The news corpus is a collec?on of on‐line news from famous Indonesian newspapers, consists of 3000 documents, and is
formaaed in the TREC‐like format. The corpus comes with 20 set of queries and their relevancies [ASI04].
•
Programming Language and Libraries
Experimental Research Methodology, AstuD
(2006)
•
Collec?on Preprocessing
– The reindexed collec?on was then subjected to word filtering to remove punctua?on, one‐leaer words, numbers, word repe??on, and about 250 stop words
– The filtered collec?on then underwent stemming using an Indonesian stemmer [ASI03]
•
Term‐Frequency Processing
• Applying The Process of MFS Discovery
– Pair Discovery
– MFS Discovery
– MFS Indexing
• Evalua?on of Retrieval System
– Boolean Term Frequency Model
– Term Frequency Cosine Model
– MFS Model
– Hybrid (Term Frequency Cosine/MFS) Model
– Evalua(on Strategy
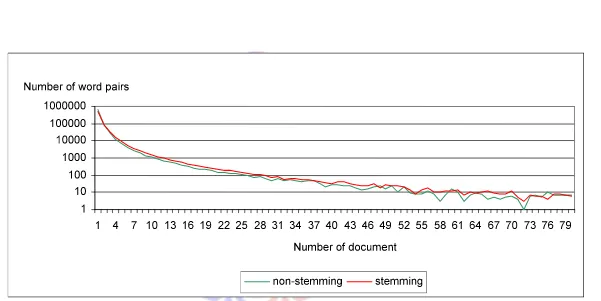
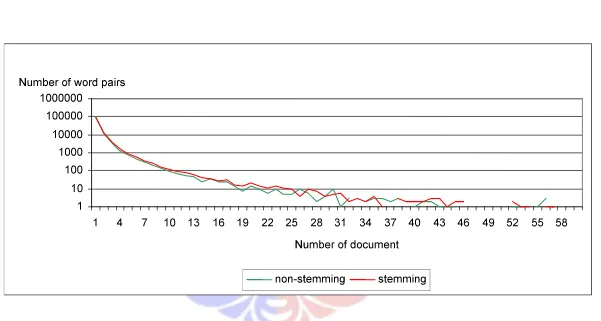
The Experimental Results
• The Process of MFS Discovery
– The results of searching frequent word pairs (2‐grams) between
stemmed and non‐stemmed version of each collec(on (figure 1 and 2).
– The results of MFS discovery for different threshold were shown in
Discussion and InterpretaDon
• The Discovery of MFS
– The process of discovering MFS for each collec(on started with the
search of frequent word pairs (or 2‐gram)
– Using a bigger parameter g results in more pairs being constructed
– The search for frequent pairs proved to be a major challenge for BsdDB
component of the retrieval system
– The discovery of MFS proved to be cpu and memory intensive process
– Smaller threshold spreads the distribu(on of MFS
Discussion and InterpretaDon
•
Evalua?on of Retrieval System
– Term frequency method with Tc (term frequency cosine) scoring
scheme gave a respectable results .
– A modified Tc with correc(on factor (Tc2) improves the precision of
the term frequency cosine model for the scien(fic collec(on .
– More MFS represen(ng document usually improves the precision of
the retrieval algorithm.
Conclusion and SuggesDon
• An improved method for u(lizing MFS in calcula(ng the rank of document
should be formulated
• To be prac(cal in the real‐word applica(on, a new algorithm for doing
Quasi‐Experimental Designs
•
A research design in which an experimental
procedure is applied but all extraneous
CharacterisDcs of Quasi‐Experimental
Research
•
There is a control or comparison group
•
Intact groups are used
Nonequivalent Control Group Design
•
A quasi – experimental design in which the
results obtained from nonequivalent
Quasi‐Experimental Research
Parametric Tests
Sta?s?cal Analysis: The
t
Test
For tes(ng the significance of difference between two sample
means
Basic Assump?ons
1‐
Scores form an interval or ra(o scale
2‐Scores are normally distributed
Quasi‐Experimental (Cont’d)
Analysis of Variance (ANOVA)
Comparison of two or more group means
Mul?variate Analysis of Variance (MANOVA)
Sta(s(cal technique for determining whether groups differ on more than one dependent variable.
Basic Assump?ons
1‐Scores form an interval or ra(o scale
2‐Scores are normally distributed
Quasi‐Experimental (Cont’d)
Nonparametric Tests
Nonparametric sta(s(cs tests sta(s(cal significance that do not rely on
any assump(ons about shape or variance of popula(on scores.
Used with measures that yield categorical or rank scores, or do not have equal intervals. Nonparametric tests are less powerful, they require larger samples to yield the same level sta(s(cal significance.
Quasi‐Experimental (Cont’d)
Nonparametric Tests (Cont’d)
2‐The Mann‐Whitney U test=used to determine whether the distribu(ons of scores of two independent samples differ significantly from each other.
3‐The Wilcox signed rank test=used to determine whether the distribu(ons
of scores of two samples differ significantly from each other when the
Quasi‐Experimental (Cont’d)
Nonparametric Tests (Cont’d)
Quasi‐Experimental Research
•
Quasi‐experimental research
– Almost but not quite real experiments
– No manipula?on of the variables (so no IV)
– Compare groups biased on naturally occuring variables
•
Two types of natural variables
– Subject variable: Characteris?cs that vary between par?cipants, but can not be manipulated
– Time variable: Comparing individuals at different points in ?me (age 3 and 6)
•
One‐shot post‐test, no control group
Diagramming Research
•
To illustrate research designs, a number of symbols are used
–
X
1= Treatment
–
X
2= Control Group
–
O = Observa?on (pretest or posaest)
A Sample Research Design
•
Single‐Group Pretest‐Treatment‐Posaest Design
R O X
1O
This means subjects are
randomly assigned to a
group, which is then given a
pretest, then there is a
X
O1 O2 One-group pretest-posttest design
Group 1:
Nonequivalent control group
O1
X1 X2 O2 Equivalent time-samples design
Research design with more power
(Dme series)
•
Pre‐test post‐test
O
1O
2O
3X O
4O
5O
6•
Pre‐test post‐test with control group
O
1O
2O
3X O
4O
5O
6Changes to Look For
TIME
X
No effect
Change in the rate or slope
Research Designs by SimilariDes
Experimental & Quasi‐experimental
‐Involves Researcher Interven?on
Non‐experimental
‐ Examines phenomena as they exist
DescripDve Research
•
Purpose
– To describe the way things are
– Or “what is”
•
Many of the methods used, can also be used for
correla?onal research
–
Difference is the purpose
• describing v. examining a rela?on
•
Two main types
– Surveys
Basic of DescripDve Research
•
Objec?ve:
Describe market characteris?cs or func?ons
•
Characteris?cs:
– Marked by the prior formula?on of specific hypotheses
– Preplanned and structured design
•
Methods:
Secondary data
– Surveys
– Panels
Causal‐ComparaDve Research
The Purpose
Causal‐ComparaDve Research
Ex Post Facto = Causal‐ComparaDve Research
•
Explores possible causes and effects
•
The independent variable is not manipulated, it has already
been applied
•
Focuses first on the effect, then aaempts to determine what
caused the observed effect.
•
Seeks to explain differences between two groups that have
occurred
CorrelaDonal Designs
The Purpose
To discover rela(onships between variables through the use of
correla(onal sta(s(cs. Involves correla(ng data on two or more variables for each individual in a sample and compu(ng a correla(on coefficient. Two major purposes:
1‐To explore causal rela(onships between variables;
CorrelaDon Research Design
Advantages
1‐Enables researchers to analyze the rela(onships among a large number
of variables in a single study.
2‐They provide informa(on concerning the degree of the rela(onship between the variables being studied.
Parametric Test
Pearson r sta(s(cal procedure
Basic Assump?ons
1‐Scores form an interval or ra(o scale
2‐Scores are normally distributed
3‐Score variances for the popula(ons under study are
Sca^ergrams RepresenDng Different Degrees and DirecDons of
CorrelaDon between Two Variables
Positive correlation (r=.99) Negative correlation (r=-.73)
Experimental Research Design
Experimental Research Design
Design with Threats to Internal Validity
Requirements of Experimental Research Design
Pre-testing Participant
True Research Design
One-Group Posttest-Only
Posttest-Only
One-Group Pretest-Posttest
Nonequivalent Posttest-Only
Choice of Research Design
Pretest-Posttest
Research Question
Control
Between Vs. Within Participants design Between-Participants
Within Participants Mixed Models
Simple Randomized
Factorial