Full Terms & Conditions of access and use can be found at
http://www.tandfonline.com/action/journalInformation?journalCode=cbie20
ISSN: 0007-4918 (Print) 1472-7234 (Online) Journal homepage: http://www.tandfonline.com/loi/cbie20
The Role of Markets, Technology, and Policy in
Generating Palm-Oil Demand in Indonesia
Joanne C. Gaskell
To cite this article: Joanne C. Gaskell (2015) The Role of Markets, Technology, and Policy in Generating Palm-Oil Demand in Indonesia, Bulletin of Indonesian Economic Studies, 51:1, 29-45, DOI: 10.1080/00074918.2015.1016566
To link to this article: http://dx.doi.org/10.1080/00074918.2015.1016566
Published online: 30 Mar 2015.
Submit your article to this journal
Article views: 295
View related articles
ISSN 0007-4918 print/ISSN 1472-7234 online/15/00029-17 © 2015 Indonesia Project ANU http://dx.doi.org/10.1080/00074918.2015.1016566
* The author gratefully acknowledges Walter P. Falcon and Roz Naylor for invaluable dis-cussions, Zahnur Roi’ah for research assistance, the Center for International Forestry Re-search and Stanford University for administrative and inancial support, and two anony-mous reviewers for their feedback on the manuscript.
THE ROLE OF MARKETS, TECHNOLOGY, AND POLICY IN
GENERATING PALM-OIL DEMAND IN INDONESIA
Joanne C. Gaskell*
Stanford University
Indonesia produces more palm oil and consumes more palm oil per capita than any country in the world. This article examines the processes through which Indonesia has promoted palm-oil consumption and some of the consequences of that pro-motion. Partial equilibrium modelling shows that Indonesia’s remarkable increase in palm-oil consumption since 1985 is not largely attributable to population and income growth. Instead, much of this consumption growth has resulted from sub-stitution away from coconut oil, facilitated by government policies on technology, pricing, distribution, and trade. The switch from coconut oil to palm oil in Indone-sia was associated with increased land conversions to agriculture and diminished smallholder competitiveness. Despite lower rates of cooking-oil substitution in the future, simulations suggest that Indonesia’s total palm-oil consumption in 2035 will be at least double that of 2010.
Keywords: consumption, markets, palm oil JEL classiication: L22, N55, Q18
INTRODUCTION
The rate at which oil-palm plantations will continue to spread in Indonesia and elsewhere is a function of supply constraints: land and labour costs, yields, and other factors that affect both the intensive and the extensive margin of produc-tion. But the structure of demand is equally important in determining palm oil’s price and, consequently, the incentives facing producers. This article focuses on the evolution of cooking-oil demand in Indonesia; however, cooking-oil trends in other major palm-oil-consuming countries, such as India and China, also shape the global market. Lessons from Indonesia’s experience can give insights into the drivers of palm-oil consumption growth in these other countries. Ultimately, future palm-oil expansion patterns cannot be understood without a comprehen -sive analysis of the factors that determine demand.
This article comprises two sections. The irst section evaluates the sources of palm-oil demand growth in Indonesia by using a partial equilibrium framework. This approach is insuficient to explain demand trends, so the second section intro -duces the role of Soeharto-era policies in altering cooking-oil preferences. Supple-menting the economic model with an understanding of development projects and programs that promoted palm oil is necessary in order to explain the agricultural development transformation that drove Indonesian consumption dynamics.
A PARTIAL EQUILIBRIUM APPROACH TO DEMAND ANALYSIS: AN EXERCISE IN HINDCASTING
It is impossible to properly estimate a demand equation for palm oil, given the paucity of data on relative domestic cooking-oil prices and given the simultane-ity issues in the data. A quick glance, however, at trends in the basic structural determinants of demand—population, income, urbanisation, and prices—reveals a striking non-linearity in palm-oil consumption dynamics over the past 25 years. Each of these variables (with the exception of the price of palm oil, for which the demand elasticity is assumed to be negative) has increased: between 1985 and 2010, Indonesia’s population grew by 42%; per capita incomes more than doubled in real terms; and the urban population grew at 7.5% per year—faster even than the rate of urbanisation in China (6.3%) or India (4.3%) (World Bank 2010). While Indonesia typiies the trends across Asia in population and income growth, it is an outlier in terms of palm-oil consumption growth. Total Indonesian palm-oil con -sumption grew tenfold between 1985 and 2010, from 500,000 to 5,000,000 tonnes (USDA 2011). No other country has experienced similarly large increases in per capita palm-oil consumption.
The following sections describe the potential contributions of population, income, urbanisation, and prices to higher palm-oil consumption in Indonesia. The second half of the article explains how this increased consumption was the result of historical policies and programs that promoted palm oil over coconut oil in terms of both supply and demand.
Population Effects
T2−T1=P2C2−P1C1=C1
(
P2−P1)
+P1(
C2−C1)
+(
P2−P1)
(
C2−C1)
(1)where T is total consumption; P is population; C is per capita consumption; and the subscript 1 and 2 denote 1985 and 2010, respectively. Thus, the difference in total consumption between 1985 and 2010 is the sum of the following: a term that depends only on population growth, (P
2– P1); a term that depends only on
per capita consumption growth, (C
2 – C1); and a term that depends on the inter
-action between population growth and consumption growth, (P
2 – P1) (C2 – C1).
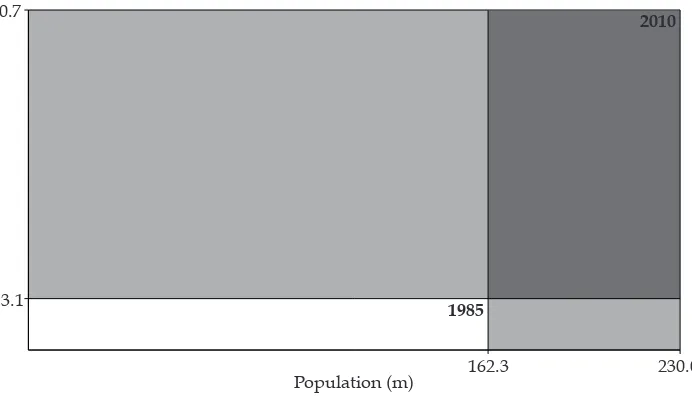
Graphically, the shaded areas in igure 1 show the magnitudes of these three terms. The smaller light-grey rectangle, accounting for 5% of total consump -tion growth, represents consump-tion growth that is uniquely due to popula-tion growth, holding per capita consumption constant at the 1985 level. The dark-grey rectangle, accounting for 28% of total consumption growth, represents the interaction of income growth and higher per capita consumption. The larger light-grey rectangle, accounting for 67% of total consumption growth, represents consumption growth that is separate from population growth. At Indonesia’s 1985 population level, total consumption at 2010’s palm-oil consumption level of 21 kilograms per capita would be 290 million tonnes, rather than the actual igure of 420 million tonnes. Both population growth and per capita consump -tion growth are important to demand, but per capita consump-tion growth has been more important and is also more uncertain when it comes to future trends.
Income Effects
An obvious explanation for a surge in per capita palm-oil consumption in Indo-nesia is income growth: as incomes rise, IndoIndo-nesians have more money to spend on food. Income elasticities of consumption are particularly high when people start out poor, because the poor spend a larger fraction of their incomes on food (Timmer, Falcon, and Pearson 1983; USDA 2010). In 1992, the World Bank (1992) estimated Indonesian vegetable-oil income elasticities within a range of 0.6–0.8. Indonesia’s income elasticity of palm-oil consumption for 2007, estimated across six income classes and using national household survey data, was 0.4 (BPS 2009). This coeficient suggests that Indonesia’s income elasticity of consumption for vegetable oils has fallen over time, as expected.1
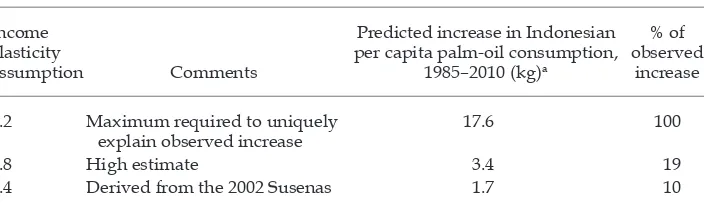
Income growth explains less than a ifth of Indonesia’s higher per capita palm-oil consumption. Despite the country’s strong economic performance— Indonesian real incomes have more than doubled in the past 25 years, from $476 to $1,124 per capita (World Bank 2010)—explaining all of Indonesia’s higher per capita palm-oil consumption based on higher incomes alone would require an improbable income elasticity of 4.2. A high, but more reasonable, income elasticity estimate of 0.8 still explains only 19% of the observed increase in Indonesia’s per capita palm-oil consumption for food (table 1). An income elasticity of 0.4 applied across Indonesia explains a jump in palm-oil consumption of 1.7 kilograms per capita, or about 10% of the observed growth in per capita consumption.
In the future, should Indonesian incomes continue to rise, palm-oil consump-tion for food will level off. Patterns of palm-oil consumpconsump-tion by income class reveal some ‘topping out’ at the highest income levels, particularly among rural consumers (IPOB 2008); however, the overall palm-oil consumption igures in the National Socio-economic Survey (Susenas) do not include palm oil in prepared foods consumed outside the home. Compared with rural consumers, urban con -sumers show less evidence in the Susenas data of reaching a maximum level of consumption. In 2007, the median rural consumer in Indonesia used 0.14 litres of cooking oil per week, 67% of the maximum rural value of 0.21. Thus, as incomes grow, there is signiicant room for expansion towards this suggested ceiling.
Urbanisation Effects
Indonesia’s urban population grew rapidly between 1985 and 2010, faster even than China’s. While China and India saw urban population growth rates of 6.3% per year and 4.4% per year, respectively, Indonesia’s urban population grew by 7.5% (World Bank 2010). The 2002 Susenas shows slightly higher palm-oil con -sumption in urban areas (IPOC 2004, 2006). A paired t-test shows that urban
Indonesians consumed signiicantly more cooking oil, on average, than rural Indonesians in the same income bracket (p = 0.01), holding incomes constant.
However, the mean difference was only 0.01 kilograms per capita per week, or FIGURE 1 Population’s Contribution to Higher Palm-Oil Consumption in Indonesia,
1985–2010
162.3 3.1
20.7
230.0 1985
2010
Population (m) Consumption (kg per capita)
Sources: Data from the USDA (2011) and the World Bank (2010).
Note: The total shaded area represents the increase in palm-oil consumption between 1985 and 2010.
The interior rectangles show the contribution of population growth (the smaller light-grey rectangle); income growth × per capita consumption growth (the dark-grey rectangle); and per capita consump
5% of average consumption.2 The 2007 Susenas revealed no signiicant difference
between rural and urban palm-oil consumption, conditional on income. Thus, there is some evidence for convergence in consumption patterns between rural and urban consumers.3 Urbanisation may contribute to diets that are heavier in
cooking oil, as workers and their families substitute towards fried street food. Whether the difference in palm-oil consumption between urban and rural Indonesians is zero or as large as 20%, the direct impact of urbanisation on palm-oil consumption is small. Assuming that urban Indonesians consume 20% more palm oil than rural Indonesians implies that as urbanisation in Indonesia jumped from 26% to 53% between 1985 and 2010, migration accounted for an increase in consumption of only 0.24 kilograms per capita, on average, out of a total increase of 18 kilograms per capita, holding incomes constant.4 This small effect is not the
‘missing factor’ that explains Indonesia’s extraordinary growth in palm-oil con -sumption.
Own-Price Effects
Combined, demographic factors explain less than a quarter of Indonesia’s growth in palm-oil demand between 1985 and 2010. Lower palm-oil prices are also not a powerful explanatory variable; international palm-oil prices fell by an average of 1.3% per year between 1985 and 2005, or 13% in real terms,5 owing to falling
input costs and higher yields relative to demand growth (Global Financial Data 2011). Domestic cooking-oil prices fell less steeply. In Jakarta, the price per bottle of cooking oil fell at an inlation-adjusted rate of 0.7% per year between 1985
2. The difference in the median income group was 0.03 kilograms per capita per week; with only nine income classes, it is not known whether the data are normally distributed. 3. The urban–rural difference in cooking-oil consumption is likely to be larger than the data suggest, since, as discussed, Susenas does not account for palm oil in prepared foods consumed outside the home.
4. This analysis assumes that migrants consumed the average amount of palm oil in 2010. 5. Adjusted using the World Bank’s Indonesian GDP delator.
TABLE 1 Income Elasticities and Higher per Capita Palm-Oil Consumption,
1985–2010
Income elasticity
assumption Comments
Predicted increase in Indonesian per capita palm-oil consumption,
1985–2010 (kg)a
% of observed
increase
4.2 Maximum required to uniquely explain observed increase
17.6 100
0.8 High estimate 3.4 19
0.4 Derived from the 2002 Susenas 1.7 10
Note: Susenas = National Socio-economic Survey.
and 2005, a more moderate decline that relects government efforts to stabilise cooking-oil prices through export taxes and other price policies (BPS 2006). Both price series are tremendously volatile. In the more recent period between 2005 and 2010, international palm-oil prices went back up, gaining 14% annually in real terms, from $422 per tonne in 2005 to $798 in 2010 (World Bank 2011).6 Some
fraction of this price increase was transmitted to domestic Indonesian cooking-oil prices.
Older estimates put the own-price elasticity of vegetable-oil demand in Indo -nesia at –1.30 to –0.26, with poorer consumers and rural consumers responding the most to price changes (Monteverde 1987). Price elasticities for vegetable oil are probably lower (in absolute value) in Indonesia today than they were in the 1980s because incomes have risen.7 Own-price elasticities for any individual vegetable
oil, including palm oil, are theoretically higher than the own-price elasticity for vegetable oil as a category, since individual vegetable oils substitute easily with one another.
Regardless of whether the own-price elasticity of demand is approximated as –0.3 or –1.3, falling international prices explain less than 10% of Indonesia’s extraordinary growth in per capita palm-oil consumption. And, in fact, prices have not fallen consistently. A price elasticity of –0.3 explains 2% of the observed increase in per capita consumption and a price elasticity of –1.3 explains 9%. Using domestic cooking-oil prices rather than international palm-oil prices for 1985–2005 generates similar results: the overall increase in Indonesian consump-tion during this period was less, but the price changes within Indonesia were also more moderate, owing to government consumption subsidies and trade barriers. Domestic Indonesian cooking oil’s downward price trend explains between 2% and 8% of the growth in per capita palm-oil consumption during this period.
Substitution Effects
The impact of cross-price effects (changes in the prices of substitute commodities) on Indonesian palm-oil consumption is dificult to ascertain, because national price statistics report ‘cooking oil’ prices rather than prices for unique oils such as coconut oil or palm oil. What is clear is that substitution has been the primary cause of higher per capita palm-oil consumption in Indonesia. Palm oil’s ascend-ance in Indonesian diets is equally a story of coconut oil’s decline: in 1965, 98% of Indonesian cooking oil came from coconut, with only 2% coming from palm oil. In 1985, 54% of cooking oil still came from coconut. By 2010, the situation had reversed: 94% of cooking oil came from palm oil, with only 3% coming from coco -nut. The change in 45 years was dramatic.
The sizeable fraction of consumption growth that remains to be explained after accounting for higher incomes, urbanisation, and falling prices can be explained by substitution between coconut oil and palm oil. The impact of substitution on higher per capita palm-oil consumption is approximated by multiplying the change in palm oil’s share of total vegetable-oil consumption by the current level
6. In 2005 dollars.
of vegetable-oil consumption. This calculation gives the difference between the current level of per capita palm-oil consumption and the quantity that would be demanded if Indonesians consumed palm oil and other vegetable oils in the same proportions as they had historically. The shift towards palm oil, away from coconut oil, accounts for an impressive 70% of the observed growth in per capita palm-oil consumption in Indonesia (table 2) and more than half of total demand growth.
What drove this substitution trend? Internationally, the relative prices of coco -nut and palm oil varied considerably during the 1970s and 1980s but did not trend strongly in a single direction, suggesting perhaps a weak role for interna -tional markets in the substitution process. In contrast to peanut oil and soybean oil, which, over time, have become marginally more expensive than palm oil— relative prices grew at 0.2% per year, on average, between 1985 and 2010 (Global Financial Data 2011)— coconut oil has become slightly cheaper than palm oil in international markets. In this period, the international price of coconut oil fell relative to palm oil at an average rate of 0.1% per year. Thus, changes in interna -tional prices do not easily explain Indonesia’s vegetable-oil substitution.
The conversion from coconut oil to palm oil in Indonesian diets—and in Indo-nesian agricultural landscapes—can be explained by a set of political and eco-nomic factors, including local production trends, international trading patterns, innovations in crude palm oil (CPO) processing capacity, and a concerted national policy effort to change dietary preferences and promote palm oil. This dietary conversion went hand in hand with changes in who was farming cooking-oil commodities and which types of land were being used to do so.
POLICY AND TECHNOLOGY: A TALE OF TWO PALMS
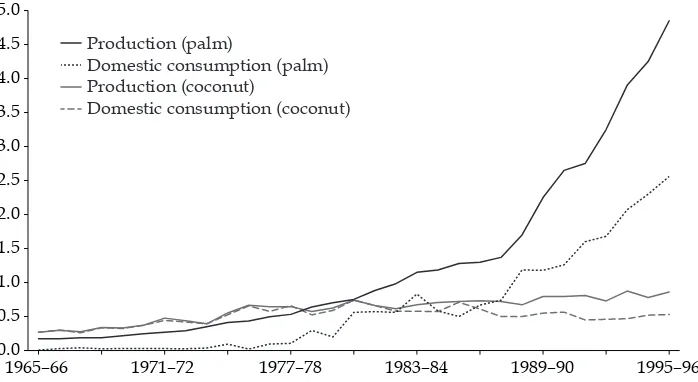
Cooking oil is one of Indonesia’s nine ‘essential’ food commodities of which the government obligates itself to ensure suficient supplies. As a result, government policy controls signiicant aspects of cooking-oil production, marketing, and price formation. Together, policy and market forces transformed Indonesia’s cooking-oil landscape: from the late 1960s through the 1970s, Indonesia exported some palm oil and was essentially self-suficient in coconut oil, increasing its coconut-oil production on par with domestic consumption (igure 2). Indonesians began consuming palm oil in the late 1970s and early 1980s, and demand for palm oil
TABLE 2 Results of a Partial Equilibrium Model Explaining Growth in per Capita
Palm-Oil Consumption in Indonesia, 1985–2010
Variable
Attributed increase in palm-oil consumption (kg per capita)
Substitution 12.4
Income growth 3.4
Urbanisation 1.0
Palm-oil price 0.6
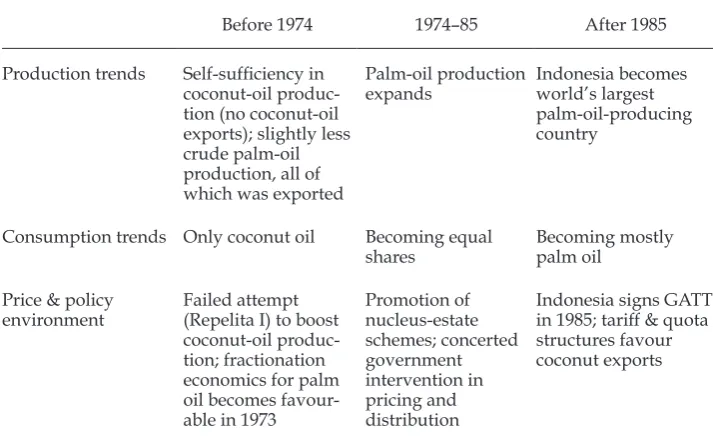
eventually displaced that for coconut oil. By the mid-1980s, Indonesia was export -ing coconut oil to the world. Meanwhile, palm-oil production in Indonesia grew exponentially, accelerating away from coconut-oil production in 1982. Five years later, in 1987, palm-oil consumption accelerated away from coconut-oil consump -tion. Figure 2 details the rise of palm-oil production and consumption, relative to that of coconut oil, over time. Table 3 divides this transition into three distinct phases, summarising the different policies that were active during each phase. Several political and technological developments were crucial in allowing palm oil to outcompete coconut oil as Indonesia’s staple cooking oil.
Early Period: Before 1974
Throughout the 1960s and 1970s, Indonesia produced enough palm oil to meet about 80% of its domestic cooking-oil needs. Most of this production was exported as CPO. The lack of palm-oil processing and imports for domestic consumption during this period is surprising in light of Indonesia’s current appetite for palm oil, and doubly surprising in light of the high price that coconut oil, if exported, would have fetched on the world market.
Indonesia’s vegetable-oil consumption patterns during this period can be explained in part by the organisation of Indonesia’s copra-processing industry. Coconut-oil consumption can take two forms: fresh nuts can be processed on the farm, using minimal technology, to produce klentik oil; or copra (dried coconut meats) can be processed at an industrial facility. Klentik production is less eficient
but was expanded because copra-processing factories on the island of Java enjoyed a monopsony that in effect depressed farm-gate coconut prices. Approximately equal shares of coconut production went to direct local consumption (either as fresh coconut or as klentic oil) and to copra production, with the share of copra
production rising over time (Gwyer and Avontroodt 1974, table 4). The low prices FIGURE 2 The Production and Consumption of Palm Oil and
Coconut Oil in Indonesia, 1965–96 (tonnes, m)
1965–66 1971–72 1977–78 1983–84 1989–90 1995–96 0.0
0.5 1.0 1.5 2.0 2.5 3.0 3.5 4.0 4.5 5.0
Production (palm)
Domestic consumption (palm) Production (coconut)
Domestic consumption (coconut)
offered by copra processors discouraged farmers from selling downstream to export markets and encouraged local processing and consumption.
Coconut production was distributed across Indonesia’s outlying islands on small farms averaging 1.5 hectares in size (Gwyer and Avontroodt 1974). These farms were minimally productive: coconut production rose just enough to keep up with domestic consumption. During Repelita I (1969–74), Indonesia’s irst eco -nomic development plan, Indonesia’s government, with assistance from interna -tional donors, tried to boost coconut production (World Bank 1985). Its attempt failed, for several possible reasons: coconut farmers were remote and therefore hard to reach, new coconut trees that did make it into the ground were often planted in unsuitable terrain, and the project had serious management problems (World Bank 1985).
Despite the remoteness and minimal productivity of many coconut farms, coconut farming remained attractive to farmers because it was lexible in the face of drought or price shocks. Unlike oil-palm fruit, coconuts can be consumed on-farm in response to low market prices. In addition, coconut farmers often multicropped with estate crops that have complementary labour (and sunlight) requirements, such as cocoa, clove, and coffee—a diversiication strategy that minimised risk.
Palm oil, meanwhile, was produced exclusively by large government-owned oil-palm plantations, and was exported rather than consumed domestically. Exported palm oil took the form of CPO rather than reined, edible oil. Indonesia had minimal reining capacity: In 1974, there were four fractionation plants in Indonesia that could separate liquid palm olein (used for cooking oil) from solid palm stearin, possibly two of which were in operation. One factory had a capacity
TABLE 3 Summary of Indonesia’s Vegetable-Oil Transition
Before 1974 1974–85 After 1985
Consumption trends Only coconut oil Becoming equal shares in 1985; tariff & quota structures favour coconut exports
of only 9,000 tonnes of CPO per year. These processing plants faced both manage -ment and economic problems that kept them from being successful. Of the small amount (28,000 tonnes) of palm oil that did not go to export, 15,000 tonnes went to solid baking fats and margarine, while the remainder went to soap (Gwyer and Avontroodt 1974). In 1968, Indonesia’s government nationalised private estates in an attempt to capture a larger share of export earnings. At the time, palm oil made up about 5% of total agricultural export earnings (FAO 2011).
Indonesia’s vegetable-oil system—marginally productive coconut oil for domestic consumption, CPO for export—was destabilised in 1973. At this time, a domestic drought, coupled with a global soybean shortage that sent international coconut prices soaring, caused Indonesia’s domestic cooking-oil price to spike. In an archipelago with porous borders, strict export controls were ineffective at keeping domestic prices low. High domestic cooking-oil prices increased the prof -itability of domestic palm-oil fractionation. Exporting coconut oil while consum -ing palm oil domestically generated greater foreign-exchange sav-ings.
Struggling to ill the domestic consumption gap for cooking oil, keep prices low, and avoid importing coconut oil from the Philippines, Indonesia’s govern -ment looked to palm-oil production. Palm oil was a prominent component of Indonesia’s second planning period (Repelita II), of 1974–79, which focused on agricultural and infrastructure development and on the development of Indone-sia’s outlying islands. Around 35% of the funds for this development program came from foreign international sources, including the World Bank and the Asian Development Bank.
Middle Period: 1974–85
This period saw a transformation in Indonesian diets as palm oil gained accept -ance as a cooking oil—a change from the early 1970s, when Indonesia’s palm-oil exports had been unreined and unsuitable for cooking (palm oil was used domes -tically in some soaps and for a tiny amount of margarine or solid-fat consump-tion). As price increases for coconut oil made palm-oil reining more attractive economically, taste became the salient barrier: Indonesians were not accustomed to eating palm oil. Indonesia’s plantation ministry advocated locally grown palm oil as a substitute for coconut oil (Chaudhuri 1994). Simultaneously, aggressive production policies produced steady palm-oil output growth on new plantations, keeping prices low. In the mid-1980s, a concerted ministry-sponsored effort to market palm-oil, coupled with favourable economics, eventually brought domes -tic palm-oil consumption on par with coconut-oil consumption while retaining Indonesia’s role as a signiicant palm-oil exporter.
As domestic demand for coconut oil grew in the 1970s, the government looked to palm oil as a substitute in order to keep cooking-oil prices low. Other vegetable-oil candidates were not as promising: palm-kernel vegetable-oil shares more properties with coconut oil than palm oil does, but the production quantities of palm-kernel oil are smaller than those of palm oil, which is cheaper to produce. Peanut oil, which already supplied a small amount of cooking oil (unlike palm oil in the 1970s), had similar problems of scale. Rice-bran oil struggled not only with scale but also with rancidity and transport challenges.
colour, fractionation, and reining. At irst, manufacturers blended palm oil with coconut oil, or lavoured the palm oil to make it more palatable (Piggott et al. 2010). Palm oil had to be reined from red to pale yellow and deodorised, to make it less different from coconut oil. Fractionation was also critical: without frac -tionation, palm oil’s semi-solid nature could remind consumers of pork fat—not an attractive quality in a predominantly Muslim society. Reining was relatively expensive; nevertheless, both private and state-owned factories received new investments. By 1981, Indonesia had approximately 1 million tonnes of fractiona-tion capacity, of which half was used (World Bank 1985). Even after palm oil had been reined and deodorised, its yellow colour stood out. A government-funded marketing campaign originated the name kencana, Javanese for ‘golden,’ to make
palm oil seem more familiar and therefore more appealing to consumers. In addi-tion, palm-based cooking oil was marketed to industrial krupuk (cassava chips)
manufacturers that were more sensitive to price and less sensitive to appearances. Palm oil’s frying properties proved to be tremendous in this regard, and palm oil came to be considered of higher quality than locally distributed coconut oil.
By 1981, Indonesia’s 1.1-million-tonne domestic cooking-oil market comprised coconut oil (50%), palm oil (39%), and palm-kernel oil (11%). Some analysts at the time believed that coconut oil’s market share could not decline further, owing to the high demand for fresh coconuts and the high lauric-acid content of coconut oil, which, analysts believed, was necessary for cooking (World Bank 1985). In fact, the cross-elasticity between coconut oil and palm oil appeared to stay high with increasing substitution, defying expectations.
During Repelita III (1979–84), Indonesia undertook large and sustained invest -ments in tree crops, planting approximately 178,000 new hectares of coconut and 121,000 new hectares of oil palm, again with World Bank assistance (World Bank 1985). Overall agricultural investment was large, sustained, dominated by for -eign capital, and focused on tree crops more than food crops (World Bank 1992). Palm-oil production lourished during this period, while coconut-oil production stagnated. Possibly, the absence of good cash-crop alternatives to oil palm kept smallholders producing oil-palm fruit, even at a relatively low farm-gate price. In contrast, coconut producers had cocoa, coffee, and the option of home consump-tion. Overall, the marginal production costs of large oil-palm estates were lower than the marginal production costs of smallholder coconut farms.
Coconut-oil production did not beneit from a similar organisational transfor -mation. Local smallholders, who undertook only minimal new plantings, con -tinued to dominate production, accounting for 98% of the planted area in 1982 (World Bank 1989). Between 1980 and 1985, the average age of coconut trees increased and production remained stable. In contrast to oil palm, there were few new coconut farms or new transmigrant farmers. Coconut production saw some beneit from higher-yielding hybrid seeds, starting in 1979 (Piggott et al. 2010), but overall coconut production beneited less than oil palm from government support and continued to operate at a higher cost.
As a whole, palm-oil exports nearly doubled through the late 1970s, to 400,000 tonnes, before the government intervened and applied different export restraints, from taxes to bans (World Bank 1985), in an effort to lower domestic prices and ensure the domestic availability of cooking oil (a staple). During this period, pro -cessors generally received monthly allocations of CPO to purchase from produc -ers, who were required to sell at a ixed price. Then, palm oil was distributed through a system of exclusive (and proitable) distribution rights. Locally power -ful distribution monopolies with special privileges from the government further established palm oil as the dominant cooking oil (Peter Timmer, pers. comm.).
In 1978, the irst year that the government regulated edible-oil exports, 36% of total palm-oil production was explicitly allocated to the domestic market and the rest could be exported (World Bank 1985). The following year, in 1979, gov -ernment policy allocated 60% of palm-oil production to domestic use at below-market prices (Piggott et al. 2010). By 1981, government requirements forced almost all palm oil onto the domestic market. Exports of crude and reined palm oil remained restricted in 1983 to prevent price increases (Piggott et al. 2010). In 1984, Indonesia suffered $369 million in forgone export earnings owing to restric -tions on palm-oil exports (World Bank 1992). These export restric-tions represented a large implicit subsidy to domestic reiners at the expense of mostly state-owned plantations and at the expense of smallholder farmers who produced the oil-palm fruit.
Efforts to lower coconut-oil prices depressed local production but failed to keep prices low for consumers. In 1976, Bulog, the national logistics agency, imported copra and sold it at a loss to decrease domestic prices (Piggott et al. 2010). A short -fall of this approach was that coconut processors (the majority of whom, by vol -ume, were located on Java) had substantial market power. Copra sold for $140 at the farm-gate price, compared with a $298 copra-equivalent price for cooking oil (World Bank 1985). Farm-gate taxes on copra served to further discourage coco -nut production.
Current Period: 1985–Present
Between 1985 and 2010, palm oil came to dominate Indonesian vegetable-oil pro -duction and consumption. In recent years, government interventions in cooking-oil markets have been fewer, yet palm cooking-oil remains the chosen cooking cooking-oil for Indonesian consumers.
massive depreciation of the rupiah against the US dollar in late 1997 triggered explosive increases in the prices of cooking oil and other basic commodities. In response, between November 1997 and March 1998 the government tried and discarded several policies in quick succession: an informal quota; selective export quotas; tariff-rate quotas based on domestic sales; a three-month ban on palm oil and olein; a broader temporary ban including CPO, stearin, and palm-kernel oil; and then an indeinite ban on CPO. These policies were variously plagued by smuggling, ineficiencies, reduced foreign-exchange earnings, and allegations of unfairness. Export taxes for coconut oil were introduced to thwart smugglers who were circumventing the palm-oil export ban by disguising palm oil as coco -nut oil (Marks, Larson, and Pomeroy 1998). Finally, as part of an agreement with the IMF, the government decided to remove export bans and rely instead on taxes not to exceed 20%. Initially, the ban was replaced by high export taxes, but these taxes were reduced over the course of the year, as the rupiah strengthened. Export taxes for CPO in May 2014 were 12%, with increasing pressure to lower tax rates to incentivise value added and to keep Indonesia’s products globally competitive.
Indonesia’s domestic processing capacity grew, although it remained highly concentrated. In 1989, a single conglomerate controlled 45% of the licensed capac -ity for fractionation and reining (World Bank 1989). Malaysia had subsidised palm-oil reineries as part of its industrial strategy, stunting Indonesia’s domestic capabilities. Indonesia had only a few processing factories in 1974, even fewer of which were in operation. By 1981, Indonesia’s CPO-processing capacity had grown to 1 million tonnes; by 1997, it was 2.4 million tonnes; by 2006, it had risen to more than 29 million tonnes (Gwyer and Avontroodt 1974; IPOB 2008; World Bank 1985).8
Despite unfavourable export policies during this period, palm-oil production surged. The oil-palm plantings starting in 1984 as part of Repelita IV were ‘the most ambitious ever attempted for these crops in the world’ (World Bank 1985). At the end of the campaign, Indonesia boasted 18% of world production of 5.5 million tonnes, with a low age distribution of trees (World Bank 1992). As the trees matured, yields increased. Including smallholders, however, remained challeng -ing. Private estates that replaced state-owned plantation companies in the trans -migration program had even less interest in smallholder welfare. Recent evidence suggests that contract farming on nucleus-estate schemes is dominated by house-holds with large asset endowments and is unlikely to beneit poor smallholders (Cahyadi 2013).
The dramatic change in the composition of domestic vegetable-oil production and consumption that took hold in the 1980s persists today. Substitution towards palm oil has even reached Indonesia’s outlying islands, where home-produced
klentic oil used to dominate. In the Ujung Padang district of Makassar, in South
Sulawesi, palm oil’s market share went from zero in 1986 to 60% in 1996. In the 1970s, the district had approximately twenty factories making coconut oil from fresh coconuts or copra; in 1996 there were only six factories, of which three
produced reined cooking oil and three produced crude coconut oil. Coconut cooking-oil factories on Indonesia’s outlying islands, as on Java, struggled to improve quality and keep prices competitive as the world prices for their raw materials (coconuts, copra, and crude coconut oil) increased and as palm export taxes kept domestic palm-oil prices low.
Future Consumption Growth
That so much of Indonesia’s historical palm-oil consumption growth has come from substitution away from other oils suggests that Indonesia’s future palm-oil consumption will grow more slowly. Over 90% of Indonesian vegetable oil used for food now comes from palm oil, leaving very little coconut oil (or other oil) to be replaced in Indonesian diets. Any increases in palm-oil consumption will come from higher overall vegetable-oil consumption, rather than substitution. Substi-tution among vegetable oils accounted for half of Indonesia’s growth in palm-oil consumption between 1985 and 2010. In the future, palm-oil consumption growth will therefore be less than half as large, given the lack of further substitution pos -sibilities, declining consumption elasticities for vegetable oil, and lower rates of population and income growth.
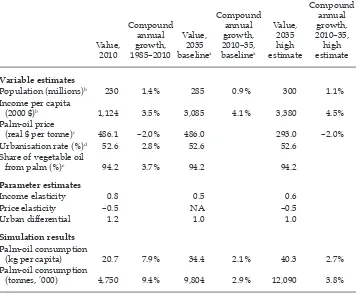
As population growth slows, as income growth slows, and as the income elas -ticity of palm-oil consumption falls, overall vegetable-oil consumption will grow more slowly. Lower vegetable-oil consumption growth implies lower palm-oil consumption growth. Table 4 shows annualised rates of palm-oil consumption growth between 1985 and 2010, along with simulated growth rates between 2010 and 2035 under both a baseline and a high-growth scenario. In the baseline model, Indonesian palm-oil consumption, which grew 9.4% per year, on average, over the past 25 years, is likely to grow by 2.9% per year between 2010 and 2035. This estimate assumes constant prices, no urbanisation effect, constant vegetable-oil shares (that is, no further substitution towards palm oil), and population and income growth predictions in line with USDA (2010) estimates. The high-growth model simulates higher income growth (4.5% per year), higher population growth (1.1% per year), and falling real palm-oil prices (–2.0% per year). Under this sce -nario, palm-oil consumption will grow at 3.8% per year, a stronger growth rate than under the baseline model but still far from the 9.4% annual growth rate that Indonesia experienced between 1985 and 2010.
Even at rates of growth slower than those of the past 25 years, Indonesia’s total palm-oil consumption in 2035 will be at least double that of 2010. Some of this increased consumption will be met through yield increases—for example, by replacing existing oil-palm trees with higher-yielding clones as plantations are replanted (typically every 25 years). Still, a doubling of palm-oil demand over 25 years suggests that pressure to convert currently forested land into palm-oil production will continue to be substantial throughout Indonesia.
demand for palm oil. In addition, non-food uses for palm oil have the potential to upend the current structure of oil markets. The potential demand for palm-based biodiesel, at a favourable price, is practically ininite: palm-based biofuels, in cases in which diesel prices or government mandates provide adequate produc -tion incentives, would lead to a different qualitative conclusion about the future of palm-oil demand. Palm oil has demonstrated its viability relative to coconut oil over the past 25 years; in the next 25 years, will palm oil prove to be more viable than crude oil? Whereas food consumption policies have been critical to palm-oil markets in the past, energy policies may deine palm-oil demand—and patterns of agricultural development—in the future.
TABLE 4 Historical and Predicted Palm-Oil Consumption
Value,
Population (millions)b 230 1.4% 285 0.9% 300 1.1%
Income per capita
(2000 $)b 1,124 3.5% 3,085 4.1% 3,380 4.5%
Palm-oil price
(real $ per tonne)c 486.1 –2.0% 486.0 293.0 –2.0%
Urbanisation rate (%)d 52.6 2.8% 52.6 52.6
Share of vegetable oil
from palm (%)e 94.2 3.7% 94.2 94.2
Note: NA = not applicable.
a Baseline projection assumes constant prices, no urban consumption differential, no substitution
between oils, and an income elasticity of 0.5.
b Population and income growth estimates are informed by data from the USDA (2014).
c Data from Global Financial Data (2011).
d Data from the World Bank (2010).
CONCLUSION
Indonesia’s conversion from coconut oil to palm oil—in both diets and produc-tion emphasis—has had far-reaching consequences. During the 1970s and 1980s, smallholders produced the majority of coconuts, whereas oil palm grew on large plantations with much higher yields per hectare. The displacement of coconut oil by palm oil in Indonesian diets and in Indonesian agricultural landscapes has boosted agricultural productivity. Indonesia is now the world’s largest palm-oil-producing country, with oil-palm companies contributing approximately $3 to Indonesia’s economy for every $1 of proit (Hunt 2010). Indonesia’s ongoing chal -lenge is to balance economic growth and eficiency with agricultural policies that beneit smallholders and the poor. As the palm-oil industry grows and globalises, other countries can learn from Indonesia’s experience of how to harness the nutri -tional and economic beneits of this industry while minimising the social costs.
REFERENCES
Booth, Anne. 1988. Agricultural Development in Indonesia. Sydney: Allen & Unwin.
BPS (Badan Pusat Statistik). 2006. Statistik Indonesia: Statistical Yearbook of Indonesia 2005/ 2006. Jakarta: BPS.
———. 2009. Survei Sosial Ekonomi Nasional: Pengeluaran untuk konsumsi penduduk Indonesia per provinsi [National Socio-economic Survey: Expenditure for consumption of Indone-sia by province]. Jakarta: BPS.
Cahyadi, Eko Ruddy. 2013. ‘Contract Farming and Risks for Smallholders in the Oil-Palm Industry in Indonesia’. PhD diss. abstract. Bulletin of Indonesian Economic Studies 49 (3): 381–82.
Carlson, Kimberly M., Lisa M. Curran, Dessy Ratnasari, Alice M. Pittman, Britaldo S. Soares-Filho, Gregory P. Asner, Simon N. Trigg, David A. Gaveau, Deborah Lawrence, and Hermann O. Rodrigues. 2012. ‘Committed Carbon Emissions, Deforestation, and Community Land Conversion from Oil Palm Plantation Expansion in West Kalim-antan, Indonesia’. Proceedings of the National Academy of Sciences of the United States of America 109 (19): 7559–64.
Chaudhuri, Arjun. 1994. ‘The Diffusion of an Innovation in Indonesia’. Journal of Product & Brand Management 3 (3): 19–26.
FAO (Food and Agriculture Organization of the United Nations). 2011. TradeSTAT Database. Accessed 9 September. http://faostat.fao.org/site/535/DesktopDefault. aspx?PageID=535#ancor.
Global Financial Data. 2011. CMPALMM data series. Accessed 9 September. https://www. globalinancialdata.com.gsbproxy.stanford.edu/platform/dataexportform.aspx. Gwyer, G. D., and P. J. Avontroodt. 1974. ‘Edible Oils: Supply and Demand Prospects’.
Bul-letin of Indonesian Economic Studies 10 (3): 72–107.
Hunt, Colin. 2010. ‘The Costs of Reducing Deforestation in Indonesia’. Bulletin of Indonesian Economic Studies 46 (2): 187–92.
IPOB (Indonesian Palm Oil Board). 2008. Indonesian Palm Oil Statistics 2007. Jakarta: BPS and IPOB.
IPOC (Indonesian Palm Oil Commission). 2004. Indonesian Palm Oil Statistics 1997–2003. Jakarta: IPOC.
———. 2006. Indonesian Palm Oil Statistics 2005. Jakarta: IPOC.
Monteverde, Richard Thomas. 1987. Food Consumption in Indonesia. Cambridge, MA: Har-vard University.
Piggott, R. R., K. A. Parton, E. M. Treadgold, and B. Hutabarat. 2010. Food Price Policy in Indonesia. Canberra: Australian Centre for International Agricultural Research.
Timmer, C. Peter, Steven Block, and David Dawe. 2010. ‘Long-Run Dynamics of Rice Con-sumption, 1960–2050’. In Rice in the Global Economy: Strategic Research and Policy Issues for Food Security, edited by Sushil Pandey, Derek Byerlee, David Dawe, Achim Dober-mann, Samarendu Mohanty, Scott Rozelle, and Bill Hardy, 139–74. Los Baños: Interna-tional Rice Research Institute.
Timmer, C. Peter, Walter P. Falcon, and Scott R. Pearson. 1983. Food Policy Analysis. Balti-more, MD:Johns Hopkins University Press.
USDA (United States Department of Agriculture). 2011. ‘Production, Supply and Distribu-tion Tables’. Accessed 9 September. http://www.fas.usda.gov/psdonline/psdQuery. aspx.
———. 2014. ‘Table 7. Food Expenditures by Families and Individuals as a Share of Dis-posable Personal Income’. Last modiied 1 December. http://www.ers.usda.gov/data-products/food-expenditures.aspx.
Wilcove, David S., and Lian Pin Koh. 2010. ‘Addressing the Threats to Biodiversity from Oil-Palm Agriculture’. Biodiversity and Conservation 19 (4): 999–1007.
World Bank. 1985. Indonesia. The Major Tree Crops: A Sector Review; A Study of the Prospects for Rubber, Oil, Palm, and Coconuts during Repelita IV (1984–88). Washington, DC: World Bank.
———. 1989. Indonesia: Strategies for Sustained Development of Tree Crops. Washington, DC: World Bank Agriculture Operations Division.
———. 1992. Indonesia: Agricultural Transformation Challenges and Opportunities.
Washing-ton, DC: World Bank Agriculture Operations Division.
———. 2010. World DataBank (World Development Indicators and Global Financial Devel-opment databases). Accessed 15 April. http://databank.worldbank.org.
———. 2011. World Bank Commodity Price Data (The Pink Sheet). Accessed 9 September.
http://go.worldbank.org/4ROCCIEQ50.
World Bank and IFC (International Finance Corporation). 2011. The World Bank Group Framework and IFC Strategy for Engagement in the Palm Oil Sector. Washington, DC: IFC. World Growth. 2011. The Economic Beneit of Palm Oil to Indonesia. Arlington, VA: World