Full Terms & Conditions of access and use can be found at
http://www.tandfonline.com/action/journalInformation?journalCode=vjeb20
Download by: [Universitas Maritim Raja Ali Haji] Date: 11 January 2016, At: 19:08
Journal of Education for Business
ISSN: 0883-2323 (Print) 1940-3356 (Online) Journal homepage: http://www.tandfonline.com/loi/vjeb20
The Glass Door Remains Closed: Another Look
at Gender Inequality in Undergraduate Business
Schools
Laura Marini Davis & Victoria Geyfman
To cite this article: Laura Marini Davis & Victoria Geyfman (2015) The Glass Door Remains Closed: Another Look at Gender Inequality in Undergraduate Business Schools, Journal of Education for Business, 90:2, 81-88, DOI: 10.1080/08832323.2014.980715
To link to this article: http://dx.doi.org/10.1080/08832323.2014.980715
Published online: 12 Dec 2014.
Submit your article to this journal
Article views: 162
View related articles
The Glass Door Remains Closed: Another Look
at Gender Inequality in Undergraduate Business
Schools
Laura Marini Davis and Victoria Geyfman
Bloomsburg University of Pennsylvania, Bloomsburg, Pennsylvania, USA
The authors investigated women’s underrepresentation in undergraduate business schools by analyzing a broad sample of Association to Advance Collegiate Schools of Business (AACSB)–accredited U.S. business programs between 2003 and 2011. They found that while there was an increase in the number of male students enrolled in the AACSB-accredited colleges, women’s representation declined from 44.7% in 2003 to 41.1% in 2011. By using a variety of variables that describe school access, educational environment, and women’s experience, the authors found that (a) economic incentives play a role in female students’ decision to enroll; (b) female student representation is lower at larger institutions; and (c) women-friendly institutional factors have a positive effect on women’s representation at undergraduate business schools. The authors examine the implications of the decline of women’s enrollment on business schools, industry, and the economy, and make recommendations on how to address this trend.
Keywords: female enrollment, gender gap in business programs, women in business
The Kanizsa Triangle1is an optical illusion in which a tri-angle is perceived even though it is not actually there. Psy-chologists use this illusion to describe a cognitive process where individuals tend to ignore gaps and perceive the con-tour lines to make the image appear as a cohesive whole (Bridger, 2010). It may be that the overall increase in wom-en’s enrollment in colleges gives the illusion that under-graduate business schools (UBS) are enrolling more women, as well. According to the National Center for Edu-cation Statistics, in the last two decades there has been an observed increase in enrollment of a traditional college-age population (18–24-year-olds) from 32% in 1990 to 41.2% (National Center for Education Statistics [NCES], 2012). Male enrollment within this age group increased from 32.3% to 38.3% (NCES, 2012). During the same time, the growth of women’s enrollment within this age category was much more pronounced, from 31.8% in 1990 to 44.1% in 2010 (NCES, 2012). In terms of gender representation, women accounted for 57% of enrolled college students in
2010 compared to 54% in 1990 and 51% in 1980 (NCES, 2012). However, as we celebrate the gains of women’s representation in higher education, the phenomenon of the shrinking enrollment of female students in UBS has gone largely unnoticed.
While researchers have long studied the determining factors, economic consequences of and gender differences in choice of majors, there is scant scholarship addressing gender enrollment trends in UBS. In 2012, we reported on trends in women’s enrollment and faculty representation at their own UBS at a public university between 1995 and 2008 (Davis & Geyfman, 2012). The study found that while the total women’s enrollment at their university was trend-ing up, the enrollment of female students in the business program declined. Furthermore, the decline in women’s representation (measured by a percentage of female stu-dents to total enrollment) at their UBS mirrored the trend at other sampled public universities in the state (Davis & Geyfman, 2012). These findings were surprising in light of the reported increase in women’s representation among col-lege students in the United States. The current study takes a broader and updated look at women’s representation in UBS by examining U.S. schools accredited by the
Correspondence should be addressed to Victoria Geyfman, Blooms-burg University of Pennsylvania, Department of Finance, 400 E. Second Street, Bloomsburg, PA 17815, USA. E-mail: [email protected] ISSN: 0883-2323 print / 1940-3356 online
DOI: 10.1080/08832323.2014.980715
Association to Advance Collegiate Schools of Business (AACSB)2to see if the state trends extend nationally, and are present in more recent periods—through 2011.
LITERATURE REVIEW AND IMPLICATIONS OF WOMEN’S GENDER GAP IN BUSINESS
Researchers have conducted numerous studies in the last three decades on the factors that influence a student’s choice of major. In 1982, Cebula and Lopes found that the most important factor for students of various disciplines at a large public Midwestern university was future earnings. Later work confirmed these findings (Montmarquette, Can-nings, & Mahseredjian, 2002). Other studies have focused on gender gaps in undergraduate majors and found that a panoply of forces influence choice of study, including dif-ferences in predif-ferences, labor market expectations, and aca-demic preparation (Turner & Bowen, 1999). Researchers have also looked at socioeconomic status as a factor influ-encing major choice and found that students with lower family incomes choose more lucrative fields (Davies & Guppy, 1997), but that family income has different influen-ces on men and women (Leppel, Williams, & Waldauer, 2001).
Additional research has studied the factors that influence how business students choose their concentration and found that, regardless of gender, they were most strongly influ-enced by their interest in the subject (Mauldin, Crain, & Mounce, 2000; Pritchard, Potter, & Saccucci, 2004). The second most important factor for women was their aptitude in the subject, while men next considered career opportuni-ties and income potential (Malgwi, Howe, & Burnaby, 2005).
Our approach in this article is motivated by previous research but is unique in some ways. First, rather than focusing on the individual factors that influence a student’s choice of major (e.g., business vs. humanities and arts), we look at the business major itself and examine the decline in the number of women choosing to enter UBS. Second, we discuss the implications of this trend on schools themselves, the industry, and the nation. Finally, we explore the hypoth-eses that may begin to explain the trend and thus allow UBS administration to understand what factors may help attract female students, what measures may be implemented in order to improve women’s experience and help reverse the decline in women’s representation in UBS.
Implications
Although few studies have examined gender trends in UBS, the implications of the decline in women’s representation are potentially significant. Ball (2012) reported that busi-ness enrollments are becoming a smaller proportion of all college degrees, and that a substantial reason for this
decline is that women are less likely to choose business as a major. The study also noted that women are driving the overall college enrollments trends. These factors combined predict a dim, if not dire, future for the growth of UBS. A more immediate concern for UBS is the lack of female stu-dents in the classrooms. Not only are male-dominated class-rooms deprived of the perspectives that women bring to the discussion, the women in attendance may be subject to a chilly climate (Hall & Sandler, 1982, 1984). The term refers to a cluster of kinds of systematic discrimination that disadvantage women in an academic environment. Exam-ples of such behavior can include sexist use of language, presentation of stereotypic views of women, and instructors favoring male students (Crombie, Pyke, Silverthorn, Jones, & Piccinin 2003). Such behavior may dissuade women from pursuing business classes, and perpetuate the problem of sexism that has long plagued the corporate world.
We can assume that UBS would want to understand and address gender trends for their own reasons—commitments to equity and compliance with their own vision and mis-sions, which often reflect aspirations to be inclusive and diverse. However, external pressures to address the issue also exist. A threshold criterion for accreditation by the AASCB is evidence of compliance with the AACSB’s guiding principles. Included in these principles is that “Diversity in people and ideas enhances the educational experience in every management education program,” and that “diversity is a. . .concept rooted in. . .ethnicity, gender [emphasis added], socioeconomic conditions, and experi-ences” (AACSB, 2013a, p. 6).
Another external pressure that should encourage UBS to monitor gender enrollment is Title IX of the Education Amendments of 1972, which prohibits discrimination based on sex (gender) in federally assisted education programs. Commonly known for creating opportunities for women and girls in athletics, Title IX’s nondiscrimination protec-tions are broad, including student recruitment, admissions, and educational programs. Unlike equity in math, science, and technology education, Title IX does not expressly address equity in business education. However, courts and regulatory agencies have emphasized the breadth of Title IX’s antidiscrimination provisions, making it the focus of increasingly complex compliance efforts across campuses and across program areas.
There are also significant implication for industry. In a competitive marketplace, attracting, retaining, and utilizing people with the required skills and aptitude to meet busi-ness needs are primary drivers for organizational success (SHRM Research, 2006). Consequently, the continued trend of women, or any demographic, choosing undergradu-ate majors other than business deprives industry of needed talent. In gender specific terms, the business case for women in management contends that companies that achieve diversity and manage it well attain better financial results, on average, than other companies (Catalyst, 2013).
82 L M. DAVIS AND V. GEYFMAN
In addition, companies with the most women board direc-tors outperformed those with the least on returns to share-holders (Catalyst, 2007).3
On a national level, recent legislation mandates that gov-ernmental agencies who oversee the financial sector moni-tor the hiring of women (and members of minority groups) by the entities they regulate. Based on the belief that greater diversity promotes stronger, more effective, and more inno-vative business, the Dodd-Frank Wall Street Reform and Consumer Protection Act (the Act; 2010) called for the establishment of an Office of Minority and Women Inclu-sion (Office) in numerous federal agencies. The Act requires each Office within its respective agencies to develop standards and procedures to ensure, to the maxi-mum extent possible, the fair inclusion and utilization of women and minorities, in all business and activities of the agency. A diminished pipeline of women to fill positions in the financial sector will thwart this legislative goal.
On a macroeconomic level, women’s choice of major will have a profound effect on the financial health of fami-lies. Research demonstrates how sex differences in choice of major are a key factor in perpetuating the persistent gen-der wage gap (for an extensive literature review, see Ma, 2009). Because business-related occupations tend to com-mand a higher compensation, a woman’s decision not to pursue careers in the field may reduce the financial resour-ces available to a large swath of the economy. In a recent study by the Pew Research Center (2013) it was reported that a record 40% of all households with children under 18 years old are headed by mothers who are either the sole or primary source of income for the family.
TRENDS OF WOMEN’S ENROLLMENT AT UBS: AACSB DATA
Here we used an extensive database from AACSB based on the Business School Questionnaire (BSQ) collected on an annual basis (AACSB, 2013b). Although by focusing on AACSB data we are not capturing the trends at nonaccred-ited business programs, the AACSB’s high standards and attention to aligning programs’ mission and strategies should reflect best business practices, including those per-taining to gender representation.
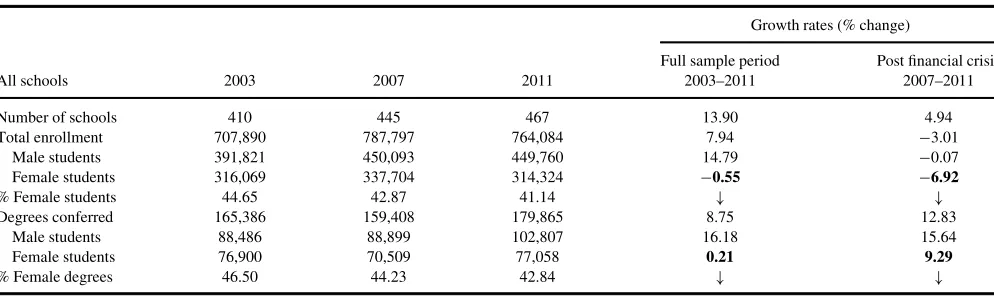
Using the AACSB Datadirect (AACSB, 2013b), we cre-ated a database that included all AACSB-accredited mem-bers in the United States and their information for undergraduate enrollment, faculty participation, school admission, and non-confidential financial characteristics.4 Table 1 presents summary data for the enrollment and degree attainment variables between the 2003–2004 and 2011–2012 academic years. The AACSB BSQ reports pro-vide information dating back to 2001; however, some perti-nent variables to this study were not collected until 2003. For growth rate comparisons, we examined the entire
sample from 2003 through 2011 and compared it to a sub-sample between 2007 and 2011 to account for possible effects of the recent financial crisis on business school enrollment.
According to Table 1, the total enrollment at AACSB-accredited institutions in the United States increased from 707,890 to 764,084, or almost 8%, during the entire sample period, notwithstanding a 3% decline in enrollment between 2007 and 2011, which may be the effect of the global economic crisis. The number of male students enrolled increased by roughly 15% between 2003 and 2011, but the number of female students fell slightly, by 0.55%. The decline was more pronounced in the later part of the sample period. Female student representation in UBS (measured by the percentage of female students enrolled in business programs) is the variable of interest in this study. Table 1 shows that women’s representation at AACSB-accredited member institutions in the United States declined from 44.7% in 2003 to 41.1% in 2011.
In addition to enrollment, we also use degree attainment to examine education trends. Our AACSB data on degree attainment show that while the total number of bachelor’s business degrees awarded rose by almost 9% during the 2003–2011 period and the number of degrees earned by male students rose by 16%, the number of degrees awarded to female students remained virtually unchanged during the entire sample period, rising a mere 0.21% (Table 1). Fur-thermore, female student representation among college of business graduates declined from 46.5% in 2003 to 42.8% in 2011.5 This is consistent with results found in Ball (2012) that show that although some business subdisci-plines are becoming more women dominated, the size of these subdisciplines as a percentage of all business pro-grams is decreasing; thus, the total women’s representation is falling. In sum, women’s representation in UBS mea-sured by either enrollment or degrees awarded has declined in the last decade—remarkable findings in light of a nation-ally reported reversal in gender gap.
ANALYTICAL APPROACH AND RESULTS
The empirical analysis of a choice of business programs for female students using AACSB dataset is similar to that undertaken by studies that test general college choice mod-els, which typically include variables of educational achievement, socioeconomic background characteristics, financial variables, and institutional characteristics (Hanson & Litten, 1982; Hossler & Gallagher, 1987; St. John & Starkey, 1995). Here we do not attempt to predict the choice of major (the AACSB dataset contains information on business programs only). Rather, we extend the litera-ture by investigating the relationship between female stu-dent representation in UBS programs and factors that can potentially influence the enrollment of female students.
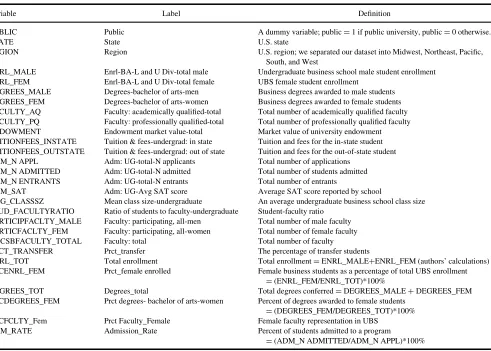
Table 2 provides a list of AACSB variables and their short description.
In addition to three categorical variables—public, state, and region—there were a total of 24 variables in the data-set. We performed two factoring procedures (orthogonal and oblique rotations) in Stata (ver. 12.0, StataCorp, Col-lege Station, TX) to extract a set of factors from the larger set of variables. The results of factor analysis produced four factors based on eigenvalue criteria, Scree plots, and the Kaiser-Meyer-Olkin (KMO) measures, indicating that these factors were appropriate, statistically significant, and explained a cumulative 87% of the variance. In addition to the factor of women’s representation, the three other factors were identified as access, educational environment, and educational experience. Further analysis using the multivar-iable analysis of variance (MANOVA) procedure revealed that these factors were statistically different from each other; they were also statistically reliable according to the Cronbach’s alpha measure. These procedures proved the validity of our groups of variables; however, given the rich-ness of the dataset, we proceeded to analyze the impact of factors and its components on our main variable of interest.
We tested the following hypotheses:
Hypothesis 1(H1):Access: Favorable (perceived or actual) access factors should incentivize female students to attend certain schools.
The variables included in this factor were tuition and fees, SAT scores, student acceptance rate, and the percentage of transfer students. College tuition is a significant investment and research shows that students’ ability to pay plays an important role in their decisions about college (St. John & Starkley, 1995). Not surprisingly, research findings show that there is a strong inverse relationship between tuition increases and enrollment. Thus, we expected economic incentives of lower tuition and fees to be positively related
to female student representation. Turner and Bowen (1999) used SAT scores to examine the extent to which gender dif-ferences in precollegiate preparation affected the choice of fields of study within arts, sciences, and engineering and found that SAT scores accounted for only a part of the observed gap, the main impact was driven by other factors. We also tested economic and statistical significance of the relationship between female student representation and schools’ acceptance rates and the percentage of transfer stu-dents.
H2: Environment: Advantageous (perceived or actual) educational environment variables should have a positive effect on the female students’ choice of schools.
These variables represented the size of an institution (reported as total and by gender measures) and included the number of students enrolled, the number of faculty, and the number of degrees awarded. The dataset also included the variable for the market value of university endowment. Since we did not have a priori assumptions regarding the relationship between women’s representation and the institution’s size (do women prefer broad opportunities of a large university or the personal atmosphere of a smaller university?), it seemed worthwhile to determine whether various measures of institution size had an impact on wom-en’s choice of schools.
While hypotheses H1 and H2 can be used to test the effect of traditional set of factors on student enrollment (male or female),H3examined the effect of variables that may be relevant to female students’ experience only.
H3:Experience: UBS female student representation should be positively influenced by favorable (actual or per-ceived) school characteristics that enhance female stu-dent experience.
TABLE 1
Enrollment and Degrees Conferred
Growth rates (% change)
All schools 2003 2007 2011
Full sample period 2003–2011
Post financial crisis 2007–2011
Number of schools 410 445 467 13.90 4.94
Total enrollment 707,890 787,797 764,084 7.94 ¡3.01
Male students 391,821 450,093 449,760 14.79 ¡0.07
Female students 316,069 337,704 314,324 ¡0.55 ¡6.92
% Female students 44.65 42.87 41.14 # #
Degrees conferred 165,386 159,408 179,865 8.75 12.83
Male students 88,486 88,899 102,807 16.18 15.64
Female students 76,900 70,509 77,058 0.21 9.29
% Female degrees 46.50 44.23 42.84 # #
Note:Bold text indicates the variable of interest—percent of female enrollment.Source:AACSB Business School Questionnaire (AACSB, 2013b) for Undergraduate Enrollment and faculty and staff.
84 L M. DAVIS AND V. GEYFMAN
These factors included enrollment (total and by gender), degrees awarded, average class size, student–faculty ratio, and female faculty representation. Obviously,H3overlaps somewhat with the other hypotheses, but we focused our attention here on female students’ experience. Krupnick (1985) reported on differences in communication styles of male and female students and the resultant effect on teach-ing and learnteach-ing at Harvard College. Classroom discussions and active class participation are considered an integral part of education, but according to the study female stu-dents tended to be underparticipating. The report showed that male students tended to dominate discussions, and women were more vulnerable to interruptions and generally uncomfortable or unwilling to compete against men. Thus, in this study we hypothesized that women may be drawn to programs where they know there are other female students, so the number of female students was included in the set of experience factors. We included a student-faculty ratio, because female students may prefer a more personal and supportive learning experience. Previous studies found that
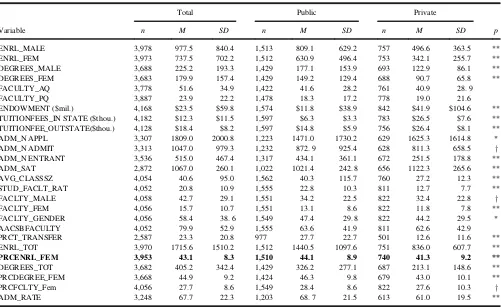
that the presence of female instructors had a positive effect on female students’ participation in classroom discussions (Crombie et al., 2003; Krupnick, 1985). Krupnick found that women spoke almost three times longer under instruc-tors of their own sex than when they were in classes led by male instructors. Similarly, because female students may be attracted to schools with more same-sex role models, we included a variable for the percentage of female faculty at AACSB-accredited institutions. Empirical evidence sug-gests that there is a positive effect of role models in under-represented groups, such as women and minority students (Rask & Bailey, 2002). Table 3 presents descriptive statis-tics for variables in the total sample, and for public and pri-vate institutions.6This study used attest with a .05 level of significance to compare differences of the means of a paired sample and independent samples. We found that public institutions were generally larger, had a higher average class size and student-faculty ratio compared to private institutions. Public universities also reported a higher aver-age number of female students enrolled. Although the TABLE 2
Variable Definitions for AACSB U.S. Accredited Member Schools
Variable Label Definition
PUBLIC Public A dummy variable; publicD1 if public university, publicD0 otherwise.
STATE State U.S. state
REGION Region U.S. region; we separated our dataset into Midwest, Northeast, Pacific, South, and West
ENRL_MALE Enrl-BA-L and U Div-total male Undergraduate business school male student enrollment ENRL_FEM Enrl-BA-L and U Div-total female UBS female student enrollment
DEGREES_MALE Degrees-bachelor of arts-men Business degrees awarded to male students DEGREES_FEM Degrees-bachelor of arts-women Business degrees awarded to female students FACULTY_AQ Faculty: academically qualified-total Total number of academically qualified faculty FACULTY_PQ Faculty: professionally qualified-total Total number of professionally qualified faculty ENDOWMENT Endowment market value-total Market value of university endowment TUITIONFEES_INSTATE Tuition & fees-undergrad: in state Tuition and fees for the in-state student TUITIONFEES_OUTSTATE Tuition & fees-undergrad: out of state Tuition and fees for the out-of-state student ADM_N APPL Adm: UG-total-N applicants Total number of applications
ADM_N ADMITTED Adm: UG-total-N admitted Total number of students admitted ADM_N ENTRANTS Adm: UG-total-N entrants Total number of entrants
ADM_SAT Adm: UG-Avg SAT score Average SAT score reported by school
AVG_CLASSSZ Mean class size-undergraduate An average undergraduate business school class size STUD_FACULTYRATIO Ratio of students to faculty-undergraduate Student-faculty ratio
PARTICIPFACLTY_MALE Faculty: participating, all-men Total number of male faculty PARTICFACLTY_FEM Faculty: participating, all-women Total number of female faculty AACSBFACULTY_TOTAL Faculty: total Total number of faculty
PRCT_TRANSFER Prct_transfer The percentage of transfer students
ENRL_TOT Total enrollment Total enrollmentDENRL_MALECENRL_FEM (authors’ calculations) PRCENRL_FEM Prct_female enrolled Female business students as a percentage of total UBS enrollment
D(ENRL_FEM/ENRL_TOT)*100%
DEGREES_TOT Degrees_total Total degrees conferredDDEGREES_MALECDEGREES_FEM PRCDEGREES_FEM Prct degrees- bachelor of arts-women Percent of degrees awarded to female students
D(DEGREES_FEM/DEGREES_TOT)*100% PRCFCLTY_Fem Prct Faculty_Female Female faculty representation in UBS
ADM_RATE Admission_Rate Percent of students admitted to a program
D(ADM_N ADMITTED/ADM_N APPL)*100%
Source:AACSB Salary Survey, Business School Questionnaire: Enrollment-Undergraduate, faculty and saff, and custom data calculations performed by the authors (AACSB, 2013b).
average number of female faculty was slightly higher at public universities compared to private universities, the average percentage of female faculty representation was approximately the same, around 28% of all business fac-ulty. Combined with the fact that public universities reported a larger student population, the latter finding sug-gests that there was a lower ratio of female faculty to stu-dents; thus, female faculty’s time that could be devoted to advising or mentoring individual female students was limited.
Table 4 presents pairwise correlations between the main variable of interest (the female student representation) and other factors in our dataset. According to Table 4, the per-centage of female students in UBS was significantly related to access variables, confirmingH1. Specifically, there was a negative association between female student representa-tion and tuirepresenta-tion and fees (–.19) and SAT score (–.16). In addition, the percentage of female business students in a program was positively related to the admission rate. In terms of educational environment described inH2, Table 4 shows that there was a negative association between female student representation and male enrollment (–.13), degrees awarded to male students (–.17), and the size of school
endowment (–.13). Collectively, these findings indicate that female students did not seem to care for larger institutions, although as we observed in Table 3, there were more female students on campuses of public universities, which were on average larger than private universities.
Finally, the group of variables identified as women-friendly measures shows that there was a significant posi-tive association between female student representation and the percentage of degrees awarded to female students, which confirmsH3. The average class size and the student– faculty ratios were inversely related to female student representation, but these were statistically significant at vate institutions only, implying that female students at pri-vate institutions tended to vote with their feet (i.e., they were more sensitive and perhaps more insistent on lower student–faculty ratio and smaller class sizes at institutions for which they paid premium to attend).
The percentage of female business students was also positively associated with the percentage of female faculty at UBS (.18), indicating that female students were potentially influenced by the presence of female faculty in the classroom. This relationship was much stronger at private schools (where the TABLE 3
Descriptive Statistics by Type of Institution
Total Public Private
Variable n M SD n M SD n M SD p
ENRL_MALE 3,978 977.5 840.4 1,513 809.1 629.2 757 496.6 363.5 **
ENRL_FEM 3,973 737.5 702.2 1,512 630.9 496.4 753 342.1 255.7 **
DEGREES_MALE 3,688 225.2 193.3 1,429 177.1 153.9 693 122.9 86.1 **
DEGREES_FEM 3,683 179.9 157.4 1,429 149.2 129.4 688 90.7 65.8 **
FACULTY_AQ 3,778 51.6 34.9 1,422 41.6 28.2 761 40.9 28. 9
FACULTY_PQ 3,887 23.9 22.2 1,478 18.3 17.2 778 19.0 21.6
ENDOWMENT ($mil.) 4,168 $23.5 $59.8 1,574 $11.8 $38.9 842 $41.9 $104.6 **
TUITIONFEES_IN STATE ($thou.) 4,182 $12.3 $11.5 1,597 $6.3 $3.3 783 $26.5 $7.6 ** TUITIONFEE_OUTSTATE($thou.) 4,128 $18.4 $8.2 1,597 $14.8 $5.9 756 $26.4 $8.1 **
ADM_N APPL 3,307 1809.0 2000.8 1,223 1471.0 1730.2 629 1625.3 1614.8 *
ADM_N ADMIT 3,313 1047.0 979.3 1,232 872. 9 925.4 628 811.3 658.5 y
ADM_N ENTRANT 3,536 515.0 467.4 1,317 434.1 361.1 672 251.5 178.8 **
ADM_SAT 2,872 1067.0 260.1 1,022 1021.4 242. 8 656 1122.3 265.6 **
AVG_CLASSSZ 4,054 40.6 95.0 1,562 40.3 115.7 760 27.2 12.3 **
STUD_FACLT_RAT 4,052 20.8 10.9 1,555 22.8 10.3 811 12.7 7.7 **
FACLTY_MALE 4,058 42.7 29.1 1,551 34.2 22.5 822 32.4 22.8 y
FACLTY_FEM 4,056 15.7 10.7 1,551 13.1 8.6 822 11.8 7.8 **
FACLTY_GENDER 4,056 58.4 38. 6 1,549 47.4 29. 8 822 44.2 29.5 *
AACSBFACULTY 4,052 79.9 52.9 1,555 63.6 41.9 811 62.6 42.9
PRCT_TRANSFER 2,587 23.3 20.8 977 27.7 22.7 501 12.6 11.6 **
ENRL_TOT 3,970 1715.6 1510.2 1,512 1440.5 1097.6 751 836.0 607.7 **
PRCENRL_FEM 3,953 43.1 8.3 1,510 44.1 8.9 740 41.3 9.2 **
DEGREES_TOT 3,682 405.2 342.4 1,429 326.2 277.1 687 213.1 148.6 **
PRCDEGREE_FEM 3,668 44.9 9.2 1,424 46.3 9.8 679 43.0 10.1 **
PRCFCLTY_Fem 4,056 27.7 8.6 1,549 28.4 8.6 822 27.6 10.3 y
ADM_RATE 3,248 67.7 22.3 1,203 68. 7 21.5 613 61.0 19.5 **
Note: Bold text indicates the variable of interest—percent of female enrollment. The number of observations for public and private universities do not always add up because there were schools in the sample that did not identify themselves as either of these categories.
ypD.10, *pD.05, **pD.01.
86 L M. DAVIS AND V. GEYFMAN
correlation coefficient was .34) than at public schools (with the coefficient of .11).
In summary, our sample of AACSB schools shows that during the period between 2003 and 2011, the effect of access variables was consistent with economic and socio-economic incentives. In other words, an easier access to institutions was associated with a greater number of female students. The findings on the association with the metrics of educational environment indicate that women’s repre-sentation was inversely related to the size of an institution, where size was measured by total enrollment, degrees con-ferred, or the number of faculty. Last, women-friendly insti-tutional variables of the percentage of degrees awarded to women and the ratio of female faculty, were positively related to female student representation, while the average class size and student-faculty ratios were negatively related to this variable of interest.
DISCUSSION AND RECOMMENDATIONS
The study found that while the total enrollment and the enrollment of male students at AACSB-accredited colleges in the United States increased between 2003 and 2011,
women’s enrollment decreased slightly and the percentage of female students at UBS actually fell from 44.7% in 2003 to 41.1% in 2011. If it continues, this enrollment trend may have significant impact on UBS, industry and the national economy. In an initial attempt to understand the trend using a variety of factors that describe school access, educational environment, and women’s experience, we found that (a) economic incentives and socioeconomic conditions play a role in female students’ decision to enroll, (b) female stu-dent representation is lower at larger institutions, and (c) women-friendly institutional factors have a positive effect on women’s representation at UBS.
These findings are not surprising and are consistent with previous research, but constitute only preliminary steps past the starting line in the investigation of this topic. The principal recommendation of this study is that more atten-tion should be given to this enrollment trend and that addi-tional research should be conducted on two fronts. Continued longitudinal tracking of women’s enrollment in UBS is needed to see if the decline continues, abates or reverses. The annual data available from the NCES and the AACSB can be used for this purpose. At the same time, additional study of the factors that influence a women’s decision to attend UBS should be undertaken. For example, what influence do academic preparation, demographics (rural or urban), high school counselors, and teachers have on the decision to enter UBS?
In the meantime, university administrators and UBS must see through any illusions they may have that the steady increase of women undergraduates on their campuses is indicative of growth in women’s enrollment in their business programs. They need to recognize that during the last several years, undergraduate women have consistently and increasingly turned away from studying business—a trend immediately disadvantageous to them and one with broader sociological implications. This awareness is an obvi-ous and critical step. As we continue to learn more about the fac-tors that influence young women to study business, it is likely that the solution to closing the gender gap in business education will require a multipronged strategy that addresses the issue of access and improved campus environment for female students. This study suggests that this can be accomplished by keeping tuition low, class size small, and providing female students with opportu-nities to interact with successful female mentors and role mod-els—all efforts that are likely to be consistent with UBS missions and strategic plans.
NOTES
1. Image of the Kanizsa Triangle where illu-sory contours create the illusion of an equi-lateral triangle.
2. The AACSB is a global membership association rep-resenting the largest network of business schools focused on advancing business education.
TABLE 4
Pairwise Correlations: Percent of Female Students in UBS, 2003–2011
Variable Total p Public p Private p
H1variables: Access
TUITIONFEES_INSTATE ¡.188 ** ¡.343 ** ¡.128 ** TUITIONFEES_OUTSTATE ¡.256 ** ¡.302 ** ¡.134 ** ADM_SAT ¡.161 ** ¡.191 ** ¡.065 y
ADM_RATE .040 ** .027 ¡.159 **
ADM_N APPL .014 .014 ¡.050
ADM_N ADMITTED .002 .011 ¡.050
ADM_N ENTRANTS .027 y .031 .018
PRCT_TRANSFER .312 ** .356 ** .163 **
H2variables: Environment
PARTICFACLTY_FEM ¡.029 * ¡.047 y .020 FACULTY_GENDERTOT ¡.079 ** ¡.082 ** ¡.040 AACSBFACULTY_TOTAL ¡.039 * ¡.035 ¡.029
H3variables: Experience
ENRL_FEM .128 ** .136 ** .112 **
DEGREES_FEM .071 ** .091 ** .049
PRCDEGREES_FEM .826 ** .838 ** .772 **
PRCFCLTY_Fem .177 ** .109 ** .336 *
AVG_CLASSSZ ¡.001 .043 y ¡.118 **
STUD_FACULTYRATIO .018 .027 ¡.104 **
Note:This table presents all pairwise correlation coefficients between female student representation and other variables that describe school access, education environment, and women-specific experience factors.
ypD.10, *pD.05, **pD.01.
3. Similar findings were reported by CNBC for the hedge funds industry (MarketWatch, 2014).
4. The list of variables and their description appears in Table 2.
5. We have been collecting data for our own UBS (an AACSB-accredited public university with approxi-mately 1,500 students) since 1995. Women’s repre-sentation at our school decreased from 45% in 1995 to 33% in 2012.
6. We distinguish between public and private institu-tions because their operational models are inherently different and can produce results that cannot be easily compared and explained.
REFERENCES
Association to Advance Collegiate Schools of Business (AACSB). (2013a). 2013 Business association standards. Retrieved from http:// www.aacsb.edu/accreditation/business/standards/2013/eligibility.asp Association to Advance Collegiate Schools of Business (AACSB).
(2013b).Business school questionnaire for undergraduate enrollment, faculty, and staff. Retrieved from http://www.aacsb.edu/datadirect Ball, J. A. (2012). The gender gap in undergraduate business programs in
the United States.Journal of Education for Business,87, 260–265. Bridger, H. (2010, December 1).Filling in the voids. Retrieved from http://
www.broadinstitute.org/blog/filling-voids
Catalyst. (2007).The bottom line: Corporate performance and women’s representation on boards. Retrieved from http://www.catalyst.org/ search/node/fortune%20500%20performance
Catalyst. (2013). Why diversity matters. Retrieved from http://www. catalyst.org/knowledge/why-diversity-matters
Cebula, R. J., & Lopes, J. (1982). Determinates of student choice of undergrad-uate major field.American Educational Research Journal,19, 303–312. Crombie, G., Pyke, S. W., Silverthorn, N., Jones, A., & Piccinin, S. (2003).
Students’ perceptions of their classroom participation and instructor as a function of gender and context.The Journal of Higher Education,74, 51–76. Davis, L. M., & Geyfman, V. (2012). Gender inequality in undergraduate business schools: The glass door effects.NASPA Journal About Women in Higher Education,5, 46–70.
Dodd-Frank Wall Street Financial Reform and Consumer Protection Act, Pub. L. 111–203, 124 Stat. 1376 (2010).
Hall, R. M., & Sandler, B. R. (1982).The classroom climate: A chilly campus climate for women? Washington, DC: Project on the Status and Education of Women, Association of American College.
Hall, R. M., & Sandler, B. R. (1984). Out of the classroom: A chilly campus climate for women? Washington, DC: Project on the Status and Education of Women, Association of American College.
Hanson, K., & Litten, L. (1982). Mapping the road to academia: A review of research on women, men, and the college selection process. In N. P. Perun (Ed.), The undergraduate woman, issues in education
(pp. 73–77). Lexington, MA: Lexington.
Hossler, D., & Gallagher, K. (1987). Studying college choice: A three-phase model and the implications for policy makers.College and Uni-versity,2, 207–21.
Krupnick, C. (1985). Women and men in the classroom: Inequality and its remedies.On Teaching and Learning,1, 18–25.
Leppel, K., Williams, M. L., & Waldauer, C. (2001). The impact of paren-tal occupation and socioeconomic status on choice of college major.
Journal of Family and Economic Issues,22, 373–394.
Ma, Y. (2009). Family socioeconomic status, parental involvement, and college major choices—Gender race/ethnic, and nativity patterns. Socio-logical Perspectives,52, 211–234.
Malgwi, C. A., Howe, M. A., & Burnaby, P. A. (2005). Influences on students’ choice of college major.Journal of Education for Business,
80, 275–282.
MarketWatch. (2014, January 16). Once again, women hedge-fund manag-ers beat the industry.Wall Street Journal.Retrieved from http://blogs. marketwatch.com/thetell/2014/01/16/once-again-women-hedge-fund-managers-beat-the-industry
Mauldin, S., Crain, J., & Mounce, P. (2000). The accounting principles instructor’s influence on students’ decision to major in accounting. Jour-nal of Education for Business,75, 142–148.
Montmarquette, C., Cannings, C., & Mahseredjian, S. (2002). How do peo-ple choose college majors? Economics of Education Review, 21, 543–556.
National Center for Education Statistics (NCES). (2012).The condition of education. Washington, DC: U.S. Department of Education, Institute of Education Statistics.
Pew Research Center. (2013, May 29). Breadwinner moms.Pew Research Center. Retrieved from http://www.pewsocialtrends.org/2013/05/29/ breadwinner-moms/
Pritchard, R., Potter, G., & Saccucci, M. (2004). The selection of a busi-ness major: Elements influencing student choice and implications for outcomes assessment.Journal of Education for Business,79, 152–157. Rask, K. N., & Bailey, E. M. (2002). Are faculty role models? Evidence
from major choice in an undergraduate institution.Journal of Economic Education,33, 99–124.
SHRM Research. (2006).Talent managment: Driver for organizational sucess. Retrieved from http://www.shrm.org/Research/Articles/Articles/ Documents/0606RQuartpdf.pdf
St. John, E. P., & Starkey, J. B. (1995). An alternative to net price: Assess-ing the influence of prices and subsidies on within-year persistence.
Journal of Higher Education,66, 156–86.
Title IX of the Civil Rights Act of 1964 as amended, 20 U.S.C 1681–1688 (1972).
Turner, S. E., & Bowen, W. G. (1999). Choice of major: The changing (unchanging) gender gap.Industrial and Labor Relations Review,52, 289–313.
88 L M. DAVIS AND V. GEYFMAN