Western Region Fisheries Sector Review
Final Report
December 2010
Cambria Finegold Ann Gordon David Mills Lori Curtis Alan Pulis
This publication is available electronically on the WorldFish Center s website at http://worldfishcenter.org and the Coastal ‘esou es Ce te s e site at http://www.crc.uri.edu
For more information contact: Coastal Resources Center, University of Rhode Island, Narragansett Bay Campus, South Ferry Road, Narragansett, Rhode Island 02882, USA. Brian Crawford, Director International Programs at Email: [email protected]; Tel: 401-874-6224; Fax: 401-874-6920
Citatio :: Fi egold, C., Go do , A., Mills, D., Cu tis, L., Pulis, A. Weste ‘egio Fishe ies “e to ‘e ie , WorldFish Center. USAID Integrated Coastal and Fisheries Governance Initiative for the Western Region, Ghana. 84pp.
Disclaimer: This publication is made possible by the generous support of the American people through the United States Agency for International Development (USAID)/Ghana. The contents are the responsibility of the authors as part of the Integrated Coastal and Fisheries Governance (ICFG) Project and do not necessarily reflect the views of the United States Government. Associate Cooperative Agreement No. 641-A-00-09-00036-00 for
I teg ated Coastal a d Fishe ies Governance (ICFG) Program for the Western Region of Gha a , U de the Leade ith Asso iates A a d No. EPP-A-00-04-00014-00.
Cover Photo: Artisanal fisher in Busua, Western Region, Ghana
TABLE OF CONTENTS
Acronyms ... 2
Acknowledgements ... 3
Executive Summary ... 4
1. Introduction ... 5
2. State of the Fisheries Resource ... 7
3. Fisheries Management ... 29
4. Fish markets, marketing and fish-based livelihoods in Western Region ... 44
5. Stakeholder Analysis ... 50
6. Fishing Culture and Traditions ... 54
7. Institutional and policy context for fisheries development in Ghana ... 60
8. The Way Forward ... 66
Bibliography ... 73
2
Acronyms
AECID Agencia Española de Cooperación Internacional para el Desarrollo APW Ali-Poli-Watsa DoF Department of Fisheries / Fisheries Directorate EEZ Exclusive Economic Zone
EIA Environmental Impact Assessment EPA Environmental Protection Agency
FAO Food and Agriculture Organisation of the United Nations FC Fisheries Commission
GPRSP II Ghanaian Poverty Reduction Strategy Plan II
ICCAT International Commission for the Conservation of Atlantic Tuna ICFG Integrated Coastal and Fisheries Governance Initiative
IEZ Inshore Exclusive Zone
MOLG Ministry of Local Government and Rural Development
MP Member of Parliament
3
Acknowledgements
The authors would like to thank all of the people who contributed their time, information and support to this report. Specifically, we would like to thank Godfred Ameyaw, Kyei Yamoah, Mark Fenn, Kofi Agbogah and the rest of the ICFG team in Ghana; Stephen Olson, Glenn Page, Brian Crawford and the rest of the ICFG team in the USA; Paul Bannerman, Sam Quartey, Patricia Markwei, and Richmond Quartey from the Fisheries Directorate in Tema and Accra; and all of the chief fishermen, chief fishmongers, fisheries staff, and community leaders who met with us during field visits. Last but not least, we wish to thank all of the men and women from the Western Region who took time out of their work to share their insights and experiences with us.
4
Executive Summary
This report was prepared by the WorldFish Center as part of the Integrated Coastal and Fisheries Governance Initiative, led by the Coastal Resources Center of the University of Rhode Island, and aims to provide an overview of the current status and recent history of coastal fisheries in the Western Region of Ghana.
Fish catches in the Western Region and all along the Ghanaian coast have begun to fall, even as the number of vessels active in the fishery continues to increase. While boat numbers are highe tha e e , this does t tell the full sto – effort has increased even more sharply with the introduction of technologies such as light fishing, mobile phones, and increasingly powerful outboard motors. This increase in effort over time is not captured in fisheries data, and the actual situation is likely to be far more dire than official figures suggest.
The uncontrolled depletion of fisheries resources we are currently witnessing is at least partially due to the difficulties in managing the fishery. Though fisheries management has taken on several forms of the years, attempts at limiting access or reducing effort have seen little success, and there are serious geographical, legal, political, and institutional challenges to effective management.
Fish capture, processing, marketing and associated services constitute a significant source of livelihood in Ghana, with one fishing job creating as many as seven additional livelihoods. Most of the Western Region catch enters the processed (smoked) fish marketing chain, and as elsewhere in Ghana, women are dominant in traditional fish processing and trade.
In addition to stakeholders directly involved in fishing, fisheries management, and support sectors at different scales, there are a large number of individuals and organizations involved in governance structures and/or livelihoods strategies that link to the fishery. Coastal fisheries tend to be extremely complex to manage due to the number and variety of stakeholder groups involved, and the Western Region marine fishery is no exception. Key actors in fishing-related governance structures are traditional authorities, including chiefs, chief fishermen, chief fishmongers, and councils of elders; the Government of Ghana; and donors involved in fisheries issues. The Fisheries and Aquaculture Sector Development Plan (2010-2015), developed by the Ministry of Food and Agriculture in consultation with in-country stakeholders and the World Bank, provides the main framework for fisheries development.
5
1. Introduction
Background
This study has been undertaken for the Integrated Coastal and Fisheries Governance (ICFG) Programme - a four-year initiative (2009-2013) supported by the U.S. Agency for International Development (USAID). Implemented through a cooperative agreement with the Coastal Resources Center (CRC) University of Rhode Island (URI), key partners include the WorldFish Center, SustainaMetrix, Friends of the Nation, the Department of Fisheries, coastal districts in the Western Region and other key government, private sector and nongovernmental organizations (NGO) stakeholders along the coast and in the fisheries sector. Programme a ti ities a e o e t ated i the oastal dist i ts of Gha a s Weste Region, where coastal communities and the local government are the intended primary beneficiaries.
The goal of the ICFG Programme is to support the Government of Ghana in achieving its development objectives of poverty reduction, food security, sustainable fisheries management and biodiversity conservation by contributing to the following vision:
Gha a s coastal and marine ecosystems are sustainably managed to provide goods and services that generate long term socio-economic benefits to communities while sustaining biodiversity. (CRC, 2009).
Objectives of the Western Region fisheries sector review
The objectives of this review are:1. to provide key baseline information to inform the identification and design of Phase 2 ICFG programme activities
2. to build consensus and foster buy-in to those critical building blocks for the ICFG programme
This will serve as a key building block to inform subsequent work, including the design of fisheries management initiatives, and as a reference point or sector baseline. It will focus on Western Region but nest the analysis in national and regional context where relevant.
Programme of work
6
assistants). Amongst the many ICFG and FoN staff who contributed substantively to this work, Godfred Ameyaw and Kyei Yamoah s inputs merit particular mention.
Fieldwork (largely based on key informant interviews, focus group discussions and direct observation) was conducted between November 2009 and August 2010 and took place in Western Region coastal communities and key towns that serve those communities (including Takoradi-Sekondi, the regional capital, and markets on the Ivory Coast border). Meetings were also held with key informants in Accra, Tema and Cape Coast and stakeholder consultations held at the regional- and national-level.
With much of the field work for this initial study conducted (of necessity) outside the main fishing season, coupled with results and analysis that require more investigation, the findings presented here should be viewed as preliminary. Much of the work started in the course of this review, will be further elaborated in Years 2-4 of the project, shifting gradually from understanding and learning, to piloting and learning.
Organisation of this report
After this introductory section, the remainder of the report is organized as follows:
state of the fisheries resource fisheries management
markets, marketing systems and fish-based livelihoods stakeholder analysis
7
2. State of the Fisheries Resource
Ghana is truly a fishing nation. While both marine and inland fisheries are not massive in area, they have been, and to some extent remain, extremely productive. Ghanaians rely heavily on fisheries for employment, income and nutrition. It has been suggested that up to 20% of the workforce are directly or indirectly supported by fishing activities (Atta-Mills et al 2004).
Ghana has a coastline of 539km and a continental shelf area of 20,900 km2 (DoF, 2003). The relatively narrow area of continental shelf varies in width from a minimum of 20km at Cape St. Paul to 100km between Takoradi and Cape Coast (Quaatey 1997, Bannerman and Cowx . Gha a s E lusi e E o o i )o e o e s a a ea of , k 2 (GCLME, 2006). There are 310 beach landing sites and 189 coastal fishing villages, as well as major ports where fish is also landed (DoF, 2003).
The productivity of the marine system is supported by a coastal upwelling system, known as the Central West African Upwelling (Cury 2004). Upwelling systems are seasonal phenomena that bring cool, nutrient rich water to the surface, resulting in high productivity, and sustaining a biomass of organisms not seen in other areas of the ocean. By their nature upwelling systems are directly linked with ocean and atmospheric circulation, and the level of productivity they provide can vary massively from year to year. On evolutionary time-scales the instability of upwelling systems, both within and between years, favours small plankton-eating fish with rapid generations times that can take advantage of unpredictably periods of high productivity.
The high biomass of small pelagic species is indeed fortuitous for the people of countries such as Ghana. These lifecycles, developed to take advantage of environmental change, have also proven resilient to fishing pressure, and in some instances shown the ability to recover rapidly from overexploitation (Bakun 1998). Additionally, these small water-column dwelling spe ies, ofte olle ti el efe ed to as s all pelagi s , te d to e i h i oils a d micronutrients, providing exceptional nutritional quality (e.g. Lokko et al 2004). While small pelagic species dominate the catch, they in turn serve as food for a rich diversity of p edato s. As su h Gha a s fishe fo high-value large pelagic species (such as tunas, billfish, and marlin) has also been significant. The productivity supported by the upwelling system spills o e i to the e thi sea floo e i o e t, suppo ti g a i h e os ste of demersal, or bottom-d elli g, fish o Gha a s o ti e tal shelf, “o e lagoo s alo g the coast of Ghana complete the available habitats for marine resources, and provide vital seasonal income and subsistence fish and crustacean catches for adjacent communities.
8
(Koranteng 1998, cited in Koranteng and Pauly, 2004, Aggery-Fynn 2007) can at least in part be attributed to high fishing pressure (Koranteng and Pauly 2004). These observed changes make it clear that without reform in the way the system is governed, the future of the services provided by marine and coastal habitats are by no means assured.
The challenges of managing a system such as this are multi-faceted. The inherent unpredictability of productivity on the Ghanaian coast (Perry and Sumaila 2007) severely compounds the universal governance issues associated with managing common pool resources in a developing country setting. A history of repeated failure shows that the sta da d tool o of te h i ues still taught i a fishe a age e t ou ses si pl cannot apply. Instead new and innovative governance and management systems must be developed that are built with the nature of the Ghanaian coastal social-ecological systems in mind.
I this se tio e pai t a pi tu e of the e ploitatio a d status Gha a s oastal fishe ies from a data and research perspective, but more importantly from the perspective of those whose day to day subsistence depends directly on the state of the resource. Doing so provides alternative views on resource status, and represents a critical early step in building appropriate monitoring, management and governance systems.
Fishing in Ghana
–
fleet structure
Coastal fisheries of Ghana have a colourful history, and the industry is characterized by change and innovation. The fleet today is commonly divided into 4 major categories; the canoe fleet, the inshore fleet, the industrial fleet, and the tuna fleet. In addition here we briefly consider a further important, but extremely data poor, segment; the coastal lagoon fisheries.
The Canoe fleet
B fa the ost u e ous a d di e se fleet seg e t i Gha a, the a oe fishe ha est from all resource sectors; large pelagic fish (tuna, billfish, sharks) though the use of drift gillnets and hook and line gear, small pelagic fish though purse seine and beach seine equipment, and demersal species through set nets and beach seines. The canoe fleet has typically been further classified by size, the groupings also reflecting the types of gear employed:
S all or o e a ca oes – these are typically 4-5m long, are used inshore for line fishing, use of small gill net gears, and cast nets (notably in lagoons). During the last census of canoes (2004), these comprised only 5% of the surveyed canoe fleet. Vessels are typically propelled by paddle or sail, and subsistence fishing, particularly in lagoons, is not captured in landing statistics.
9
Large canoes – are 11 to 17 m long, and crewed by 10 to 25 fishers. This size of vessel can again be subdivided. Ali/Poli/Watsa (APW) canoes are generally the larger boats in this atego . The a e a ed afte the fishi g gea the ha e t aditio all used. The ali et was a gill net constructed from traditional fibres. Poli and watsa nets are types of purse seine. These gear types have evolved considerably over the last century. These canoes also employ large drift nets (such as the so- alled ifa- ifa et . The se o d su -category is the large beach seine vessels, these typically have high planking at the bow to prevent large waves coming on board when operating in the surf. The majority of large canoes are powered by 40hp outboards.
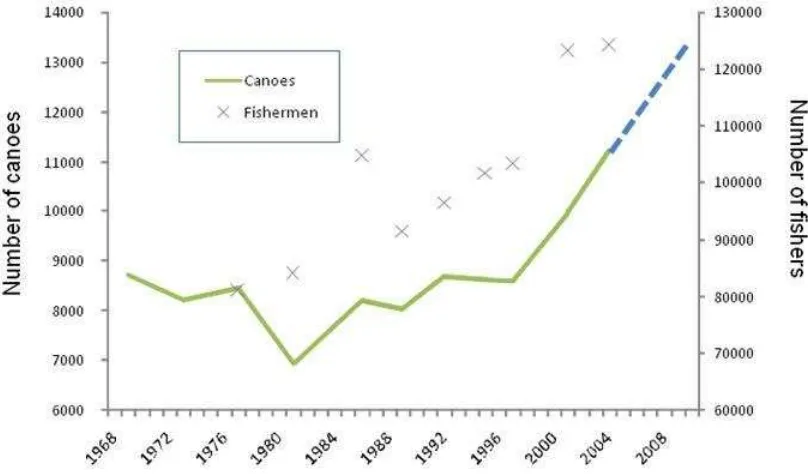
With no registration requirements or limits on access, the number of active canoes in Ghana has continually increased from a low of 7000 in 1980 (Figure 1) to an estimated current fleet size of 13,5001. From 1970 to 1980, approximately 85% of all canoes were reported to be motorized. Since then the figure has fallen to a fairly consistent 55%.
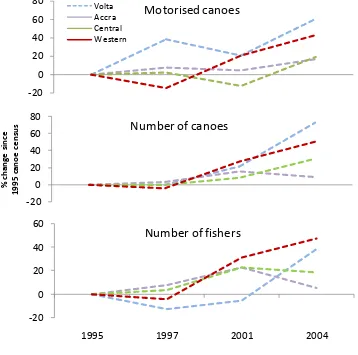
The continued rapid expansion of the canoe fleet over recent years has been distinctly non-uniform (Figure 2). While growth has been most rapid in the Volta region, this region has only 4-6% of the national total of operational canoes. Substantial increases in the Western Region (representing some 36% of the national fleet) have been a significant driver of the national growth in the canoe fleet and number of fishers.
Figure 1. Numbers of canoes and canoe fishermen in Ghana from 1969 until 2004. A simple arithmetic projection until 2010 (dashed line) suggest there may be around 13,500 canoes presently. Anecdotal evidence suggests there may be more (source: Canoe frame surveys, Marine Fisheries Research Division, Tema)
1
10
Figure 2. Growth in number of canoes, fishers and motors from the last 4 canoe frame surveys, split by region. Note that the Volta region represents <6% of the national fleet, while the Western region represents some 36% as of the last census. Source: Marine Fisheries Research Division, Tema
The inshore or semi-industrial fleet
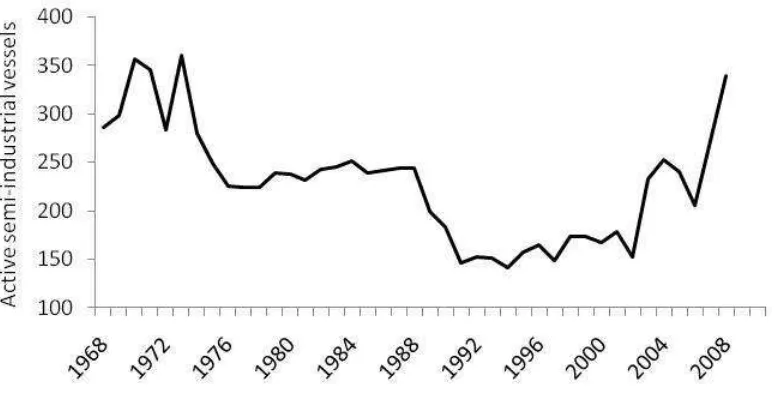
The semi-i dust ial also alled i sho e fleet o p ises ostl lo all -built, planked wooden-hulled vessels between 8m and 30m in length, with inboard diesel engines of between 90 and 400hp (Nunoo et al, 2009, Bannerman and Cowx, 2002, DoF, 2003). These vessels use both trawling gear to catch demersal fish, as well as purse seine gear to capture small pelagic fish during the major and minor upwelling periods. Smaller vessels are generally underpowered for trawling, and with the adoption of light-fishing in the minor seasons, there has been a tendency to specialize in purse seining. Most purse seine nets measure 400-800m long and 40-70m deep with a mesh size of 25-40mm, although nets up to 2km long are used by the larger vessels. The first of these vessels was built in 1948, and numbers quickly boomed to a peak in the early 1970s. Following significant decline, vessel numbers have again peaked in the last few years (Figure 3), sending a warning sign of increasing effort. This likely relates to the adoption of light fishing, and the associated year-round access to the small pelagic resource.
The industrial fleet
The industrial fleet consists of large, steel hulled foreign-built vessels that are further distinguished from the inshore fleet by their ability to freeze fish at sea, and hence their
11
Figure 3. Numbers of active semi-industrial vessels since 1968. A rapid expansion of vessel numbers from 2002 is evident (Source: Marine Fisheries Research Division, Tema and Fisheries Commission, Accra)
propensity to stay at sea for long periods of time. Apart from the tuna fleet (dealt with separately here) today the industrial fleet largely engages in demersal trawling. A sub-fleet specifically targeting shrimp operated in the 1990s with a maximum of 22 operational vessels; however since 2002 only 2 operational shrimpers have been reported. . Another sub-fleet consists of ships practicing pair trawling, in which two industrial vessels pull a trawl net between them. Pair trawling was introduced in 2000, and the fleet grew to 20 vessels before the practice was banned in 2008. Though pair trawlers were supposed to be re-fitted as single trawlers following the ban, some may still be operating in pairs, leaving port separately and meeting up at sea. Fishermen in the Western Region report seeing pair trawling practiced off the coast as recently as this year.
12
The industrial fleet shows a steady expansion, since the mid 1980s (Figure 4) when government policy targeted this fleet to drive fishery development and improved incomes from the sector.
The i dust ial fleet also suppo ts a othe e e ge t fishe ; o e he e t ash fish (low value, small or damaged fish) are transferred at sea from trawlers to canoes specially modified to transport large volumes of fish (Nunoo et al. 2009). These fish then enter the normal beach-based market chain as accessed by canoe fishers. This represents an unusual example of cooperation between the small and large scale sectors.
The tuna fleet
The tuna fleet is commonly considered to be part of the industrial fleet, however being subject to an entirely different governance system, regulated to some degree by international conventions (under the International Commission for the Conservation of Atlantic Tuna – ICCAT), targeting a different resource with very different gear types, and often fishing much further from shore than the other fleets, it should be considered as a separate entity.
The fishery was initially exploited by foreign-flagged vessels, peaking at some 80 active vessels in 1970. The first Ghanaian-flagged vessel began operating in 1973, with the last foreign vessels leaving in 1984. Since this time the number of active tuna vessels has stayed fairly constant at 35 to 40. Here we do not provide further analysis of the tuna fleet or catch, as the fleet is not based in the Western Region, data are not readily available, and there are only tangential links between the operations of this fleet and the coastal environment.
Lagoon-based subsistence and commercial fisheries
As the s allest fishe seg e t i Gha a, lagoo fishe ies ha e e ei ed little atte tio from either the scientific community of national fishery authorities. Yet with some 90 lagoo s alo g Gha as coast, they are significant in terms of both subsistence and seasonal commercial fishing for many communities (Koranteng et al. 2000). Gear used in lagoons is for the most part not recorded in gear surveys, and along with nets operated from small canoes, cast nets, line fishing and various types of traps are commonly employed. Data on yields are also non-existent outside of a few studies in the scientific literature.
13
Box 1.Lagoon fisheries in the Western Region of Ghana
Lagoon fisheries in Ghana are important for the livelihoods of both fishers and consumers alike. Particularly during the lean seasons in marine fishing or when bad weather prevents ocean fishing, they provide an alternative. A significant portion of the animal protein required by the residents of neighbouring communities can be met by lagoons, with 30% of fish consumed at Akitekya, for example, coming from adjacent lagoons. Lagoon fisheries must weather many of the same exploitation pressures as marine fisheries, but in addition suffer additional problems due to land degradation and proximity to human habitation.
crab. This provides seasonal income for those involved.
The Essipon Community in the Sekondi-Takoradi Metropolitan Area (STMA) undertakes significant fishing activities in the neighbouring Anankwar Lagoon, particularly in rainy periods when the lagoon waters are connected to the sea. During high fishing periods, up to 300 fishers can be seen fishing at any time and fishmongers from surrounding communities travel to the lagoon area to purchase fish. Whilst fishing activities here are undertaken throughout the year, other communities only fish in lagoons during particular periods, based on traditional practices. The Anlomatoape Community in the Jomoro district, for example, is only allowed to fish in the Ehuroti Lagoon once a year. Fish farming activities occur in a limited number of lagoons: a portion of the Nana Bekyie Lagoon in the STMA is converted into an aquaculture farm and species such as tilapias, crabs, and mudfish are harvested there.
The importance of lagoon fisheries has been traditionally recognised by communities and a number of management practices are in place, often based on taboos. At Akitekya an apparently sustainable shrimp fishery in the lagoon exists for supply as a local delicacy only – it is taboo to sell shrimp, the villagers believing that if they do so there will be no more shrimp. Many communities ban fishing on particular days or seasons. At Akitekya with lagoons to the east and west, the eastern lagoon is closed on Wednesdays, and the western on Thursdays. At Anakwar Lagoon, the traditional belief is that the god of the lagoon takes a bath every Tuesday and fishing is not allowed on this day. In addition, the use of certain gears is sometimes prohibited – dragnets being the most common. Some lagoons are even restricted to certain fishers – normally indigenous people and/or members of neighbouring
14
early adoption by Ghanaians of large canoes, through the early exploration of offshore waters, and uptake of gear innovations, a highly efficient harvesting system has evolved.
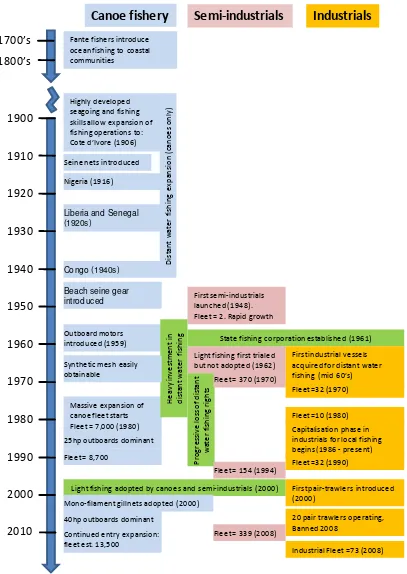
At the beginning of the 20th century, Ghanaian canoe fleets spread out to neighbouring countries becoming truly regional in their fishing range (Figure 5). It was not until 1948 that vessels larger than the canoe fleet were first introduced. In a drive to increase fishing capacity, the State Fishing Corporation (1961) was established. Almost coincident with this, interest in West African fishing waters from European fleets increased markedly. As a result, the price of access agreements skyrocketed, and Ghanaian fleets were progressively e luded f o offsho e ate s th ough the s a d ea l s Atta-Mills and Sumaila 2004). A rapid build-up of industrial and semi-industrial vessels prompted by investment th ough the “tate Fishi g Co po atio , as follo ed a apid de li e though the s a d i to the s as la ge essels e e fo ed to o pete fo li ited spa e ith e isti g fishe s on the continental slope within Ghanaian waters. In the mid- s go e e t poli encouraged further development of industrial fleets essentially for use in national waters, although owners were encouraged to find offshore fishing agreements where possible.
Fuel su sidies offe ed fo P e i out oa d oto fuel f o the late s a e a st o g driver of the continuous climb in canoe numbers seen from that time until today, alongside population pressure and insufficient perceived opportunities for livelihood diversification.
The state of fish resources in Ghana
The current survey and data system used to track catch and effort of the canoe and semi-industrial fleets in Ghana was developed in 1972 in consultation with FAO. The system is robust in design, and has long been considered the best data system in the region. The system relies on regular (every 2-3 years in the past) national frame surveys of vessels to quantify vessel and gear types. These data are used to de elop a ep ese tati e f a e (survey structure) for daily sampling of fishing catches and effort conducted by field officers at. This ensures that vessel and gear types are sampled in proportion to their occurrence in the different regions. As set up, the survey employed 35 full-time data recorders each covering 2 landing beaches. Data outputs include time spent fishing by different types of vessels, the gear-types used, and the catch of prominent species.
15
Figure 5. Timeline of fleet development for canoe (light), semi-industrial (mauve) and industrial (yellow) fleets (excluding tuna vessels). Green highlights changes directly affecting more than one fleet. Data are from interview with Chief Fishers, staff of the Marine Fisheries Research Division, Tema, Doyi 1984, Atta-Mills et al 2004, Koranteng 1984, Koranteng and Pauly 2004, DOF 2003, and the national fisheries data system.
16
Perhaps the most problematic gap i the sa pli g s ste is that i dust ial essels self epo t . The a e asked to p o ide i fo atio o thei o at hes, a d the e is o ethod in place for verifying the information provided. The extremely low catch and effort reported by this fleet provide a strong indication that vessels are substantially under-reporting catches (Further observations regarding the field collection of data are articulated in Annex 1). For these reasons, no direct comparison between fleets is provided here; such a comparison would undoubtedly overemphasise the catch of the relatively well-sampled canoe fleet. Data collection is further complicated by the trans-boundary nature of fishing, as well as the migratory habits of many fishers (Ferraris and Koranteng 2004), factors that are not accounted for in the collection system.
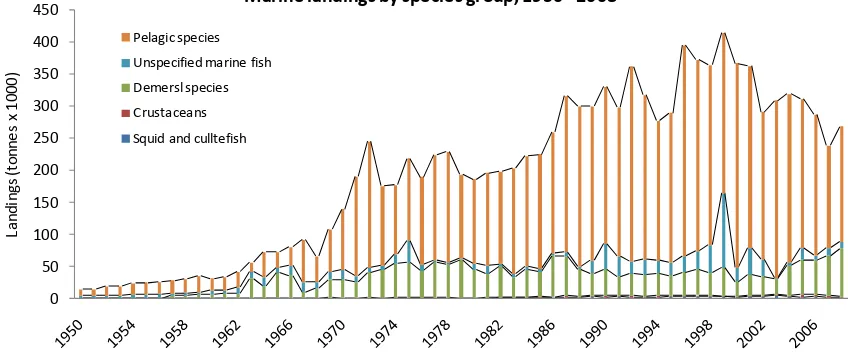
Data o at h f o Gha a s oastal fishe ies a e a aila le as fa a k as (Figure 6) however with the more recent advent of the current system, comparisons of reported catches before and after 1972 should be regarded with caution. Viewed at the macro level, slow development up to the early 1970s is followed by a fairly consistent increase in catch through until the late 1990s. The variability between 1970 and 1990 is expected given the environmental drivers involved in regulating pelagic productivity. It should be noted, however, that the sizeable dip i pelagi at hes f o th ough to the id s coincides with a near-complete crash and slow recovery of the population of the round sardinella (Sardinella aurita) (Koranteng 2004). Since 2000, there has been a clear and continuing trend of decline in total catch, driven largely by a marked decline in pelagic resources, and recently offset to some degree by a rise in catch of demersal species.
Figure 6. Total reported catches from Ghana's marine fisheries from 1950 to 2008 split by major species grouping. Source: FAO FishStat Plus
Pelagic stocks
The management of pelagic fish resources is significantly complicated by the nature of these species. They are not associated with seafloor habitats, relying totally on oceanic productivity. They tend to be fast swimming, schooling species which migrate widely, and crossing national boundaries. Clearly then, to be effective management must be considered at a very broad scale, encompassing neighbouring countries sharing the resource. This represents an added level of vulnerability to pelagic resource sustainability.
17
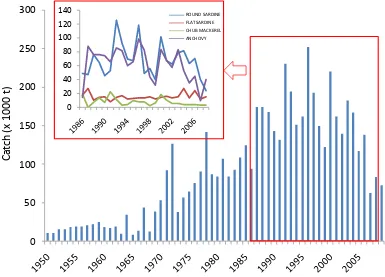
The pelagic resource in Ghanaian waters is exploited by all fleet segments, although catches are largely incidental to industrial trawlers. Small, schooling species (sardinellas, anchovies, mackerel) make up the vast majority of this catch. It is clear that the small pelagic catch is u e tl at its lo est le el si e the s (Figure 7). Given the inherent, environmentally driven variability of the small pelagic resource, we cannot say definitively that the current decline represents a fishery-driven stock collapse that will have lasting effect. What we can say, however, is that we are in the most sustained period of decline in this resource since heavy exploitation began. It is also notable that this decline coincides directly with the uptake of light fishing (discussed below), massively increasing the pressure on this resource.
A detailed e ie of the s all pelagi spe ies at h si e the id s Figure 7, inset) shows that the decline is not due to the crash of one dominant species (as happened in the s , ut athe th ee of the fou ai s all pelagi spe ies ha e lea l de li ed together. Indications from fisher interviews carried out in the Western region are that this trend has continued in 2010.
Figure 7. National data on changes in catch of the small pelagic resource (main graph), including details on catches of sardines, anchovy and chub mackerel since 1986 (inset). Data source: FISHSTAT (FAO) and Marine Fisheries Research Division, Tema.
Demersal stocks
18
fishery though line fishing, bottom-set gill nets and beach seine nets; by the semi-industrial fleet through low season trawling, and; by the industrial fleet through trawling.
By the early 1970s, researchers were already noting the heavily exploited status of demersal stocks in this region, and appealing for urgent reforms in governance systems (Gulland et al. 1973). More recent reviews of the state of demersal stocks in Ghana (e.g. Koranteng and Pauly 2004) report clear trends in the reduction of biomass of longer lived and predatory fishes, suggesting overexploitation of the fishery. These results come from national catch statistics, but also from fishery-independent sources; a series of research trawl surveys conducted between 1963 and 2000. These independent surveys showed a particularly marked decline in the abundance of demersal resources in the 0-30m depth zone.
E os ste s u de hea p essu e a e k o to e o e u sta le a d this is a t e d see i Ghana. The most notable examples of such changes are the repeated collapse and recovery of a shrimp fishery operating around the Volta estuary (Koranteng 1998, cited in Koranteng and Pauly, 2004) and the massive increase in trigger fish (Balistes carolinensis) in 1973 followed by near-total collapse in 1989 (Aggery-Fynn 2007). The latter species had not previously been reported in the area, yet it rapidly came to dominate trawl catches. It is considered likely that its appearance related to the availability of newly created i he spa e due to the holesale e o al of othe de e sal spe ies t a l fishe ies.
While national fisheries statistics are typically analysed for catch and effort as a measure of exploitation rates, there is often information within such datasets that can tell us much more about the state of the fishery, and the effects of exploitation. Effort data in particular a e isleadi g if the oade otio of effe ti e effo t is ot take i to a ou t see below). Catch composition, and the nature of the fish species in the catch can be particularly revealing. Coded in this information are changes in both fish community composition and fisher behaviour – separating the effects of the two can be very difficult, and the interactions between the two add a further complication. Nonetheless, as an indicator of change, catch composition remains very valuable.
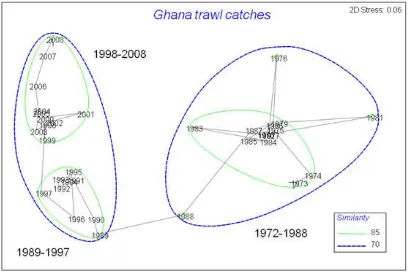
The presentation here (Figure 8) is a multi-dimensional scaling (MDS) plot of fishery catch statistics from 1972 until 2008. A multidimensional scaling plot is a very straightforward te h i ue of data ep ese tatio that si pl plots dista e et ee a se ies of poi ts. There are a range of indices that a e used to easu e dista e et ee sets of community data, or put simply, how different they are from each other. The one employed he e is a B a -Cu tis si ila it i de . This easu e is i effe t the atio of the u e of species that differ between two sites and the total species richness of the two sites. Each point on the graph represents catch data from a year, and it is graphed in a position relative only to all other samples. As such, the axes of the plot have no specific values relating to species.
19
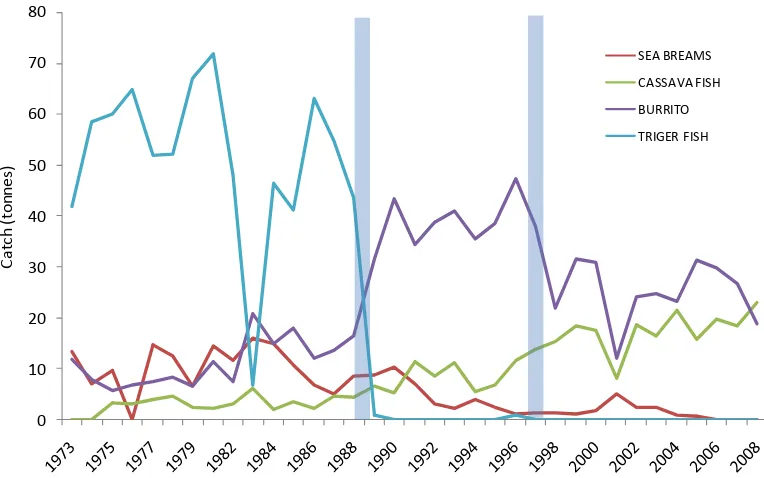
The blue (70%) and green (85%) circles on the graph show statistically significant groupings of similar catches. The most significant shift occurs between 1988 and 1989. This coincides with the crash of the trigger fish fishery, and an increase in Burrito catch (Figure 9). The increase in Burrito catch may well be due to fishers targeting Burrito as a replacement for trigger fish. The second shift between 1997 and 1998 is driven by a decline in Burrito catch and an increase in Cassava fish catch. The continuing change in catch composition right through to the last sample in 2008 is driven by the increasing dominance of Cassava fish in the catch.
While we cannot conclusively relate community shifts to fishing pressure, demersal communities are typically far more stable than pelagic communities. Shifts in community structure due to environmental factors (such as upwelling strength) are unlikely to lead to the permanent changes seen here. Indeed, similar analysis conducted on pelagic catches showed no long-term consistent changes. The shifts seen coincide with the removal of species that are dominant in catches, and as such, the evidence would suggest that fishing pressure may be the principal cause of these changes.
20
Figure 9. Major species contributing to changes in community composition highlighted in figure 8. Blue bars represent the years where major community shifts were highlighted in the MDS analysis.
Perspectives on fishing effort
The most frequently reported catch statistic is landings – simply the quantity of fish caught and returned to shore. Landing data alone, even if very accurate, do not provide a full account of the state of a fishery. It is easy to imagine that if the same quantity of fish is caught in two years, but it took twice as many hours of fishing to catch them in the second year, this is not a good sign for the fishery. This second required measurement is known as fishi g effo t . If e a easu e effo t e a the epo t a at h pe u it effo t – in the case above, the hours fished would be the measure of effort, and if we calculated catch per unit effort (CPUE) as Kg of fish caught per hour of fishing, we would see that in the second year the catch per hour was half as much as it was in the first. Clearly then, looking at catch only tells part of the story.
While the notion of fishing effort is conceptually simple, it is somewhat more complicated to measure, particularly over the long term. There is a diverse range of factors that can contribute to changes in fishing effort that cannot be captured in simple measures. While the Ghanaian fishery information system has been a shining light among African systems, among its most significant shortfalls is the recording of fishing effort, a point that is compounded by the history of change and innovation in Ghanaian fisheries.
At the coarsest level, fleet size provides a measure of effort. An increase in the number of active vessels will likely lead to greater fishing pressure on resources. Taking the situation in Ghana, we can see that the expansion of all fleets from the 1990s (see Figure 1, Figure 3, Figure 4) is not mirrored in total landings (Figure 6). In fact as fleet size has increased, catch has dropped. This crude level of measurement will not provide the whole story, but should be noted as a warning sign regarding the state of resources.
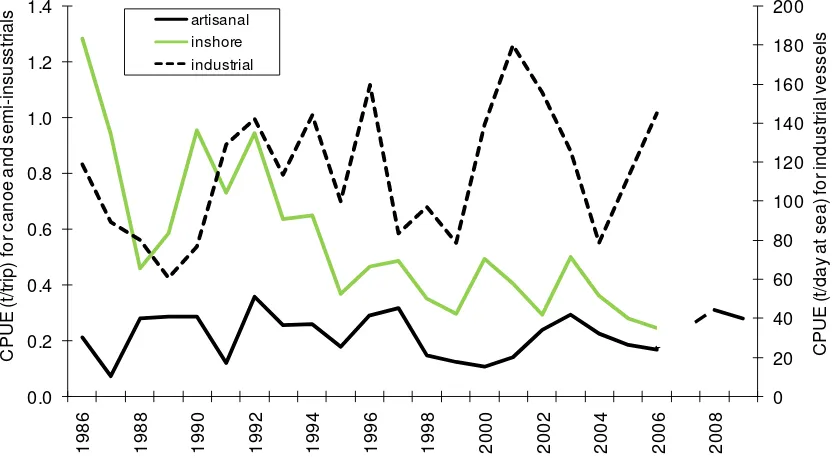
21 reported in terms of catch per trip. For the industrial fleet, with the capacity to stay at sea for long periods of time, effort is reported as catch per days at sea (Figure 10). Data suggest a severe decline in catch per unit effort (CPUE) for the inshore fleet, but no particular trends for the canoe or industrial fleet.
While a step beyond looking at fleet size only, measuring effort in terms of number of fishing trips only can be misleading over the long term. Changes in technology and fishing practices can have a dramatic impact on effective fishing effort with no associated change in number of fishing trips (the chosen measure of effort). As a simple example, the length of fishing
Figure 10. Catch per unit effort (CPUE) for the major fishing fleets in Ghana since 1986.
trips may change. If ice is made available to fishers, they will stay at sea longer – perhaps for two days instead of one – yet the catch for the two day trip would still be recorded as catch for one trip, and directly compared with the catch for a one day trip. Beyond this, changes in fishing practice and technology adoption can have a severe impact on the effective fishing effort on the resource from one fishing trip. Box 2 below illustrates this concept through outlining the results from an interview conducted with a fisherman from Axim.
0
1986 1988 1990 1992 1994 1996 1998 2000 2002 2004 2006 2008
22 Box 2. Innovation and development masking stock declines
The diagram below represents real data from an interview with a canoe fisherman in Axim. It shows change in catch and fishing operations over the last 10 years. The top graph shows a esti ate of o al catch per fishing day by this fisherman. He reported that 10 years ago he was catching around five pans of fish a day. Five years ago this had dropped to around four pans of fish, but now is back up to five pans. This is the type of data currently captured by the fishery information system in Ghana – catch, and days fished. Looking at the top graph, we would probably say that the fishery has fluctuated, but shows no sign of decline over the last 10 years – it looks quite healthy.
A more detailed view of fishing effort shows a very different picture. There have been a number of critical changes over this 10 year period that influenced the ability of this fisherman to catch fish. In response to declining catches five years ago, this fisherman made a several changes. Four years ago he upgraded to a larger boat with extra crew and an outboard motor. This gave him the option of going further afield to catch fish or spending less time getting to fishing grounds (more time fishing). He also employed an extra crew member to speed up fishing operations. Three years ago he added a new set of gear (a multi-panel gill net system known a ka ad ee al ost dou li g the length of net he was deploying each day. Lastly, two years ago he purchased a cell phone, and uses this to call other fishers and discuss where the catch is good on any given day – this also increases his ability to find fish.
While quantifying the direct effect of each of these changes (particularly the cell phone) is difficult, through the
use of e t a gea a d a e t a e e e e ould esti ate that he has o e tha dou led his fishi g po e
o effe ti e effo t . The fi al g aph elo the efo e sho s a e-estimated value of catch per unit effort,
23
Over the past 10 years, the fisher has adopted a number of changes to his fishing practices that have substantially increased the effective effort of a single fishing trip. Measurement of catch per trip suggests a fairly healthy fish stock, while a more detailed analysis shows a very substantial decline in catch per unit effort.
The lo g histo of i o atio a d ha ge i Gha a s oastal fishe ies ea that these concerns are very real. In the canoe and inshore fleets in particular, continued innovation and change have massively increased fishing power, even in the last decade. Below are outlined examples of how technological and behavioural changes undetected by the current data system have had a dramatic impact on effective fishing effort.
Use of and uptake of outboard motors
In 1959 outboard motors were first introduced, along with a government credit system to assist fishers in obtaining engines. Prior to this all fishing vessels in Ghana were powered by sail and oars. Through adopting outboard motors, fishers were able to travel greater distances, following the small pelagic shoals as they moved around seasonally. This had a profound effect on both the catching power of the canoe fleet, and on fisher behaviour and lifest le. Not o l ould the fishe s hase the migrating shoals, but their own frequency of migration decreased, as they were able to access fish further from their camp.
Similarly, the introduction of outboard motors gave gill netters or line fishers accessing the fairly sedentary demersal stocks the ability to maintain catches despite dwindling fish stocks. The te se ial depletio is used to des i e the p o ess he e o e a ea is effe ti el fished out , so fishe s o e to a othe a ea to ai tai at h ates. I Gha a, as shallo water stocks have declined, the use of outboard motors has allowed canoe fishers to move further afield and go further offshore to find new fishing grounds. This is clearly seen over the last 10 years in the Western Region. Interviews with fishers revealed that today on average they travel 2.7 times longer to get to fishing grounds than they did 10 years ago (Figure 11). Given the increase in engine power over this period, the increase in distance which they must travel to find fish would be even higher. Serial depletion masks stock declines up to the point where no further productive fishing grounds are available to fishers. At this point, a severe decline in CPUE would be seen.
1n 1981, engines of 25 to 30 hp dominated the large canoe fleet (Doyi 1984) yet today large canoes are rarely seen with anything other than 40 hp outboards. Due to improving mechanical efficiency of modern outboards and propellers, this may represent a doubling of effective engine power over the past 3 decades. Similarly, small canoes are now often equipped with small (generally 8hp) engines, again increasing effective range.
Change in net systems
24
Figure 11. Relative time taken for fishers to reach their fishing grounds 10 years ago, 5 years ago and now. Data are based on 50 interviews from 8 landing sites in the Western Region.
Changes in net length: As illustrated in Box 2, fishers can double their effective fishing capacity by doubling the length of net used, yet this would not change the measure of effort if number of fishing trips was the only metric used. Direct data on changes in net length were not identified for Ghana. A study of the canoe fishery for large pelagic species (targeting billfish, sharks and tuna) in neighbou i g Cote d I oi e Ba d a d Go a showed that the average length of gill nets doubled between 1984 and 2000 (Figure 12). The fishery data system in Cote dI oi e epo ted a i ease i fishi g t ips f o e lo le els in 1984 (<500 trips) to around 7000 trips in 2000. In fact, if the data are standardised based on the average net length deployed rather than simply number of trips, the effective fishing effort had increased by a factor of 30 rather than a factor of 14 as represented in the data system. The formal statistics gathered on the fishery underestimate change in effective effort by half.
There is no reason to think that the situation will be any different in Ghana. Recent survey results from our study showed that among fishers using multi-panel gill nets (such as tenga and karadwee) there is almost invariably a progression where a small number of net u dles a e i itiall pu hased, a d these a e added to o e ti e, pe haps pu hasi g u dles i itiall , a d addi g o o e pe ea .
Home
port
10 years ago5 years ago Now
Relative time to fishing ground Relative time to fishing ground
1 2 3
1 2
25
Figure 12. Evolutio of gill et le gth i the oastal fishe of Cote d I oire (+/- 1 standard deviation) (data from Bard and Goran 2001, units for net length not provided)
Changes in net materials, mesh size and design
Substantial changes in the materials used to construct nets over the years have had a marked impact on catch efficiency. Early nets were constructed from natural fibres. These had a te de to ot, a d as su h e ui ed f e ue t epai s a d ai te a e, a d soak ti e the ti e ets a e left i the ate o a fishi g t ip as li ited. This di e tl detracted from time spent fishing. Easy access to synthetic fibres substantially improved net efficiency and longevity, and allowed soak times to increase. Monofilament gill nets, which have increased massively in uptake over the last decade, catch fish far more efficiently than synthetic multifilament nets. With this, mesh sizes have continued to decrease, also increasing catch rates. During interviews, a number of fishers in the Western Region noted that they do not travel as far to fish as they used to, as their catches have increased substantially due to using smaller mesh monofilament gill nets.
Mesh sizes used in the construction of purse seine nets and drift nets are also thought to have decreased in recent years.
Light fishing
Light fishing involves using lights to aggregate small pelagic fish to increase their catchability. Light fishing has rapidly become the technological innovation that has had the greatest impact on Ghanaian fishing in the past 20 years. The technique was initially introduced by the Marine Fisheries Research Division (MFRD) and the motivation for this was essentially a one of poverty alleviation and increasing food availability. Canoe fishers found it difficult to make a living outside of the major upwelling season (generally mid-June until September – the aura season) as their main target species, the small pelagics (herrings, sardinella and
0
500
1000
1500
2000
2500
N
e
t
le
n
g
26
anchovies), were not accessible. Trials were conducted initially in 1962 and showed promise (Bannerman and Quartey, undated), however the equipment was too expensive for most fishers, and clearly the potential benefits were not fully understood.
The i e ti es fo light fishi g lea l ha ged i the ea l s he the i sho e fleet began to adopt the technology, and canoe fishers followed. The benefits to the inshore fleet were considerable. These vessels were designed with the intent of operating purse seine gear during the high (upwelling) season, then converting to trawling in the low season. However, most had engines that struggled to pull trawls – light fishing gave them an option to continue purse seine operations throughout the year. Interviews with fishers revealed that catch in the low season may be between 3 and 8 times higher when using lights. Many fishers suggested that with the current level of fish stocks, they would not expect to catch any fish in the low season without lights.
Light fishi g is o a ied out pu se sei e s p edo i a tl atsa gea f o oth the large canoes, and the inshore fleet. Small generators are used to power high wattage incandescent lights that are lowered into the sea on long cables. The use of this technique has essentially extended the targeted small pelagic fishery from a 3 month fishery to a year-round fishery. For many canoe fishers, prior to the adoption of light fishing, fishing activities in the low season were largely for subsistence purposes – it was rare that enough fish were caught to turn a profit. With the use of lights, despite a decline in fish stocks, the chance of turning a profit in the low season has substantially increased. Many fishers who used to move to line or drift net fishing in the low season now continue seine netting year-round.
Notably, lights are not effective around the time of the full moon, and many fishers report only fishing for two weeks every month – a week either side of the new moon. In effect, this may act to decrease fishing effort as measured in number of trips. Yet once the uptake of light fishing is considered, the overall increase in fishing pressure is still considerable, once again confounding CPUE estimates from the fisheries information system.
27
Figure 13. Percentage of interviewed watsa fishers in the Western region engaging in light fishing over the past 10 years. Time of uptake varied considerably between landing areas.
Fishers perceptions and the future
It is clear that through factors such as technological change, motorization, change in fishing methods (such as the adoption of light fishing), net length increases, as well as considerable a d o goi g i eases i fleet sizes, effe ti e fishi g effo t i Gha a s oastal egio s is exploding. Ultimately, however, it is very difficult for a fishery data system to compensate for this multitude of changes in the calculation of effort.
As an alternative indicator of changing catch rates, fishers in the Western Region were asked a series of questions about observed changes in catch and fishing practices over the past decade. Their responses regarding catch rates (Figure 14) stand in stark contrast to CPUE data from the fisheries information system (see Figure 10) which would indicate an increase i CPUE fo the a oe fleet o e this pe iod. The g aph of fishe s pe eptio s sho s that most fishers believe their catches today are in the order of 1/3 the size of catches 10 years ago2. Interestingly this coincides quite well with the raw data on landings, showing a similar rate of decline in landings of small pelagic species over the same period.
Given the dramatic and ongoing changes seen in the Ghanaian fishing fleet, the value of CPUE data calculated from fishing trips alone must be questioned. It is clear that it is of little use as an indicator of management effectiveness or state of fish stocks. The nature of appropriate indicators, however, is not obvious, and development of alternatives should therefore be an immediate priority for research. Indicators strongly linked to community
2
High variability is driven by changes in fishing practices. For example, watsa fishermen who have adopted light fishing methods often reported similar catches now to those obtained without lights 10 years ago. However, those who experienced substantial drops in catches almost universally stated that the use of light fishing was a major contributor to the declines in their catches.
0
2001 2002 2003 2004 2005 2006 2007 2008 2009 2010
28
based or co-management initiatives must be considered, looking outside the classical fishery a age s tool o . Effe ti e a d ea ti e go e a e s ste s cannot be developed in the absence of such indicators.
Figure 14. Fishe s opi io s of de li es i the oastal fishe o e the last ea s, suggesti g u e t at hes are around one third of what they were 10 years ago. Data are presented as standardised scores across gear
t pes a d a oe sizes. The p ese tatio he e is a o a d hiske plot ith the lue li e sho i g the edia s o e fo ea h ea , the o sho i g the 5% a d 75% ua tiles of the dist i utio , a d the hiske s sho i g
the range. This presentation is used because the distributions are decidedly non-normal, and therefore presenting an average is misleading.
29
3. Fisheries Management
The histo of the a age e t of Gha a s oastal fishe ies to date a e usefull organised into four eras – colonial fisheries management, the rise of centralised conventional management, decentralization, and an early experience with co-management - as well as the current period, encompassing the recent past and a series of reform initiatives currently underway.
The fishery is highly complex, and presents several challenges to effective management, including questions of finding appropriate scales for different management activities, legal and political obstacles, significant overlap between fleets, questions around how best to involve traditional authorities, input and fuel subsidies, and conflicting objectives of different stakeholders.
Governance Era 1: Colonial fisheries management
The Fisheries Department (DoF)3 was established by the British in 1946, carrying out primarily fisheries development activities such as the introduction of semi-industrial boats and outboard engines. Both prior to and after the creation of the Fisheries Department, the emphasis of the colonial administration was on encouraging increases in effective fishing effort, particularly through the use of modern fishing gears, in order to boost catches. There are records of conflicts dating back to the 19th century, as local attempts to ban specific gears for being too effective or indiscriminate were overturned by colonial officials. In the first legal case, Akwufio and Others v. Mensah and Others (1899), the Supreme Court of the Gold Coast overturned a local law banning ali nets in Teshi on the grounds that the law was not in place before the Supreme Court Ordinance of 1876. While locally-made laws made before this date were still enforceable, local authorities were deemed to no longer have the authority to make and enforce any new local laws or regulations. Ruling on the case, Chief Justice Sir W. Brandford Griffith further concluded that the ali net would have no negative i pa ts o futu e fish suppl a d that the Go e e t should athe e ou age tha dis ou age the use of the Ali et . This ase as used as a p e ede t th oughout the colonial period, with the attitude that the est fishi g et is the et hi h at hes the ost fish 4 prevailing, and colonial courts consistently ruling that traditional leaders did not have the authority to restrict fishing or ban gears (Atta-Kesson & Atuguba, no date).
3
Fisheries, whether in the form of a department, directorate, or commission, has historically fallen under the Ministry of Food and Agriculture (MOFA), though it gained ministerial status (Ministry of Fisheries, MOFI) from 2005 – 2008 during the presidency of John Kufuor. The abbreviation DoF is used here as a generic term to refer to this institution, though its official name has changed over time.
4
30
Governance Era 2: From traditional to centralised management
The first attempt at regulating fishing came with the Fisheries Regulations LI364 of 1964, seven years after independence (1957), but there was little concern over the sustainability of the fishery at the time, and the focus was more on providing a general administrative framework than on limiting effort. The fishery remained totally open-access and effectively unregulated. Links between fishing communities and the DoF were weak, and where management and conservation measures were introduced, this was typically by chief fishermen rather than the government. As one senior staff member in the DoF put it, the fishe a el eeded a age e t at all i the s a d i to the 70s, with far fewer boats and fishermen, and stronger management by chief fishermen. While effort-limiting measures by chief fishermen had been consistently overruled by colonial courts, they still commanded a good deal of respect and authority locally, and many were able to effectively implement local regulations and manage fishers during this period.Field-based fisheries staff carried out extension activities, channelled subsidised inputs and fuel to fishermen (typically through chief fishermen), and collected fisheries data, though resources and capacity for comprehensive coverage were limited. At the national level, the DoF formulated fisheries policy, managed local and regional fisheries staff, and carried out fisheries research, including running their own research vessel.
Gradually the DoF took on increasing responsibility for fisheries management, though given its limited resources and weak capacity, this was never particularly effective. With increasing numbers of boats and fishermen in an open-access fishery with very limited enforcement capacity, the department proved unable to effectively regulate the increasingly challenging fishery.
Governance Era 3: Decentralisation
31
logistical difficulties presented by a lack of office space and equipment such as typewriters (Ayee, 1997).
While many of the initial difficulties have now been resolved, the institutional configuration created by these reforms still poses challenges for fisheries management. Fisheries, falling under MOFA, are typically represented at the district level by agriculture specialists5, and despite having formal responsibility for fisheries management, DAs rarely engage with fisheries issues. A World Bank evaluation of the Fisheries Sub-sector Capacity Building Project (see below), a five year initiative designed to strengthen the capacity of the DoF, identified the decentralisation reforms as a constraint to effective fisheries management and as a factor which limited the success of the project (World Bank, 2003).
Moreover, while one of the theoretical benefits of decentralisation is that it brings the civil service under greater control of democratically elected local representatives, the flip side of this can be a politicisation of the civil service, and accusations of both corruption and appointments based on party loyalty rather than technical capacity abound. In this context, is it likely that at least part of the failure of district-level authorities to effectively carry out their fisheries enforcement responsibilities may be due not only to lack of resources but lack of political will.
It is also worth noting that one of the key trends of this period, rapid growth in the number of industrial trawlers and the introduction of pair trawling, would have made the fishery more complex to manage, and DAs under whose jurisdiction these ships fell, already lacking the capacity and resources to manage the canoe fleet, would have been ill-equipped to regulate these international business operations. Trawler numbers increased rapidly from just a handful in the 1980s to nearly 80 by the mid-1990s, and have never been subject to effective enforcement or regulation.
Though decentralisation reforms strongly affected fisheries management through their reconfiguration of roles and responsibilities, the impetus for these changes came not from drivers within the fishery, but broader political events. Though earlier decentralisation reforms had been attempted, the most comprehensive ones (and the ones which created the DAs and gave them responsibility for fisheries management) were carried out under the Provisional National Defence Council (PNDC) in the context of other changes such as a restructuring of the civil service and an IMF structural adjustment programme. Even though concerns about overfishing and overcapacity were beginning to emerge by the late 1980s, the most profound changes in fisheries governance in this period were brought about by non-fisheries concerns such as a need to respond to donor imperatives for structural adjust e t a d good go e a e , a d a desi e o the pa t of the PNDC to legiti ise the political system by creating opportunities for local-level democratic participation (Ayee, 1997).
5
32
Governance Era 4: Early experiences with co-management
Decentralisation reforms, however, failed to generate much more participation by local communities in fisheries management than was present in the previous system, and in 1997 a co-management project in the form of Community Based Fisheries Management Committees (CBFMCs) was initiated as part of the World Bank Fisheries Sub-sector Capacity Building Project (FSCBP). The CBFMCs were largely modelled after a management framework developed by the fishing community in Mumford, Central Region, which empowered a local committee, comprising the chief fisherman and seven village elders, to collectively enforce fisheries regulations prepared in consultation with all stakeholders in the fishing community (Braimah, 2009).
The objective of the CBFMC initiative was for artisanal fishing communities, and in particular their traditional leaders, to develop the capacity to formulate and adopt constitutions with stringent by-laws; with financial and practical support and legal backing from DAs in enforcing both local by-laws and national fisheries law. As the government partner in the co-management initiative, the DAs were to help form and sustain CBFMCs (including providing legal and financial support); collaborate with the Department of Fisheries on enforcement activities; and approve the by-laws and levies proposed by the CBFMCs.
At the completion of the project, 133 CBFMCs had been formed along the coast and their constitutions and by-laws passed and adopted by their District Assemblies (DAs), though the vast majority collapsed shortly thereafter. Some of the inland CBFMCs around Lake Volta were revived as part of the Sustainable Fisheries Livelihoods Programme (SFLP), and Friends of the Nation (FoN) is currently engaged in a project to revive or re-create CBFMCs in 16 fishing communities across four coastal regions. In Axim, for example, FoN reorganized a 20 member committee from four defunct ones to comprise five members from each of the previous committees.
Among the factors identified by the World Bank at the time as having had a strong influence on the success or failure of co-management were whether communities were established or transient, and the degree of collaboration and cooperation between DoF, MOFA, and the
absence of a constitution to regulate/enforce tenure of office; lack of or irregular meetings and poor attendance;
members of the committee themselves using illegal fishing gear6;
6
33
lack of monitoring/supervision of the committees;
lack of supply of inputs at subsidized rates and inability of committees to be in charge of inputs distribution;
no motivation/incentives despite immense sacrifices; lack of equipment for work;
dissipation of funds;
belligerency of chief fishermen;
Some important lessons can be drawn from this, both for future co-management initiatives in Ghana, and about co-management in general. If one had to summarise the reasons for the failure of the CBFMCs in one sentence, it would probably be fair to say that they failed because the initiative was conceived and planned with little real input from the people who were to be responsible for its implementation, and that neither fisherfolk, nor DAs, nor traditional authorities, found it in their interest to participate.
For the most part, the CBFMCs were an example of instrumental co-management – the idea was that fishers would be more likely to comply with fisheries regulations if they were involved in fisheries management rather than passive recipients of it. While committees were allowed to develop their own by-laws, and several of them devised local rules (e.g. banning children from the beach during school hours), they were also expected to enforce and comply with national fisheries regulations. One of the most-cited examples of problems arising from this is around mesh size. The minimum permitted mesh size for artisanal fishing is 25mm – a regulation with which many fishers disagree, arguing either that it prevents them from catching mature anchovies or that it effectively rules out beach seining (traditionally practiced by Ewe fishers). Many CBFMC members therefore not only refused to enforce this rule, but also to comply with it. Moreover, expressions of disappointment o e the la k of i e ti es a d i a ilit of o ittees to o t ol dist i utio of su sidised inputs, combined with the fact that many of the CBFMCs collapsed when project funding for expenses such as per diems ended points to one of the fundamental problems with instrumental co-management. When communities see no intrinsic benefits from participating – that is, when the objectives of the initiative in which they are asked to participate do not match their own objectives – their participation will be contingent on receiving some other sort of benefit, typically in the form of material handouts.
For DAs, participation in the CBFMC initiative represented a substantial burden in terms of expected financial, administrative, and legal support for the CBFMCs under their jurisdiction. While most of the by-laws were eventually developed by the CBFMCs and passed by the
others believing that it was legal as long as the bulb does not exceed a certain wattage (100 –
1000W). Until the introduction of the fisheries regulations, prohibited gears were banned by virtue of section 88(1) of the Fisheries Act, whi h p ohi its the use of a e plosi e, poiso o othe o ious substance for the purpose of killing, stunning, disabling or catching fish, or in any way rendering fish