Cont act : Equit y div ision
Phone: ( 6221) 5210077
info- equit y r esear [email protected]
“ Disclaim er st at em ent in t he last page is shar e globally. SMSM’s cor e business consist s of m anufact ur ing r adiat or s under t he ADR br and nam e and filt er pr im ar ily under t he in unfav or able condit ion.
St a ble M a r gin s 173.989 unit s in 1Q10. Wit h very posit ive sign in 1Q10, w e believe SMSM could book 19.9% YoY sales gr ow t h in 2010 w it h Rp 1.65 t n
“ Disclaim er st at em ent in t he last page is an int egr al part of t his r epor t ” w ww .pefindo.com
Ex pe r ie n ce d Sin ce 1 9 7 6
SMSM w as est ablished in 1976, and t oday, SMSM and it s subsidiar ies have been gr ow ing as t he best aut om ot ive com ponent m anufact ur er in I ndonesia, w it h high qualit y and diversified product s, part icularly filt er and r adiat or pr oduct s and w it h w or ldw ide m ar ket cover ing m or e t han 90 count r ies of expor t dest inat ion. SMSM’s cor e business consist s of m anufact ur ing r adiat or s under t he ADR br and nam e and filt er pr im arily under t he SAKURA br and nam e. Abov e t he m ain pr oduct s, SMSM also pr oduces ot her high qualit y pr oduct s such as br ake and fuel pipe, fuel t ank, and m uffler .
Filt e r
Filt er is one of SMSM and Subsidiaries’s m ain pr oduct s w hich div ided in 2 ( t w o) t y pes of filt er , air and liquid filt er - such as oil filt er and hy dr aulic filt er , and fuel filt er . SMSM’s pr oduct ion cover s all segm ent s such as Or iginal Equipm ent Manufact ur ing ( OEM) , Or iginal Equipm ent Spar e par t s ( OES) , Aft er Mar ket house br and ( SAKURA) and pr iv at e br anding. Meanw hile, PJM, SMSM’s Subsidiar y, m ainly focuses on t he heavy equipm ent and indust r ial segm ent s such as bus, t r uck, t r act or , t r ain, gas t ur bine and ot her s. I n filt er m anufact ur ing, SMSM and Subsidiar y have t echnical assist ance fr om Tennex Cor por at ion, Japan and Donaldson Com pany I nc., USA.
Figu r e 1 : Filt e r Sa le s
( in Rp bn)
176 160 187
256 274
325
446 471
609
769
725
857
0 150 300 450 600 750 900
2005 2006 2007 2008 2009 2010P
Local Export
Sour ce: PT Selam at Sem pur na Tbk
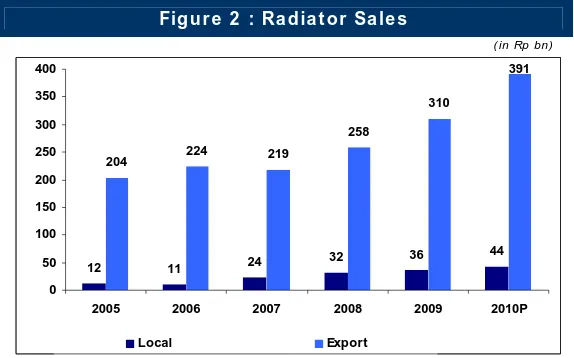
Ra dia t or
Besides filt er , Radiat or is also one of SMSM m ain pr oduct s. I n r adiat or pr oduct ion, SMSM has t echnical assist ance fr om Tokyo Radiat or Mfg.Co.Lt d., Japan. Based on t he t echnical assist ance agr eem ent , SMSM m ust pay Tokyo Radiat or r oyalt y fee at t he r at e of 5% of net sales of t he licensed pr oduct s. I n local m ar ket m ost of radiat or pr oduct s ar e used as Or iginal Equipm ent Manufact ur ing ( OEM) par t s, m eanw hile for expor t m ar ket are t o supply AM ( aft er m ar ket ) cust om er s.
Figu r e 2 : Ra dia t or Sa le s
( in Rp bn)
12 11 24 32
36 44
204 224 219
258
310
391
0 50 100 150 200 250 300 350 400
2005 2006 2007 2008 2009 2010P
Local Export
Sour ce: PT Selam at Sem pur na Tbk
“ Disclaim er st at em ent in t he last page is an int egr al part of t his r epor t ” w ww .pefindo.com
Pr odu ct Ce r t ifica t ion
I n t he qualit y aspect , SMSM and it s subsidiar ies had r eceiv ed t he I SO 9002: 1994 cer t ificat es. I n t he Aut om ot iv e I ndust r y in par t icular , SMSM and it s subsidiar ies also receiv ed an I SO/ TS 16949: 2002 cert ificat es, m arked it as t he first com pany in I ndonesia t o get t his cer t ificat ion. That show s SMSM’s com m it m ent t o cont inuously im pr ov e it s qualit y m anagem ent sy st em in or der t o incr ease t he cust om er s’ t r ust and t o ensur e t he cust om er s’ sat isfact ion.
Su ppor t e d by I n t e r n a t ion a l Te ch n ica l Assist a n ce
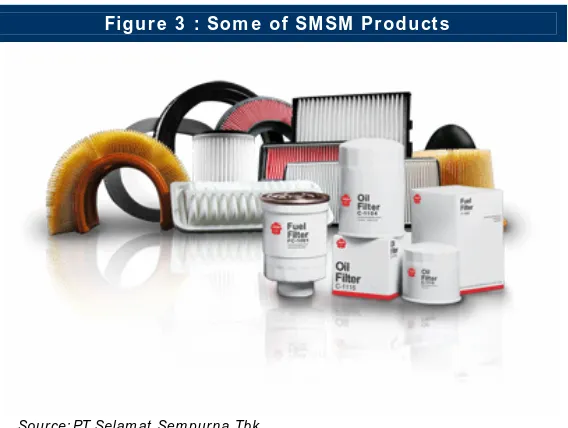
SMSM has int egr at ed pr oduct ion facilit ies, st ar t ing fr om init ial design of pr oduct s, design of equipm ent and m ould, labor at or y cont r ol for pr oduct s’ qualit y t o t he finishing of pr oduct s. SMSM is also suppor t ed by t echnical assist ance fr om t he for em ost aut om ot ive com ponent m anufact ur er , such as Tokyo Radiat or s Mfg.Co.Lt d, Tennex Cor p., and Donaldson Com pany inc., in order t o be able t o m eet t he pr oduct s specificat ion r equired by cust om er s. SMSM’s m ar ket ing st r at egies ar e consist ent w it h t he overall cor por at e m ot t o as t o give t he cust om er a bet t er choice in consist ent ly high qualit y pr oduct s at com pet it ive pr ices.
Figu r e 3 : Som e of SM SM Pr odu ct s
Sour ce: PT Selam at Sem pur na Tbk
Re a dy for Fr e e Tr a de I m ple m e n t a t ion
I n t he fut ur e, SMSM w ill face sever al challenges w it h t he im plem ent at ion of m or e globalize Fr ee Tr ade Ar ea. I n t he com pet it ion aspect , t his condit ion w ill cr eat e an ever incr easing com pet it ion. But t he m ar ket gr ow t h pot ent ial is st ill ver y pr om ising in t he long t er m . Reflect ing on t his, w e believe t hat t he fut ure of aut om ot iv e com ponent s indust r y is pr om ising.
To accom m odat e t hat condit ion, SMSM has alr eady had w ell- planned st r at egies, such as developing dist r ibut ion net w or k and var ious pr om ot ions t hr ough int er nat ional or local ex hibit ions, im prov ing aft er sales ser vice, t echnology and pr oduct ion capacit y, t he pr oduct qualit y and deliv er y t im e, w hich in t urn w ill im pr ove cust om er s’ sat isfact ion.
Figu r e 4 : Sa le s by Re gion
25%
28% 25%
7% 15%
Local Asia US Australia Europe & Other
“ Disclaim er st at em ent in t he last page
Sour ce: PT Selam at Sem pur na Tbk.,Pefindo
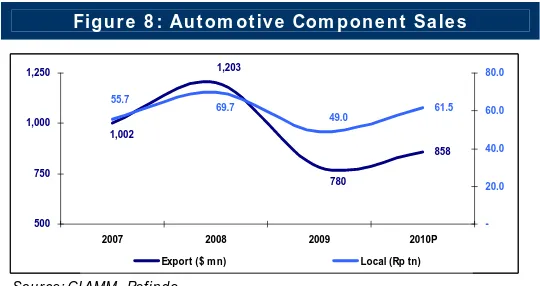
“ Disclaim er st at em ent in t he last page com ponent m ar ket . Since 2006, SMSM’s expor t sales have been cont inuously grow ing; result ing in 12.3% CAGR w it hin 2006- 2009. As GI AMM’s dat a show ed,
Sour ce: PT Selam at Sem pur na Tbk.,Pefindo
“ Disclaim er st at em ent in t he last page is an int egr al part of t his r epor t ” w ww .pefindo.com
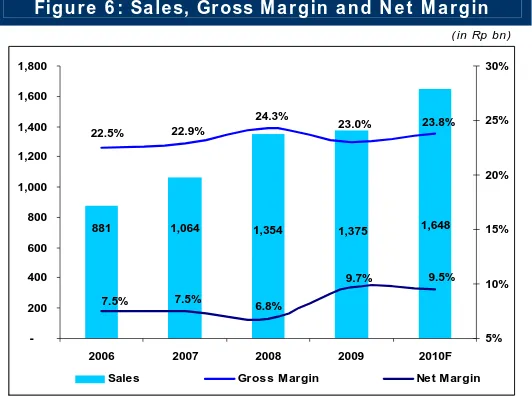
Bu sin e ss Pr ospe ct s
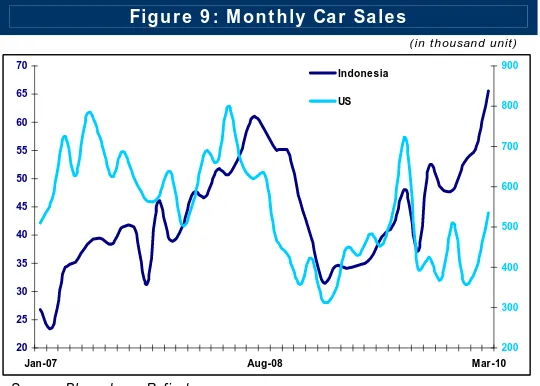
Despit e cloudy aut om ot ive com ponent indust r y in 2009, w e believe in 2010 ahead t he indust r y w ill be get t ing bet t er . I t is indicat ed by US’ car sales in 1Q10 t hat booked 16.8% YoY gr ow t h fr om 1.1 m n unit s in 1Q09 t o 1.3 m n unit s in 1Q10. I ndonesia’s car sales r ecor d ev en bet t er gr ow t h in 1Q10 w it h 73.5% YoY, from 100.257 unit s in 1Q09 t o 173.989 unit s in 1Q10. Wit h very posit ive sign in 1Q10, w e believe SMSM w ill book 19.9% YoY sales gr ow t h in 2010 w it h Rp 1.65 t n sales, and 18.7% CAGR unt il 2014.
Figu r e 9 : M on t h ly Ca r Sa le s
( in t housand unit )
20 25 30 35 40 45 50 55 60 65 70
Jan-07 Aug-08 Mar-10
200 300 400 500 600 700 800 900
Indonesia
US
Sour ce: Bloom berg,Pefindo
Ta ble 1 : SW OT An a ly sis
St r e n gt h
W e a k n e ss
• Exper ience in aut om ot ive com ponent indust r y since 1976.
• Wide dist r ibut ion net w or k.
• Being m ar ket leader and benchm ar k in filt er and radiat or m ar ket .
• Technical suppor t fr om com pet ent par t y.
• Adequat e idle pr oduct ion capacit y t o accom m odat e sales gr ow t h.
• Wide pr oduct diver sificat ion.
• High im por t cont ent in r aw m at er ial.
• Dependence on t hir d par t y’s t echnical assist ance.
Oppor t u n it y Th r e a t
• I ncr easing aft er sales m ar ket due t o incr easing dem and fr om vehicles ow ner s.
• Higher pr ofit m ar gin due t o low er st eel pr ice.
• The incom ing fr ee t r ade policy w hich pot ent ially incr ease t he Com pany ’s ex por t m ar k et .
• I m it at ion pr oduct s in dom est ic and int er nat ional m ar ket dim inish cost um er t r ust • China’s pr oduct s offer lower
pr ice even in differ ent qualit y. • I nst abilit y of I m por t t ar iff
policy.
• I ncr easing of r aw m at er ial, elect r icit y and fuel pr ice cr eat e price disadvant age.
“ Disclaim er st at em ent in t he last page is an int egr al part of t his r epor t ” w ww .pefindo.com
V ALUATI ON
• M e t h odology
We apply Discount ed Cash Flow ( DCF) m et hod as t he m ain v aluat ion appr oach consider ing t he incom e gr ow t h is a v alue dr iv er in SMSM inst ead of asset gr ow t h.
Fur t her m or e, w e also apply Guideline Com pany Met hod ( GCM) as com par ison m et hod.
This valuat ion is based on 100% shar es pr ice as of Desem ber 31st, 2009.
• V a lu e Est im a t ion
Tar get pr ice for 12 m ont hs based on v aluat ion as per Desem ber 31st, 2009 is
as follow s:
Using DCF m et hod w it h discount r at e assum pt ion 9.6% , is Rp 1,877 - Rp 2,087 per share.
Using GCM m et hod ( PBV 2.95X and P/ E 11.49X) is Rp 1,020 - Rp 1,060 per shar e.
I n or der t o obt ain a v alue w hich r epr esent s bot h v alue indicat ions, w e hav e w eight ed bot h DCF and GCM m et hods by 70% : 30% .
Based on t he above calculat ion, t ar get pr ice of SMSM for 12 m ont h is Rp
1 ,6 2 0 - Rp 1 ,7 8 0 per shar e.
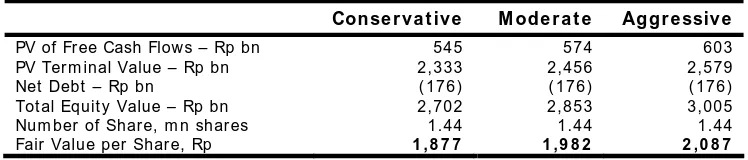
Ta ble 2 : D CF M e t h od
Con se r va t ive M ode r a t e Aggr e ssiv e
PV of Fr ee Cash Flow s – Rp bn 545 574 603
PV Ter m inal Value – Rp bn 2,333 2,456 2,579
Net Debt – Rp bn ( 176) ( 176) ( 176)
Tot al Equit y Value – Rp bn 2,702 2,853 3,005 Num ber of Shar e, m n shar es 1.44 1.44 1.44 Fair Value per Shar e, Rp 1 ,8 7 7 1 ,9 8 2 2 ,0 8 7 Sour ce: Pefindo Est im at es
Ta ble 3 : Assu m pt ion
Risk fr ee r at e ( % ) 9.5 Risk prem ium ( % ) 5.0
Bet a ( x ) 0.15
Cost of Equit y ( % ) 10.2 Mar ginal t ax r at e ( % ) 28.0
W ACC ( % ) 9 .6
Sour ce: Bloom ber g, Pefindo Est im at es
Ta ble 4 : GCM Com pa r ison
SM SM AUTO AV G
P/ E 14.04 8.94 11.49
PBV 3.76 2.14 2.95
EV/ EBI TDA 7.79 11.92 7.49
Sour ce: Bloom ber g
“ Disclaim er st at em ent in t he last page is an int egr al part of t his r epor t ” w ww .pefindo.com
( Rp bn)
I n com e St a t e m e nt 2 0 0 7 2 0 0 8 2 0 0 9 2 0 1 0 P 2 0 1 1 P
Sales 1,064 1,354 1,375 1,648 1,978 COGS ( 820) ( 1,025) ( 1,058) ( 1,256) ( 1,510)
Gr oss Pr ofit 2 4 4 3 2 9 3 1 6 3 9 2 4 6 7
Oper at ing Ex pense ( 94) ( 116) ( 126) ( 148) ( 173)
Ope r a t in g Pr ofit 1 5 0 2 1 3 1 9 0 2 4 4 2 9 5
Ot her I ncom e ( Char ges) ( 19) ( 69) ( 4) ( 3) ( 3)
Pr e - t a x Pr ofit 1 3 1 1 4 4 1 8 6 2 4 1 2 9 2
Tax ( 42) ( 42) ( 43) ( 67) ( 82) Minor it y I nt er est ( 8) ( 10) ( 10) ( 16) ( 20)
N e t Pr ofit 8 0 9 1 1 3 3 1 5 7 1 9 0
Sour ce: PT Selam at Sem purna Tbk., Pefindo Est im at es
Ra t io 2 0 0 7 2 0 0 8 2 0 0 9 2 0 1 0 P 2 0 1 1 P
Gr ow t h ( % )
Sales 20.76 27.21 1.56 19.89 19.99 Oper at ing Pr ofit 29.98 41.98 ( 10.88) 28.62 20.71
EBI TDA 68.58 38.04 ( 0.63) 24.48 16.06 Net Pr ofit 21.38 13.88 45.24 18.19 21.22
Pr ofit a bilit y ( % )
Gr oss Mar gin 22.91 24.29 23.01 23.80 23.63 Oper at ing Mar gin 14.10 15.73 13.81 14.81 14.90 EBI TDA Mar gin 18.48 20.05 19.62 20.37 19.70 Net Mar gin 7.55 6.76 9.66 9.53 9.62
ROA 9.68 9.84 14.11 15.01 16.30
ROE 16.7 16.7 26.7 27.6 29.1
Solv a bilit y ( X )
Debt t o Equit y 0.65 0.62 0.80 0.76 0.71 I nt er est Bear ing Debt t o Equit y 0.42 0.38 0.35 0.37 0.38 Debt t o Asset 0.38 0.37 0.42 0.41 0.40
Liqu idit y ( X )
Cur r ent Rat io 1.71 1.82 1.59 1.76 1.91 Quick Rat io 0.78 0.84 0.79 0.90 1.00
Sour ce: PT Selam at Sem purna Tbk., Pefindo Est im at es
( Rp bn)
Ba la n ce Sh e e t 2 0 0 7 2 0 0 8 2 0 0 9 2 0 1 0 P 2 0 1 1 P
Asse t s
Cu r r e n t Asse t s
Cash and cash equivalent s 9 14 9 21 29 Receivables 208 244 279 334 401 I nvent or y 245 286 255 302 364 Ot her Asset s 13 11 32 32 32
Tot a l Cu r r e n t Asse t s 4 7 5 5 5 5 5 7 5 6 9 0 8 2 7
Fixed Asset s 319 358 341 330 316 Ot her Asset s 37 16 25 25 25
Tot a l Asse t s 8 3 0 9 3 0 9 4 2 1 ,0 4 6 1 ,1 6 8
Lia bilit ie s
Tr ade payables 53 51 128 128 128 Shor t - t er m payables 180 190 164 194 234 Ot her Shor t - t er m payables 45 64 70 70 70 Long- t er m payables 23 18 13 16 13 Ot her Long- t er m payables 15 18 22 22 22
Tot a l Lia bilit ie s 3 1 6 3 4 1 3 9 7 4 3 1 4 6 7
M in or it y I n t e r e st 3 2 4 2 4 6 4 6 4 6
Tot a l Equ it y 4 8 2 5 4 6 4 9 8 5 6 8 6 5 4
“ Disclaim er st at em ent in t he last page is an int egr al part of t his r epor t ” w ww .pefindo.com
D I SCLAI M ER
PT Pem eringkat Efek I ndonesia ( PEFI NDO) does not guar ant ee t he accur acy, com plet eness, t im eliness or availabilit y of t he cont ent s in t his
r epor t or publicat ion. PEFI NDO cannot be held liable for it s use, it s par t ial use, lack of use, in com binat ion wit h ot her pr oduct s or used solely, nor can it be held r esponsible for t he r esult from it s use or lack of it s use in any invest m ent or ot her kinds of financial decision m aking on
w hich t his r epor t or publicat ion is based. I n no event shall PEFI NDO be held liable for any dir ect , indirect , incident al, exem plar y, com pensat or y, punit ive, special or consequent ial dam ages, cost s, ex penses, legal fees, or losses including but not lim it ed t o lost pr ofit s and
oppor t unit y cost s in connect ion wit h any use of t he cont ent s of t his r epor t or publicat ion. Credit analyses, including r at ings, and st at em ent s in t his repor t or publicat ion are st at em ent s of opinion as of t he dat e t hey ar e expr essed and not st at em ent s of fact or r ecom m endat ions t o
pur chase, hold or sell any securit ies or t o m ake any invest m ent decision. The cont ent s cannot be a subst it ut e for t he skill, j udgm ent and experience of it s user s, it s m anagem ent em ployees and/ or client s in m aking invest m ent or ot her business decisions. PEFI NDO also assum es
no obligat ion t o updat e t he cont ent following publicat ion in any for m . PEFI NDO does not act as fiduciar y or an invest m ent advisor . While PEFI NDO has obt ained inform at ion fr om sour ces it believes t o be r eliable, PEFI NDO does not per for m an audit and does not under tak e due
diligence or independent verificat ion of any inform at ion used as t he base of and pr esent ed in t his r epor t or publicat ion. PEFI NDO keeps t he act ivit ies of it s analyt ical unit s separ at e fr om it s business unit s t o pr eser ve independence and obj ect ivit y of it s analyt ical pr ocesses and
pr oduct s. As a result , cer t ain unit s of PEFI NDO m ay have inform at ion t hat is not available t o ot her unit s. PEFI NDO has est ablished policies and pr ocedures t o m aint ain t he confident ialit y of cer t ain non- public inform at ion r eceived in connect ion w it h each analyt ical process.PEFI NDO
m ay r eceive com pensat ion for it s r at ings and ot her analyt ical w or k, nor m ally fr om issuer s of securit ies. PEFI NDO r eser ves t he right t o dissem inat e it s opinions and analyses. PEFI NDO public r at ings and analyses ar e m ade available on it s Websit e, ht t p: / / w w w .pefindo.com ( fr ee
of char ge) and t hr ough ot her subscript ion- based ser vices, and m ay be dist ribut ed t hr ough ot her m eans, including via PEFI NDO publicat ions and t hird par t y r edist ribut or s. I nfor m at ion in PEFI NDO’s w ebsit e and it s use fall under t he rest rict ions and disclaim er st at ed above.