Cont act :
Equit y & I ndex Valuat ion Division Phone: ( 6221) 7278 2380
5/3/2010 6/16/2010 7/28/2010 9/16/2010 10/28/2010 12/13/2010 1/26/20113/11/2011 4/25/2011
“ Disclaim er st at em ent in t he last page is an int egral part of t his report ” w ww .pefindo.com
Bu sin e ss Pr ofile
PT Selam at Sem pur na, Tbk ( " SMSM" ) w as est ablished since 1976, w hich t hen acquir ed PT Andhi Chandr a Aut om ot ive Pr oduct s ( “ ACAP” ) in 1994. ACAP w ent public in 2000, and t hen consolidat e w it h SMSM in 2006, as a part of creat ing efficiency and effect iveness. The cor e business of SMSM is m anufact ur ing aut om ot ive com ponent s, m ainly radiat or s under t he brand nam e of ADR and filt ers prim ar ily under t he brand nam e of Sakura. Ot her t han t he m ain product s, SMSM also produces ot her aut om ot iv e product s, such as brake and fuel pipes, fuel t anks, and m ufflers. Wit h it s high qualit y and world class product s, SMSM has sold t heir pr oduct s t o over t han 100 count r ies, w it h Asia and Am erika as t heir m ain m ar ket , w it h around 54% and 25% of cont r ibut ion for SMSM’s r evenue in 2010. SMSM now has a t ot al product ion capacit y of 72 m illion unit s for filt er product s, and around 1.95 m illion unit s of radiat ors pr oduct s per year.
Figu r e 1 : Som e of SM SM ’s Pr odu ct s
Source: PT Selam at Sem purna Tbk., Pefindo Equit y & I ndex Valuat ion Division
SMSM is a m em ber of ADR group, an aut om ot ive com ponent s m anufact urer , and curr ent ly t he m aj or it y of SMSM’s shares are ow ned by PT Adrindo I nt iperkasa, wit h t ot al ow nerships of 58.13% . SMSM ow ns ar ound 70% of PT Panat a Jaya Mandir i ( “ PJM” ) shares, it s subsidiary which produces filt ers for heavy equipm ent vehicles.
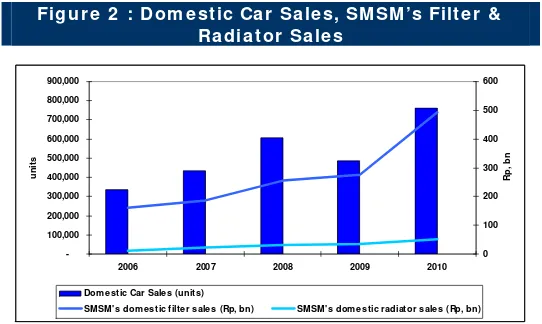
2 0 1 0 : Fa n t a st ic Ye a r of D om e st ic Ca r Sa le s h a s D r a gge d SM SM ’s Re v e n u e Up I n t he dom est ic car indust r y, t he year of 2010, w ill be r em em ber ed as one of t he fant ast ic year , in w hich t ot al volum e of car sales in I ndonesia r eached 731,415 unit s, br eak ing t he record of car sales volum e in I ndonesia. I t ’s also beyond t he t arget ed car sales volum e of 720 t housand unit s. Com par ed t o t he 2009 period, t he volum e of car sales has up by 57% YoY, since t he t ot al of car sales in 2009 only r eached 486.2 t housand unit s. Wit h t his significant grow t h of car sales, SMSM’s revenue, par t icularly t he revenue from filt er and radiat or t hat sold in dom est ic m arket , also experienced a significant grow t h. The 2010 t ot al r evenue fr om sales of filt er in dom est ic m ar ket r eached Rp 494.35 billion or ups by 80% YoY, and t he revenue from t he sales of radiat or in dom est ic m ark et r eached Rp 51.6 billion or ups by 44.3% YoY.
Many fact or s causing t he gr ow t h of dom est ic car sales in 2010, such as t he gr ow t h of I ndonesian econom y which reached 6.1% YoY, m anageable inflat ion, relat ive st able of banks int erest rat e, and also increasing num bers of m iddle t o high class people.
Figu r e 2 : D om e st ic Ca r Sa le s, SM SM ’s Filt e r &
Ra dia t or Sa le s
-100,000 200,000 300,000 400,000 500,000 600,000 700,000 800,000 900,000
2006 2007 2008 2009 2010
uni
ts
0 100 200 300 400 500 600
Rp
, b
n
Dom estic Car Sales (units)
SMSM's dom estic filter sales (Rp, bn) SMSM's dom estic radiator sales (Rp, bn)
D om e st ic Ca r Sa le s Ou t look in 2 0 1 1 : Ch a lle n ge s Ah e a d
Dur ing Januar y – Mar ch 2011, dom est ic car sales volum e r eached 224.4 t housand unit s, im proved by 29.2% YoY com pared t o t he sam e period in 2010 which only reached 174.1 t housand unit s. St able supply of cars t o dealers and st able sales price of cars support ed t his growt h of sales. Howev er, w e predict t he dom est ic car indust ry w ill be facing challenges in 2011. Pr ogr essive t ax t hat has been im plem ent ed in sev er al pr ovinces has caused a shor t t im e drop of car sales, such as happened in East Java. I ncreasing cost of changing car’s ow nerships nam e and rest rict ions on subsidized gasoline also becom e challenges t hat m ight ham per t he grow t h of dom est ic car sales indust ry . Howev er, since t hose policy is not fully em ployed t hroughout I ndonesia, t he car sales indust ry st ill experience gr owt h during 1Q11, which at t he end also im pact ing on t he sales of filt er s and radiat ors produced by SMSM t o dom est ic m ark et s t hat reached Rp 109.5 billion, im pr oved by 12.1% YoY com par ed t o t he 1Q10 per iod w hich only r eached Rp 97.6 billion.
Figu r e 3 : D om e st ic Ca r Sa le s a n d SM SM ’s Re ve n u e
fr om D om e st ic M a r k e t in 1 Q1 1
0 50 100 150 200 250
1Q10 1Q11
Thous
a
nd uni
ts
90 92 94 96 98 100 102 104 106 108 110 112
Rp
, b
n
Dom estic Car Sales ( thousand units) SMSM' revenue from dom estic (Rp, bn)
Source : GAI KI NDO, PT Selam at Sem purna Tbk , Pefindo Equit y & I ndex Valuat ion Division
W or ldw ide Ca r Pr odu ct ion a n d Sa le s Con t in u e t o Gr ow
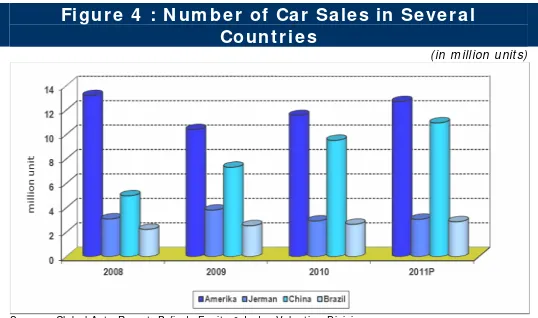
Worldwide car product ion in 2011 is expect ed t o r each 75 m illion unit s, out perfor m ed t he product ion in 2010 w hich only reached 71 m illion unit s. I ncreasing dem and from t he new pow erful econom y count ries, part icularly China, pushed m any car pr oducer s t o increase t heir product ion t o m eet dem and. The car sales volum e in China has increased by 16.2% YoY in January 2011, t o reach 1.53 m illion unit s. The sign of recovery also em erged in t he Am er ica’s car indust ry, as it s sales has incr eased by 17% YoY t o r eached 1.26 m illion cars in Januar y 2011, above average of m ont hly car sales volum e in 2010 w hich only r eached 1.23 m illion unit s.
This posit ive gr ow t h also im pact ing on SMSM’s rev enue fr om t heir expor t ed product s, as it r ise t o Rp 312.2 billion dur ing 1Q11 higher by 13.8% YoY com par ed t o t he 1Q10 per iod w hich only r eached Rp 274.4 billion.
Figu r e 4 : N u m be r of Ca r Sa le s in Se ve r a l
Cou n t r ie s
( in m illion unit s)
“ Disclaim er st at em ent in t he last page is an int egral part of t his report ” w ww .pefindo.com
Sw e lle d of D om e st ic H e a vy Equ ipm e n t I n du st r y I n lin e w it h t h e Gr ow t h of D om e st ic M in in g I n du st r y
As t he I ndonesian m ining indust ry , par t icularly coal, im proving, t he requirem ent for heavy equipm ent needed for product ion and ex plorat ion act ivit ies also im proving. Dur ing t he 1Q11, t he t ot al sales volum e of heavy equipm ent vehicles, part icularly Kom at su, has r eached 2,207 unit s, r ise by 81% YoY com par ed t o t he sam e per iod in 2010 w hich only r eached 1,219 unit s. We believe t hat t his gr ow t h w ill light en t he pr ospect of SMSM, part icularly PJM – it s subsidiary, since PJM is focusing on t he product ion of filt er s used for heavy equipm ent v ehicles.
Figu r e 5 : Sa le s V olu m e of Kom a t su
( in unit s)
Source : PT Unit ed Tract ors Tbk , Pefindo Equit y & I ndex Valuat ion Division
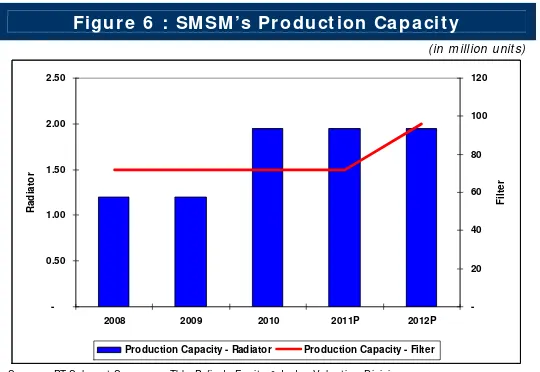
Ex pa n din g Pr odu ct ion Ca pa cit y t o M e e t D e m a n d
As dom est ic and w orldw ide cars and heav y equipm ent cont inue t o show an im provem ent , SMSM’s plans t o expand it s product ion capacit y, part icular ly on t he filt er product ion, unt il it r eached ar ound 96 m illion unit s in 2012, or im pr ov ed by 33.3% fr om t he cur r ent capacit y of 72 m illion unit s. SMSM plans t o reach such product ion capacit y by w ay of replacing or rej uvenat ion of it s m achines. Wit h t his ex pansion w e ex pect ed t hat SMSM’s r evenue will im pr ove by 17% YoY in 2012.
Figu r e 6 : SM SM ’s Pr odu ct ion Ca pa cit y
( in m illion unit s)-0.50 1.00 1.50 2.00 2.50
2008 2009 2010 2011P 2012P
R
a
di
a
tor
-20 40 60 80 100 120
Fi
lt
e
r
Production Capacity - Radiator Production Capacity - Filter
Source : PT Selam at Sem purna Tbk, Pefindo Equit y & I ndex Valuat ion Division
1219
2207
0 500 1000 1500 2000 2500
1Q10 1Q11
Kom atsu Sale s
Sm a r t Ra w M a t e r ia ls M a n a ge m e n t M a de SM SM ’s Gr oss Pr ofit M a r gin Be t t e r
Revenue (Rp, bn) COGS (Rp, bn) SMSM's Gross Profit Margin (%)
Source : PT Selam at Sem purna Tbk, Pefindo Equit y & I ndex Valuat ion Division
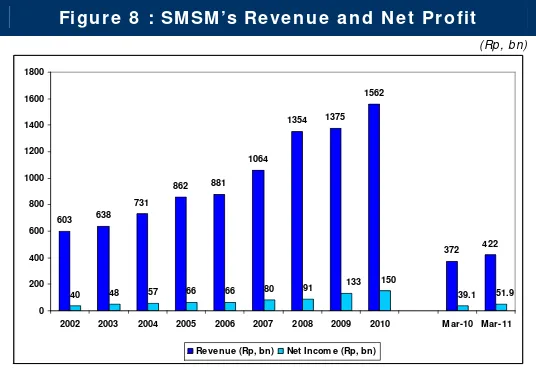
Con se cu t iv e Gr ow t h of Sa le s a n d N e t I n com e Pr ov e d SM SM ’s Pot e n cy
2002 2003 2004 2005 2006 2007 2008 2009 2010 Mar-10 Mar-11
Revenue (Rp, bn) Net Incom e (Rp, bn)
“ Disclaim er st at em ent in t he last page is an int egral part of t his report ” w ww .pefindo.com
Be t t e r Gr oss a n d Ope r a t in g Pr ofit M a r gin s Com pa r e d t o Ot h e r s
Com pared t o com pet it or t hat operat es in t he sam e indust ry, SMSM show ed a bet t er gross and operat ing profit m argin. I n 1Q11, SMSM st at e gross, operat ing and net m argins of 25.5% , 17.3% , and 11.3% , r espect ively, w hile for com pet it or , t he gr oss, operat ing and net m ar gins ar e 17.6% , 5.6% , and 14.2% , r espect ively. SMSM’s gross and operat ing profit m argins, which is bet t er from t he com pet it or, show ed SMSM abilit y t o generat e incom e from t heir m ain act ivit ies com bined w it h cost efficiency w hich t hen creat es bet t er m argins
.
Figu r e 9 : SM SM & Com pe t it or M a r gin s in 1 Q1 1
( in % )26%
18% 17%
6% 12%
14%
5% 4%
8%
6%
0% 5% 10% 15% 20% 25% 30%
SMSM AUTO
Gross profit m argin Operating profit m argin Net profit m argin ROA ROE
Source : PT Selam at Sem purna Tbk, Pefindo Equit y & I ndex Valuat ion Division
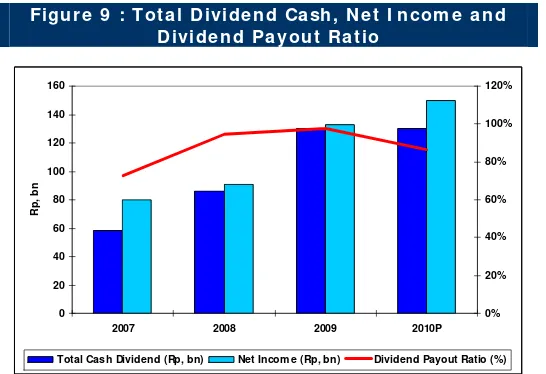
Con sist e n t ly Pr ovide D ivide n ds t o Sh a r e h olde r s
Dur ing 2007 – 2010 per iods, SMSM show ed consist ency of pr oviding cash dividends t o it s shareholders. I n 2007, SMSM paid int erim cash dividend of Rp 20/ shar e, and final cash dividend of Rp 20/ shar e, w hile in 2008 SMSM paid a final dividend of Rp 60/ shar e. I n 2009, t he t ot al am ount of cash dividend provided t o shar eholders is building up t o Rp 90/ share, w hich divided int o int erim cash div idend 1 ( Rp 40/ shar e) , int er im cash div idend 2 ( Rp 25/ shar e) , and final cash div idend ( Rp 25/ shar e) . I n 2010, SMSM alr eady pr ovide int er im cash div idend 1 and 2 t o it s shareholders, as m uch as Rp 40/ share ( int er im 1) and Rp 25/ share ( int er im 2) , and we are confidence t hat SMSM will also pr ovide a final cash dividend wit h m inim um of Rp 25/ shar e. This consist ent and building- up pay m ent of dividends is a good sign for SMSM’s long t erm invest ors, since t hey will acknow ledge t hat SMSM w ill cont inue t o pay div idend ev en in t he downt urn indust ry condit ion
.
Figu r e 9 : Tot a l D ivide n d Ca sh , N e t I n com e a n d
D ivide n d Pa you t Ra t io
0 20 40 60 80 100 120 140 160
2007 2008 2009 2010P
Rp
, b
n
0% 20% 40% 60% 80% 100% 120%
Total Cash Dividend (Rp, bn) Net Incom e (Rp, bn) Dividend Payout Ratio (%)
Con t in u e t o I m pr ove I t s Com pe t it ive Adva n t a ge s
To sust ain it s grow t h in t he fut ur e, SMSM cont inue t o im prove t heir com pet it ive advant ages in ev ery aspect . To prot ect it s product s, SMSM has increased t heir num ber of t radem ark regist rat ion in t heir export ed dest inat ion count r ies in order t o prot ect t heir product s from count erfeit ing. Cost Reduct ion Program t o m ake t heir pr oduct s com pet it ive and m aint ain t he availabilit y of it s product s on every count ries, are being done in order t o provide m or e added value t o cust om ers.
Re ce iv e d M a n y Aw a r ds in 2 0 1 0
I n 2010, as r esult s of t heir except ional w or ks, SMSM r eceived m any aw ar ds fr om var ious par t ies. I n January 2010, SMSM has been aw arded by PT Hino Mot ors Manufact uring I ndonesia for t heir qualit y t ar get achievem ent . I n Apr il 2010, SMSM r eceived t he Aut om ot ive Com ponent Manufact urer of t he Year Awar d from Frost & Sullivan, and t he lat est w as Appr eciat ion and Grat it ude for cont inuous support from PT Mit subishi Kram a Yudha Mot ors and Manufact uring.
Bu sin e ss Pr ospe ct s
Considering a 6% YoY expect ed grow t h of w orldw ide car product ion and also 6% YoY of expect ed grow t h in dom est ic car sales, t he prospect of an aut om ot ive part s indust r y, in w hich SMSM is one of t he pr oducer s, st ill looks prom ising. Augm ent ed w it h plans of incr easing product ion capacit y, w e believe t hat SMSM’s revenue w ill be up by 15.12% YoY in 2011 and 12.9% CAGR dur ing 2010 – 2015 per iods.
Figu r e 1 0 : SM SM ’s Re ve n u e
Source: PT Selam at Sem purna Tbk, Pefindo Equit y & I ndex Valuat ion Division
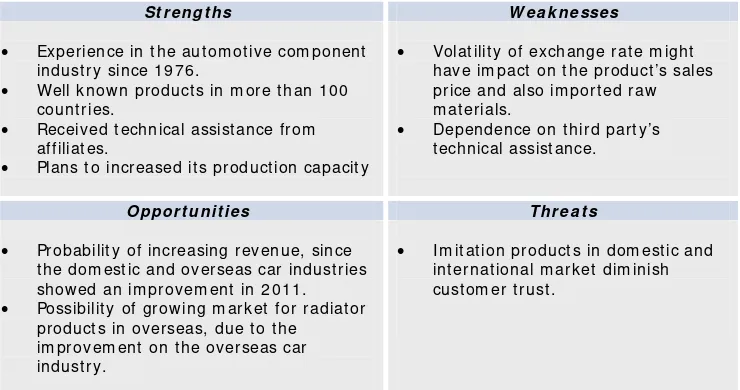
Ta ble 1 : SW OT An a ly sis
St r e n gt h s W e a k n e sse s
• Experience in t he aut om ot iv e com ponent indust r y since 1976.
• Well k now n pr oduct s in m ore t han 100 count ries.
• Received t echnical assist ance from affiliat es.
• Plans t o increased it s product ion capacit y
• Volat ilit y of exchange rat e m ight have im pact on t he product ’s sales price and also im port ed raw m at erials.
• Dependence on t hird part y’s t echnical assist ance.
Oppor t u n it ie s Th r e a t s
• Probabilit y of increasing revenue, since t he dom est ic and overseas car indust r ies show ed an im provem ent in 2011.
• Possibilit y of gr ow ing m arket for radiat or product s in overseas, due t o t he
im provem ent on t he overseas car indust ry .
• I m it at ion pr oduct s in dom est ic and int ernat ional m arket dim inish cust om er t rust .
SW OT AN ALYSI S
-500,000 1,000,000 1,500,000 2,000,000 2,500,000 3,000,000 3,500,000
2009 2010 2011P 2012P 2013P 2014P 2015P
Rp
, m
n
Revenue
“ Disclaim er st at em ent in t he last page is an int egral part of t his report ” w ww .pefindo.com
V ALUATI ON
• M e t h odology
We apply Discount ed Cash Flow ( DCF) m et hod as t he m ain valuat ion approach consider ing t he incom e grow t h is a value dr iver in SMSM inst ead of asset growt h.
Furt her m ore, w e also apply Guideline Com pany Met hod ( GCM) as com parison m et hod.
This valuat ion is based on 100% shar es pr ice as of Mar ch 31st, 2011.
• V a lu e Est im a t ion
Target pr ice for 12 m ont hs based on valuat ion as per Mar ch 31st, 2011 is as follow s:
Using DCF m et hod w it h discount r at e assum pt ion 10.31% , is Rp 1,380 - Rp 1,540 per shar e.
Using GCM m et hod ( PBV 3.02X and P/ E 10.84X) is Rp 1,300 – Rp 1,520 per share.
I n order t o obt ain a value w hich repr esent s bot h value indicat ions, w e have w eight ed bot h DCF and GCM m et hods by 70% : 30% .
Based on t he above calculat ion, t arget price of SMSM for 12 m ont h is Rp 1 ,3 4 0 - Rp 1 ,5 4 0 per share.
Ta ble 2 : D CF M e t h od
Con se r va t ive
M ode r a t e Aggr e ssive
PV of Free Cash Flow s – Rp bn 777.6 818.6 859.5
PV Ter m inal Value – Rp bn 1,442.4 1,518.4 1,594.3
Cash and Cash Equivalent , Rp bn 52.7 52.7 52.7
Net Debt – Rp bn ( 287.7) ( 287.7) ( 287.7)
Tot al Equit y Value – Rp bn 1,985.0 2,101.9 2,218.7
Num ber of Shar e, m n shar es 1,440 1,440 1,440
Fair Value per Share, Rp 1 ,3 8 0 1 ,4 6 0 1 ,5 4 0
Source: Pefindo Equit y & I ndex Valuat ion Division Est im at es
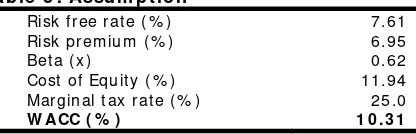
Ta ble 3 : Assu m pt ion
Risk free rat e ( % ) 7.61
Risk prem ium ( % ) 6.95
Bet a ( x) 0.62
Cost of Equit y ( % ) 11.94 Marginal t ax rat e ( % ) 25.0
W ACC ( % ) 1 0 .3 1
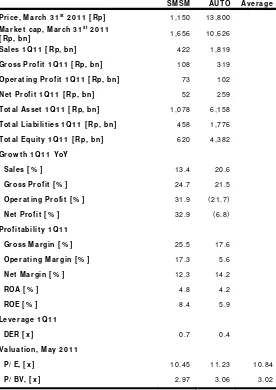
Ta ble 4 : GCM Com pa r ison
SM SM AUTO Ave r a ge
Pr ice , M a r ch 3 1st
2 0 1 1 [ Rp] 1,150 13,800
M a r k e t ca p, M a r ch 3 1st
2 0 1 1
[ Rp, bn] 1,656 10,626
Sa le s 1 Q1 1 [ Rp, bn ] 422 1,819
Gr oss Pr ofit 1 Q1 1 [ Rp, bn] 108 319
Ope r a t in g Pr ofit 1 Q1 1 [ Rp, bn] 73 102
N e t Pr ofit 1 Q1 1 [ Rp, bn] 52 259
Tot a l Asse t 1 Q1 1 [ Rp, bn] 1,078 6,158
Tot a l Lia bilit ie s 1 Q1 1 [ Rp, bn] 458 1,776
Tot a l Equ it y 1 Q1 1 [ Rp, bn] 620 4,382
Gr ow t h 1 Q1 1 YoY
Sa le s [ % ] 13.4 20.6
Gr oss Pr ofit [ % ] 24.7 21.5
Ope r a t in g Pr ofit [ % ] 31.9 ( 21.7)
N e t Pr ofit [ % ] 32.9 ( 6.8)
Pr ofit a bilit y 1 Q1 1
Gr oss M a r gin [ % ] 25.5 17.6
Ope r a t in g M a r gin [ % ] 17.3 5.6
N e t M a r gin [ % ] 12.3 14.2
ROA [ % ] 4.8 4.2
ROE [ % ] 8.4 5.9
Le ve r a ge 1 Q1 1
D ER [ x ] 0.7 0.4
Va lu a t ion , M a y 2 0 1 1
P/ E, [ x ] 10.45 11.23 10.84
P/ BV, [ x ] 2.97 3.06 3.02
“ Disclaim er st at em ent in t he last page
Source: PT Selam at Sem purna Tbk., Pefindo Equit y & I ndex Valuat ion Division Est im at es
( Rp bn)
Source: PT Selam at Sem purna Tbk., Pefindo Equit y & I ndex Valuat ion Division Est im at es
P/E & P/BV
D I SCLAI M ER
Th i s r e p o r t w a s p r e p a r e d b a se d o n t h e t r u st e d a n d r e l i a b l e so u r ce s. Ne v e r t h e l e ss, w e d o n o t g u a r a n t e e i t s co m p l e t e n e ss, a ccu r a cy a n d a d e q u a cy . Th e r e f o r e w e d o n o t r e sp o n si b l e o f a n y i n v e st m e n t d e ci si o n m a k i n g b a se d o n t h i s r e p o r t . As f o r a n y a ssu m p t i o n s, o p i n i o n s a n d p r e d i ct i o n s w e r e so l e l y o u r i n t e r n a l j u d g m e n t s a s p e r r e p o r t i n g d a t e , a n d t h o se j u d g m e n t s a r e su b j e ct t o ch a n g e w i t h o u t f u r t h e r n o t i ce .
W e d o n o t r e sp o n si b l e f o r m i st a k e a n d n e g l i g e n ce o ccu r r e d b y u si n g t h i s r e p o r t . La st p e r f o r m a n ce co u l d n o t a l w a y s b e u se d a s r e f e r e n ce f o r f u t u r e o u t co m e . Th i s r e p o r t i s n o t a n o f f e r i n g r e co m m e n d a t i o n , p u r ch a se o r h o l d s p a r t i cu l a r sh a r e s. Th i s r e p o r t m i g h t n o t b e su i t a b l e f o r so m e i n v e st o r s. Al l o p i n i o n i n t h i s r e p o r t h a s b e e n p r e se n t e d f a i r l y a s p e r i ssu i n g d a t e w i t h g o o d i n t e n t i o n s; h o w e v e r i t co u l d b e ch a n g e a t a n y t i m e w i t h o u t f u r t h e r n o t i ce . Th e p r i ce , v a l u e o r i n co m e f r o m e a ch sh a r e o f t h e Co m p a n y st a t e d i n t h i s r e p o r t m i g h t l o w e r t h a n t h e i n v e st o r e x p e ct a t i o n a n d i n v e st o r m i g h t o b t a i n l o w e r r e t u r n t h a n t h e i n v e st e d a m o u n t . I n v e st m e n t i s d e f i n e d a s t h e p r o b a b l e i n co m e t h a t w i l l b e r e ce i v e d i n t h e f u t u r e ; n o n e t h e l e ss su ch r e t u r n m a y p o ssi b l y f l u ct u a t e . As f o r t h e Co m p a n y w h i ch i t s sh a r e i s d e n o m i n a t e d o t h e r t h a n Ru p i a h , t h e f o r e i g n e x ch a n g e f l u ct u a t i o n m a y r e d u ce t h e v a l u e , p r i ce o r i n v e st o r i n v e st m e n t r e t u r n . Th i s r e p o r t d o e s n o t co n t a i n a n y i n f o r m a t i o n f o r t a x co n si d e r a t i o n i n i n v e st m e n t d e ci si o n m a k i n g .
Th e sh a r e p r i ce t a r g e t i n t h i s r e p o r t i s a f u n d a m e n t a l v a l u e , n o t a f a i r m a r k e t v a l u e n o r a t r a n sa ct i o n p r i ce r e f e r e n ce r e q u i r e d b y t h e r e g u l a t i o n s.
Th e sh a r e p r i ce t a r g e t i ssu e d b y Pe f i n d o Eq u i t y & I n d e x Va l u a t i o n D i v i si o n i s n o t a r e co m m e n d a t i o n t o b u y , se l l o r h o l d p a r t i cu l a r sh a r e s a n d i t co u l d n o t b e co n si d e r e d a s a n i n v e st m e n t a d v i ce f r o m Pe f i n d o Eq u i t y & I n d e x Va l u a t i o n D i v i si o n a s i t s sco p e o f se r v i ce t o , o r i n r e l a t i o n t o so m e p a r t i e s, i n cl u d i n g l i st e d co m p a n i e s, f i n a n ci a l a d v i so r , b r o k e r , i n v e st m e n t b a n k , f i n a n ci a l i n st i t u t i o n a n d i n t e r m e d i a r y , i n co r r e l a t i o n w i t h r e ce i v i n g r e w a r d s o r a n y o t h e r b e n e f i t s f r o m t h a t p a r t i e s.
Th i s r e p o r t i s n o t i n t e n d e d f o r p a r t i cu l a r i n v e st o r a n d ca n n o t b e u se d a s p a r t o f i n v e st m e n t o b j e ct i v e o n p a r t i cu l a r sh a r e s a n d n e i t h e r a n i n v e st m e n t r e co m m en d a t i o n o n p a r t i cu l a r sh a r e s o r a n i n v e st m e n t st r a t e g y . W e st r o n g l y r e co m m e n d e d i n v e st o r t o co n si d e r t h e su i t a b l e si t u a t i o n a n d co n d i t i o n a t f i r st b e f o r e m a k i n g d e ci si o n i n r e l a t i o n w i t h t h e f i g u r e i n t h i s r e p o r t . I f i t i s n e ce ssa r y , k i n d l y co n t a ct y o u r f i n a n ci a l a d v i so r .
PEFI ND O k e e p s t h e a ct i v i t i e s o f Eq u i t y Va l u a t i o n sep a r a t e f r o m Ra t i n g s t o p r e se r v e i n d e p e n d e n ce a n d o b j e ct i v i t y o f i t s a n a l y t i ca l p r o ce sse s a n d p r o d u ct s. PEFI ND O h a s e st a b l i sh e d p o l i ci e s a n d p r o ce d u r e s t o m a i n t a i n t h e co n f i d e n t i a l i t y o f ce r t a i n n o n - p u b l i c i n f o r m a t i o n r e ce i v e d i n co n n e ct i o n w i t h e a ch a n a l y t i ca l p r o ce ss. Th e e n t i r e p r o ce ss, m e t h o d o l o g y a n d t h e d a t a b a se u se d i n t h e p r e p a r a t i o n o f t h e Re f e r e n ce Sh a r e Pr i ce Ta r g e t Re p o r t a s a w h o l e i s d i f f e r e n t f r o m t h e p r o ce sse s, m e t h o d o l o g i e s a n d d a t a b a se s u se d PEFI ND O i n d o i n g t h e r a t i n g .
This report w as prepared and com posed by Pe f i n d o Eq u i t y & I n d e x Va l u a t i o n D i v i si o n wit h t he obj ect ive t o enhance shares price t ransparency of list ed com panies in I ndonesia St ock Exchange ( I DX) . This report is also free of ot her par t y’s influence, pr essure or force eit her from I DX or t he list ed com pany which review ed by Pe f i n d o Eq u i t y & I n d e x Va l u a t i o n D i v i si o n . Pe f i n d o Eq u i t y & I n d e x Va l u a t i o n Division w ill earn r ew ard am ount ing t o Rp 20 m n each from I DX and t he review ed com pany for issuing r eport t w ice per year. For fur t her infor m at ion, please visit our w ebsit e at h t t p : / / w w w . p e f i n d o . co m