com ponent producer t hat est ablished in 1976. SMSM’s core business consist s of m anufact uring aut om ot ive radiat or and filt er under t he brand nam e of ADR and SAKURA, respect ively, or under ot her privat e brand nam e. Nowadays, SMSM’s capacit y of product ion of filt er and radiat or product s have reached 72 m illion and 1.95 m illion unit s per year, respect ively, and has been used in over 100 count ries. Nowadays, SMSM’s radiat or product s m ost ly used for Original Equipm ent Manufact uring ( “ OEM” ) part s, while filt er product s m ost ly used for aft er sales cars.
Ta r ge t Pr ice Adj u st m e n t
We m aint ain our opinion t hat SMSM’s share is st ill undervalue, based on t he following considerat ions:
Conducive m acroeconom ic condit ion during 1H10, as shown by
t he increased of Gross Dom est ic Product ( “ GDP” ) as m uch as 6.2% YoY and 2.8% QoQ. This increased can be int erpret ed as an increased of I ndonesian people pur chasing power which at t he end w ill effect t heir abilit y t o m aint ain t heir cars condit ion by purchasing m ore aut om ot ive product s, such as SMSM’s product s.
Sales of car in I ndonesia during 1H10 reached 369,367 unit s,
significant ly increased by 75.7% YoY com pared t o 1H09 which only reached 210.246 unit s. This phenom ena is m ost ly caused by t he post poned of increased in vehicle t ax and change of car ownerships nam e t ariff by t he local governm ent of DKI Jakart a.
Num ber of car sales in Am erica showed a sign of recovery
since 3Q09, wit h a sharp growt h of 19.53% QoQ, or reach 34.82 unit s. Alt hough ever experience a drop of m inus 6.92% QoQ during 4Q09, t he volum e of car sales in 1Q10 and 2Q10 im proved by 1.85% QoQ and 3.24% QoQ, respect ively.
The issuance Rp 240 bn new bond by SMSM in July 2010 t o
replace it s bank loan, will decrease SMSM’s int erest expense.
Risk free rat e, equit y prem ium , and bet a assum pt ion are
9.1% , 4.5% , and 0.54X respect ively wit h no specific risk.
Bu sin e ss Pr ospe ct s
I ncreased of I ndonesian people purchasing power, and num ber of car sales in 1H10 in I ndonesia and Am erica, boost SMSM’s revenue as it t ranslat e in 20.27% YoY growt h of sales during 1H10. Along wit h cost efficiency m anagem ent , we est im at e SMSM’s sales will raise 21.36% YoY t o Rp 1,668.3 bn in 2010 and grow 13.43% CAGR in 2009 – 2014, accom panied wit h a 23.7% of net incom e growt h in 2010 t o r each Rp 164.3 bn and 13.18% CAGR growt h during 2009 – 2014 period.
2 0 0 7 2 0 0 8 2 0 0 9 2 0 1 0 P 2 0 1 1 P
During 2Q10 t he I ndonesian econom y m anaged a respect able perform ance, as m easured wit h Gross Dom est ic Product ( “ GDP” ) has grown 2.8% QoQ, or 6.2% YoY. At t he sam e t im e, inflat ion during January 2009 unt il June 2010 period has significant ly dropped from 9.17% t o j ust 5.05% , respect ively. These t win achievem ent s paved t he way for Rupiah appreciat ion during 1H10. Using Bank I ndonesia ( “ BI ” ) m iddle exchange rat e as a reference, Rupiah has appreciat e from Rp 9,400 / USD 1 on Decem ber 2009, t o Rp 9,083 / USD 1 on June 2010. Wit h t his increased of GDP, t he I ndonesian people purchasing power also im proved, which at t he end will effect t heir abilit y t o m aint ain t heir cars by buying aut om ot ive part s, such as SMSM’s product s.
Figu r e 1 : BI ’s M iddle Ex ch a n ge Ra t e
Source: Bank of I ndonesia, Pefindo Equit y & I ndex Valuat in Division
9083 Part ners, an I nt ernat ional Research Com pany, in t heir publicat ion on June 14, 2010. As said in t his report , new car sales in China will reach 20 m illion in t he next five years, t wo t im es from t he 2007 volum e. I n t he Nort h Am erica t he new car sales is proj ect ed t o increase by 12% in 2010.
I n Am erica, t he num ber of car sales in 2Q10 reached 34.08 m illion unit s or im proved by 3.24% QoQ com pared t o 1Q10 which only reached 33.01 m illion unit s. This im provem ent of sales can be ident ified as a sign of “ rebound” aft er financial crisis t hat st rike Am erica during 1Q08 – 2Q09, as reflect ed by significant drop of num ber of car sales from 46.05 m illion unit in 1Q08 t o j ust 29.13 m illion
Source: Bloom berg, Pefindo Equit y & I ndex Valuat ion Division
BI Mid-Rate
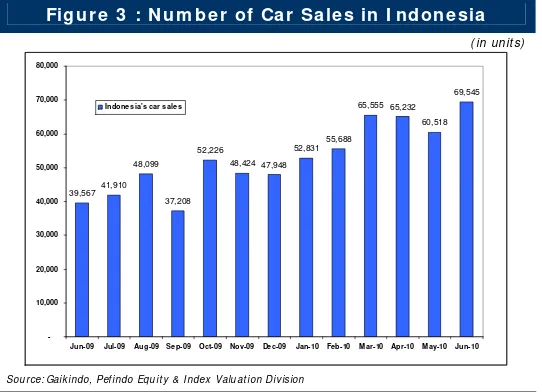
Le a de r in Te r m s of N u m be r of Ca r Sa le s in ASEAN
I ndonesia successfully beat s Thailand for t he first t im e aft er t hree decades in t he num ber of car sales during 1H10. Based on t he dat a from Asean Aut om ot ive Federat ion ( “ AAF” ) , t he t ot al of num ber car sales in I ndonesia during January – May 2010 period has reached 299,824 unit s, while Thailand only m anaged t o sell around 286,135 unit s. I n June 2010, dom est ic car sales reached 69,545 unit s, overcom e t his year m ont hly record of 65,555 unit s in March 2010, due t o t he high dem and in facing Ram adhan and Lebaran period. As a result t he t ot al of car sales in I ndonesia during 1H10 reached 369,367 unit s, significant ly increased by 75.7% com pared t o 1H09 which only reached 210.246 unit s. This phenom ena is also caused by t he post poned of increased in vehicle t ax and change of car ownerships nam e t ariff by t he local governm ent of DKI Jakart a.
Jun-09 Jul-09 Aug-09Sep-09 Oct-09 Nov-09 Dec-09 Jan-10 Feb-10 Mar-10 Apr-10May-10 Jun-10 Indonesia's car sales
Source: Gaikindo, Pefindo Equit y & I ndex Valuat ion Division
Cost Efficie n cy rat e t han t he ret ired loan, but considered m any m acroeconom ic indicat ors, such as inflat ion, t hat expect ed t o risen in t he fut ure, t his new bond issuance will provide a bet t er int erest expense for SMSM in t he fut ure. SMSM also has an opt ion t o call t his new bond, one year aft er t he issuance, which will provide m ore benefit t o SMSM.
SM SM Bu sin e ss Pr ospe ct s
Figu r e 4 : SM SM ’s Sa le s
( I n Rp bn)
Source: PT Selam at Sem purnaTbk. Pefindo Equit y & I ndex Valuat ion Division Est im at es
2,004
1,668
1,375 1,354
1,064
881
-500 1,000 1,500 2,000 2,500
2006 2007 2008 2009 2010 2011
TARGET PRI CE
V ALUATI ON
• M e t h odology
We apply Discount ed Cash Flow ( DCF) m et hod as t he m ain valuat ion
approach considering t he incom e growt h is a value driver in SMSM inst ead of asset growt h.
Furt herm ore, we also apply Guideline Com pany Met hod ( GCM) as com parison
m et hod.
This valuat ion is based on 100% shares price as of June 30t h , 2010.
• V a lu e Est im a t ion
Target price for 12 m ont hs based on valuat ion as per June 30t h, 2010 is as
follows:
Using DCF m et hod wit h discount rat e assum pt ion 10.48% , is
Rp 1,710 - Rp 1,910 per share.
Using GCM m et hod ( PBV 3.59X and P/ E 12.45X) is Rp 1,330 –
Rp 1,420 per share.
I n order t o obt ain a value w hich represent s bot h value indicat ions, w e have weight ed bot h DCF and GCM m et hods by 70% : 30% .
Based on t he above calculat ion, t arget price of SMSM for 12 m ont h is Rp 1 ,6 0 0 - Rp 1 ,7 6 0 per share.
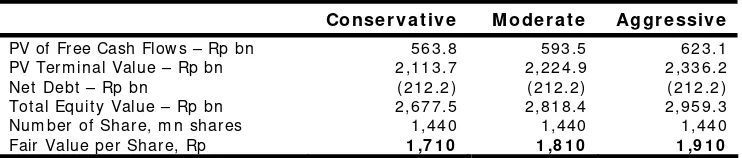
Ta ble 1 : D CF M e t h od
Con se r va t ive M ode r a t e Aggr e ssive
PV of Free Cash Flow s – Rp bn 563.8 593.5 623.1 PV Ter m inal Value – Rp bn 2,113.7 2,224.9 2,336.2 Net Debt – Rp bn ( 212.2) ( 212.2) ( 212.2) Tot al Equit y Value – Rp bn 2,677.5 2,818.4 2,959.3 Num ber of Share, m n shares 1,440 1,440 1,440 Fair Value per Share, Rp 1 ,7 1 0 1 ,8 1 0 1 ,9 1 0
Source: Pefindo Equit y & I ndex Valuat ion Division Est im at es
Ta ble 2 : Assu m pt ion
Risk free rat e ( % ) 9.1 Risk prem ium ( % ) 4.5
Bet a ( x) 0.5
Cost of Equit y ( % ) 11,5 Marginal t ax rat e ( % ) 25.0
W ACC ( % ) 1 0 .4 8
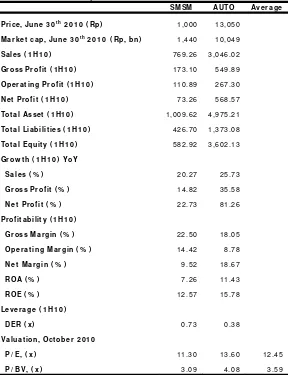
Ta ble 3 : GCM Com pa r ison
SM SM AUTO Ave r a ge
Pr ice , Ju n e 3 0t h
2 0 1 0 ( Rp) 1,000 13,050
M a r k e t ca p, Jun e 3 0t h
2 0 1 0 ( Rp, bn ) 1,440 10,049
Sa le s ( 1 H 1 0 ) 769.26 3,046.02
Gr oss Pr ofit ( 1 H 1 0 ) 173.10 549.89
Ope r a t in g Pr ofit ( 1 H 1 0 ) 110.89 267.30
N e t Pr ofit ( 1 H 1 0 ) 73.26 568.57
Tot a l Asse t ( 1 H 1 0 ) 1,009.62 4,975.21
Tot a l Lia bilit ie s ( 1 H 1 0 ) 426.70 1,373.08
Tot a l Equ it y ( 1 H 1 0 ) 582.92 3,602.13
Gr ow t h ( 1 H 1 0 ) YoY
Sa le s ( % ) 20.27 25.73
Gr oss Pr ofit ( % ) 14.82 35.58
N e t Pr ofit ( % ) 22.73 81.26
Pr ofit a bilit y ( 1 H 1 0 )
Gr oss M a r gin ( % ) 22.50 18.05
Ope r a t in g M a r gin ( % ) 14.42 8.78
N e t M a r gin ( % ) 9.52 18.67
ROA ( % ) 7.26 11.43
ROE ( % ) 12.57 15.78
Le ve r a ge ( 1 H 1 0 )
D ER ( x ) 0.73 0.38
Va lu a t ion , Oct obe r 2 0 1 0
P/ E, ( x ) 11.30 13.60 12.45
P/ BV , ( x ) 3.09 4.08 3.59
( Rp bn)
I n com e St a t e m e nt 2 0 0 7 2 0 0 8 2 0 0 9 2 0 1 0 P 2 0 1 1 P
Sales 1,064.1 1,353.6 1,374.7 1,668.3 2,004.3 COGS ( 820.3) ( 1,024.8) ( 1,058.4) ( 1,270.5) ( 1,530.5)
Gr oss Pr ofit 2 4 3 .8 3 2 8 .8 3 1 6 .3 3 9 7 .8 4 7 3 .8
Operat ing Ex pense ( 93.8) ( 115.8) ( 126.5) ( 139.0) ( 161.7)
Ope r a t in g Pr ofit 1 5 0 .0 2 1 2 .9 1 8 9 .8 2 5 8 .8 3 1 2 .1
Ot her I ncom e ( Charges) ( 19.4) ( 69.3) ( 3.9) ( 16.7) ( 22.2)
Pr e - t a x Pr ofit 1 3 0 .6 1 4 3 .6 1 8 5 .9 2 4 2 .1 2 8 9 .9
Tax ( 42.1) ( 42.1) ( 42.9) ( 60.5) ( 72.5)
M in or it y I n t e r e st ( 8.2) ( 10.0) ( 10.1) ( 17.2) ( 20.7)
N e t Pr ofit 8 0 .3 9 1 .5 1 3 2 .9 1 6 4 .3 1 9 6 .8
Source: PT Selam at Sem purna Tbk., Pefindo Equit y & I ndex Valuat ion Division Est im at es
Ra t io 2 0 0 7 2 0 0 8 2 0 0 9 2 0 1 0 P 2 0 1 1 P
Gr ow t h ( % )
Sales 20.8 27.2 1.6 21.4 20.1
Operat ing Profit 29.9 41.9 ( 10.9) 36.4 20.6
EBI TDA 68.6 38.0 ( 0.6) 28.9 15.5
Net Profit 21.7 14.3 44.2 23.7 19.7
Pr ofit a bilit y ( % )
Gross Margin 22.9 24.3 23.0 23.9 23.6
Operat ing Margin 14.1 15.7 13.8 15.5 15.6 EBI TDA Margin 18.5 20.1 19.6 20.8 20.0
Net Margin 7.5 6.8 9.6 9.9 9.8
ROA 9.7 9.8 14.1 14.9 16.9
ROE 16.7 16.7 26.7 28.7 28.5
Solva bilit y ( X)
Debt t o Equit y 0.7 0.6 0.8 0.9 0.6
Debt t o Asset 0.4 0.4 0.4 0.4 0.4
Liqu idit y ( X)
Current Rat io 1.7 1.8 1.6 1.7 2.2
Quick Rat io 0.8 0.8 0.8 1.0 1.2
Source: PT Selam at Sem purna Tbk., Pefindo Equit y & I ndex Valuat ion Division Est im at es
( Rp bn)
Ba la n ce Sh e e t 2 0 0 7 2 0 0 8 2 0 0 9 2 0 1 0 P 2 0 1 1 P
Asse t s
Cu r r e n t Asse t s
Cash and cash
equivalent s 8.9 13.6 8.7 81.3 37.8
Receivables 207.9 244.4 279.1 361.8 434.6 I nvent ory 245.1 286.4 254.9 295.9 356.4 Ot her Asset s 13.0 10.8 32.2 32.2 32.2
Tot a l Cu r r e n t Asse t s 4 7 4 .9 5 5 5 .2 5 7 4 .9 7 7 1 .2 8 6 1 .0
Fixed Asset s 318.7 358.5 341.4 308.5 275.0 Ot her Asset s 36.5 16.0 25.4 25.2 25.2
Tot a l Asse t s 8 3 0 .0 9 2 9 .8 9 4 1 .7 1 ,1 0 5 .0 1 ,1 6 1 .3
Lia bilit ie s
Trade payables 52.7 51.3 128.2 97.5 115.7 Short - t erm loan 180.0 189.8 163.7 256.9 176.9 Ot her Short - t erm
payables 45.2 64.2 70.3 96.2 96.2
Long- t erm Liabilit ies 37.8 35.9 35.1 36.2 36.2
Tot a l Lia bilit ie s 3 1 5 .6 3 4 1 .3 3 9 7 .4 4 8 6 .8 4 2 5 .0
M in or it y I n t e r e st 3 2 .3 4 2 .2 4 6 .4 4 6 .4 4 6 .4
Tot a l Equ it y 4 8 2 .2 5 4 6 .2 4 9 7 .8 5 7 1 .8 6 8 9 .8
D I SCLAI M ER
Th i s r ep o r t w a s p r e p a r e d b a se d o n t h e t r u st e d a n d r e l i a b l e so u r ce s. Ne v e r t h e l e ss, w e d o n o t g u a r a n t e e i t s co m p l e t en e ss, a ccu r a cy a n d a d e q u a cy . Th er ef o r e w e d o n o t r e sp o n si b l e o f a n y i n v e st m e n t d e ci si o n m a k i n g b a se d o n t h i s r e p o r t . As f o r a n y a ssu m p t i o n s, o p i n i o n s a n d p r ed i ct i o n s w er e so l e l y o u r i n t er n a l j u d g m e n t s a s p er r ep o r t i n g d a t e , a n d t h o se j u d g m en t s a r e su b j e ct t o ch a n g e w i t h o u t f u r t h e r n o t i ce .
W e d o n o t r e sp o n si b l e f o r m i st a k e a n d n eg l i g e n ce o ccu r r ed b y u si n g t h i s r e p o r t . La st p e r f o r m a n ce co u l d n o t a l w a y s b e u se d a s r ef er en ce f o r f u t u r e o u t co m e . Th i s r e p o r t i s n o t a n o f f er i n g r e co m m en d a t i o n , p u r ch a se o r h o l d s p a r t i cu l a r sh a r e s. Th i s r ep o r t m i g h t n o t b e su i t a b l e f o r so m e i n v e st o r s. Al l o p i n i o n i n t h i s r ep o r t h a s b e en p r e sen t ed f a i r l y a s p er i ssu i n g d a t e w i t h g o o d i n t en t i o n s; h o w ev er i t co u l d b e ch a n g e a t a n y t i m e w i t h o u t f u r t h e r n o t i ce . Th e p r i ce , v a l u e o r i n co m e f r o m e a ch sh a r e o f t h e Co m p a n y st a t e d i n t h i s r ep o r t m i g h t l o w er t h a n t h e i n v e st o r ex p e ct a t i o n a n d i n v e st o r m i g h t o b t a i n l o w e r r et u r n t h a n t h e i n v est ed a m o u n t . I n v e st m en t i s d ef i n e d a s t h e p r o b a b l e i n co m e t h a t w i l l b e r e ce i v e d i n t h e f u t u r e ; n o n e t h e l e ss su ch r e t u r n m a y p o ssi b l y f l u ct u a t e . As f o r t h e Co m p a n y w h i ch i t s sh a r e i s d e n o m i n a t e d o t h e r t h a n Ru p i a h , t h e f o r e i g n ex ch a n g e f l u ct u a t i o n m a y r e d u ce t h e v a l u e , p r i ce o r i n v est o r i n v est m e n t r e t u r n . Th i s r e p o r t d o e s n o t co n t a i n a n y i n f o r m a t i o n f o r t a x co n si d er a t i o n i n i n v est m e n t d e ci si o n m a k i n g .
Th e sh a r e p r i ce t a r g et i n t h i s r ep o r t i s a f u n d a m e n t a l v a l u e , n o t a f a i r m a r k e t v a l u e n o r a t r a n sa ct i o n p r i ce r ef er e n ce r e q u i r ed b y t h e r eg u l a t i o n s.
Th e sh a r e p r i ce t a r g e t i ssu e d b y Pef i n d o Eq u i t y & I n d e x Va l u a t i o n D i v i si o n i s n o t a r e co m m en d a t i o n t o b u y , se l l o r h o l d p a r t i cu l a r sh a r e s a n d i t co u l d n o t b e co n si d er ed a s a n i n v e st m e n t a d v i ce f r o m Pef i n d o Eq u i t y & I n d ex Va l u a t i o n D i v i si o n a s i t s sco p e o f se r v i ce t o , o r i n r el a t i o n t o so m e p a r t i e s, i n cl u d i n g l i st ed co m p a n i e s, f i n a n ci a l a d v i so r , b r o k e r , i n v e st m e n t b a n k , f i n a n ci a l i n st i t u t i o n a n d i n t er m e d i a r y , i n co r r e l a t i o n w i t h r ece i v i n g r e w a r d s o r a n y o t h er b e n ef i t s f r o m t h a t p a r t i e s.
Th i s r ep o r t i s n o t i n t e n d e d f o r p a r t i cu l a r i n v e st o r a n d ca n n o t b e u se d a s p a r t o f i n v e st m e n t o b j e ct i v e o n p a r t i cu l a r sh a r e s a n d n e i t h er a n i n v e st m e n t r e co m m en d a t i o n o n p a r t i cu l a r sh a r e s o r a n i n v e st m e n t st r a t eg y . W e st r o n g l y r e co m m en d ed i n v e st o r t o co n si d er t h e su i t a b l e si t u a t i o n a n d co n d i t i o n a t f i r st b ef o r e m a k i n g d e ci si o n i n r e l a t i o n w i t h t h e f i g u r e i n t h i s r e p o r t . I f i t i s n e ce ssa r y , k i n d l y co n t a ct y o u r f i n a n ci a l a d v i so r .
PEFI ND O k e e p s t h e a ct i v i t i es o f Eq u i t y Va l u a t i o n sep a r a t e f r o m Ra t i n g s t o p r e se r v e i n d e p e n d e n ce a n d o b j ect i v i t y o f i t s a n a l y t i ca l p r o ce sse s a n d p r o d u ct s. PEFI ND O h a s e st a b l i sh ed p o l i ci es a n d p r o ce d u r e s t o m a i n t a i n t h e co n f i d e n t i a l i t y o f cer t a i n n o n - p u b l i c i n f o r m a t i o n r e ce i v e d i n co n n e ct i o n w i t h ea ch a n a l y t i ca l p r o ce ss. Th e en t i r e p r o ce ss, m e t h o d o l o g y a n d t h e d a t a b a se u se d i n t h e p r e p a r a t i o n o f t h e Re f er en ce Sh a r e Pr i ce Ta r g e t Rep o r t a s a w h o l e i s d i f f e r e n t f r o m t h e p r o ce sse s, m e t h o d o l o g i es a n d d a t a b a se s u se d PEFI ND O i n d o i n g t h e r a t i n g .
This report w as prepared and com posed by Pef i n d o Eq u i t y & I n d e x Va l u a t i o n D i v i si o n wit h t he obj ect ive t o enhance shares price t ransparency of list ed com panies in I ndonesia St ock Exchange ( I DX) . This report is also free of ot her par t y’s influence, pr essure or force eit her from I DX or t he list ed com pany which review ed by Pe f i n d o Eq u i t y & I n d e x Va l u a t i o n D i v i si o n . Pe f i n d o Eq u i t y & I n d e x Va l u a t i o n Division w ill earn r eward am ount ing t o Rp 20 m n each from I DX and t he reviewed com pany for issuing r eport t wice per year. For fur t her infor m at ion, please visit our websit e at h t t p : / / w w w . p e f i n d o . co m