Contact:
Equity & Index Valuation Division Phone: (6221) 7278 2380
“Disclaimer statement in the last page is an integral part of this report”
“Disclaimer statement in the last page is an integral part of this report” www.pefindo.com
Selamat Sempurna, Tbk
th
Target Price Adjustment
We make several adjustments to our previous projections, and adjust our Target Price to a range of Rp 1,820 - Rp 1,990 per share, based on the following considerations:
SMSM’s performance in 9M11 is in line with our projections in previous report published in May 13th, 2011. We estimate SMSM’s sales and net profit in 2011 are Rp 1.79 trillion and Rp 202 billion respectively or higher 14.7% and 33.8% than 2010’s result.
SMSM has added its production capacity, from previously 1.2 million pcs per year to 1.95 million pcs per year for radiators product (up by 62.5%), and from previously 72 million pcs per year to 96 million pcs per year or for filters product (up by 33.3%). The larger capacity of SMSM’s production facilities would be an important capital to support SMSM to make market expansion and to grow its business in the few years to come.
SMSM has signed new technical assistance and license agreement with Tokyo Roki Co., Ltd., a Japanese company which produces particular types of filter and other automotive components. With this agreement it is expected to further increase SMSM’ s business strength by providing added value that will support SMSM’s future growth opportunity.
Indonesia’s economy fundamental will remain strong despite expected effect of current global crisis. Therefore we estimate that Indonesia’s economy growth will slightly down to 6.2% y-y in 2012, as in 9M11 it was recorded of 6.5%.
Global car sales in 2012 will reach 77.7 million cars and light trucks with expected growth would be 6.7%. It is predicted that car and light trucks sales in Europe in 2012 will remain around 19 million units; while in US, sales is expected to rise by 7.3% to 13.7 million units. It is also expected for the first time car sales in developing countries will surpass developed countries.
Domestic automotive market is predicted will remain fascinated in 2012 with estimated domestic car sales will reach 930 thousand units compared with car sales throughout 2011 reached 894 thousands units. Domestic market optimism driven by Indonesia’s economy encouraging development and also by the restoration automotive components and car units supply from Thailand and Japan. SMSM’s sales growth in 9M11 was 16.7% y-y, higher than sales growth in 2010 of 13.6% y-y. Sales expanded amid the pressures of global crisis. The increased in sales growth in 9M11 accompanied by improved profit margins driven by the increased in efficiency. SMSM was able to strike 2.2%-2.5% of increased in profit margins for 9M11 in the midst of the rising of raw materials prices throughout 2011. Considering SMSM’s capability in applying efficiency and higher production capacity they have now, we believe that at least SMSM will keeps to maintain their new level of profits margins in the upcoming years.
Risk free rate, equity premium, and beta assumption are 5.59%, 8.79%, and 0.81 respectively.
Business Prospects
Adequate production capacity until a few years in the future, technical support from various leading company in the world, strong of the markets and product brands, and capability in managing a qualified business; they all are SMSM’s strength and competitiveness in developing its business in the future. Global financial crisis will still affecting global economy development with majority countries would experience economic contraction, thus global car sales growth is estimated to grow moderately. However, in 2011 SMSM has proved its capability to have an outperformed sales growth despite in the midst of the crisis, and even their sales growths in developed countries were higher than Asia and domestic markets. In addition to outstanding their sales growth, SMSM was also able to apply better efficiency which led their profit margins are in a better rate than in previous years. Considering all the arguments, we believe SMSM has excellent prospects and will continue to maintain their outstanding performance, and we estimate SMSM’s sales will grow at 17.2% CAGR for periods 2011-2015.
“Disclaimer statement in the last page is an integral part of this report” www.pefindo.com
Selamat Sempurna, Tbk
th
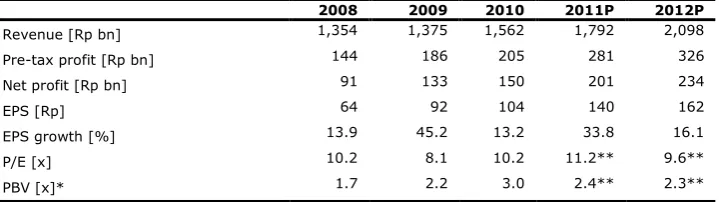
Table 1: Performance Summary
2008 2009 2010 2011P 2012P
Revenue [Rp bn] 1,354 1,375 1,562 1,792 2,098
Pre-tax profit [Rp bn] 144 186 205 281 326
Net profit [Rp bn] 91 133 150 201 234
EPS [Rp] 64 92 104 140 162
EPS growth [%] 13.9 45.2 13.2 33.8 16.1
P/E [x] 10.2 8.1 10.2 11.2** 9.6**
PBV [x]* 1.7 2.2 3.0 2.4** 2.3**
Source: PT Selamat Sempurna Tbk, Pefindo Equity & Index Valuation Division Estimates * Restated as refer to PSAK No. 22 (2010 revision)
“Disclaimer statement in the last page is an integral part of this report” www.pefindo.com
Selamat Sempurna, Tbk
th
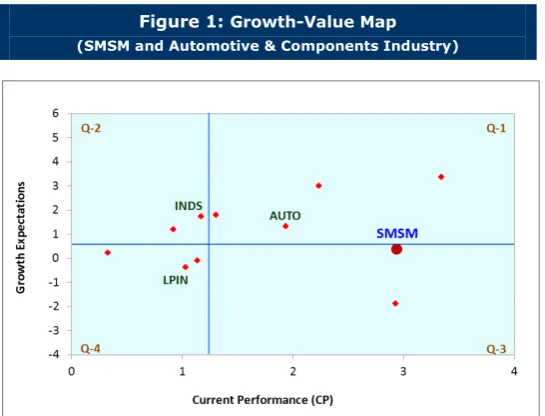
Growth-Value Map provides overview of market expectations for the companies listed on IDX. Current Performance (“CP”) metric, running along the horizontal axis, is a portion of current stock market value that can be linked to the perpetuity of current company’s performance in profitability. Growth Expectations (“GE”) metric, plotted on the vertical axis, is the difference between current stock market value and the value of current performance. Both metrics are normalized by the company’s book value.
Growth-Value Map divides companies into four clusters, they are:
Excellent value managers (“Q-1”)
Market expects companies in Q-1 to surpass their benchmark in profitability and growth.
Expectation builders (“Q-2”)
Market has relatively low expectations of profitability from companies in Q-2 in the short term, but has growth expectations exceed the benchmark.
Traditionalists (“Q-3”)
Market has low growth expectations of companies in the Q-3, although they showed a good profitability in the short term.
Asset-loaded value managers (“Q-4”)
Market has low expectations in terms of profitability and growth for companies in Q-4.
Figure 1: Growth-Value Map
(SMSM and Automotive & Components Industry)
Source: Pefindo Equity & Index Valuation Division
Based on financial data as of September 30, 2011, we classify SMSM into a
traditionalist company (“Q-3”). Market saw SMSM’s capability in generating profits
exceed their benchmark expectation and also exceed its peers’ capability. This market expectation was confirmed by outstanding SMSM performance in 9M11 that generate highest EBITDA margin and assets turnover among its peers. It was also confirmed by the success of SMSM in increasing sales accompanied by improved profit margins, so that we estimate that in 2011 and few years forward SMSM’s profit margins will be above of previous years’ profit margins. On the other hand, even though SMSM is one of the largest filters and radiators manufacturers and with more than 100 countries sales destination, market expect SMSM’s growth opportunity slightly below their benchmark. This condition may suggest that market still expect global uncertainty that can disturb SMSM’s sales growth in international markets, but in the contrary SMSM proved their capability to deal with crisis to continue to grow. We therefore argue that market can have more expectation to SMSM’s growth opportunity for the future compared with current expectation.
“Disclaimer statement in the last page is an integral part of this report” www.pefindo.com
Selamat Sempurna, Tbk
th
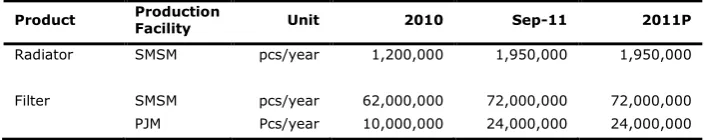
Production Capacity Expansion
In 2011, SMSM has added its production capacity, from previously 1.2 million pcs per year to 1.95 million pcs per year for radiators product (up by 62.5%), and from previously 72 million pcs per year to 96 million pcs per year or for filters product (up by 33.3%). Production capacity expansion for filters product occurred at both production facilities of SMSM’s and its subsidiary, PJM. Production capacity for filters product at SMSM’s production facility changed from 62 million pcs per year to 72 million unit per year (changed 16.1%), while at PJM’s production facility changed from 10 million pcs per year to 24 million pcs per year (changed 140.0%).
In 2010, SMSM’s capacity utilization for radiators and filters product are 69% and 67% respectively, and with the production capacity expansion in 2011 we estimate SMSM’s utilization will be at around 50% for radiators product and 55% for filters product. The larger production capacity SMSM’s has will be an important capital to support SMSM’s means to make market expansion and to grow its business in the few years to come.
Source: PT Selamat Sempurna Tbk, Pefindo Equity & Index Valuation Division
New Technical Assistance and License Agreement On November 22nd, 2011, SMSM has signed
Master Supplier Agreement (MSA),
Technical Assistance Agreement (TSA), and Consignment Production Agreement (CPA)
with Tokyo Roki Co., Ltd., Japan (TRC). TRC is a Japanese company which produces particular types of filter and other automotive components. By signing those agreements SMSM expect to get value added from technical assistance and marketing, so then it can support SMSM’s growth in the future. The agreements complement previous agreements that have been signed with other companies, they are: i) Tannex Corp., Japan, in 1985, ii) Tokyo Radiators Mfg. Co. Ltd., Japan, in 1994 and 2008, iii) Usui Kokusai Sangyo Kaisha, Ltd., Japan, in 1994, and iv) Donaldson Company Inc., USA, in 1984 and 2000.
Others Product Production Facilities Relocation
SMSM plans to relocate its others product (outside filters and radiators product) production facility that specialized for original equipment manufacturer (OEM) as well as for original equipment sparepart (OES) in 2012. The production facility is located in Kapuk area, Jakarta Utara, and planned to be relocated to Tangerang area, Banten. This relocation aimed as follow: 1) anticipation of demand enhancement of OEM/OES markets in the future, 2) preparing for more representatives production facility for OEM/OES markets, and 3) production facility centralization at “ADR Group industrial complex” to ease production planning and controlling activities. SMSM estimates the relocation will cost of about Rp 20-30 billion. We see that this relocation is part of SMSM’s strategy to enhance service quality to its customers and to support their means to increase others product sales in the future.
Recognition of SMSM’s Capability in Business Development and SMSM Stock
Registered in International Index
In the year of 2011 SMSM obtained many awards that demonstrate recognition of SMSM’s capabilities in the field of business development; some of the awards are as follow:
Award from Indonesian Record Museum (MURI) with a record as the largest manufacturer and seller of filters product for automotive components industry, obtained in January 2011.
Business Record Award from Tera Foundation as a company with the largest international trademark registration and the most complete range of filters product, obtained in March 2011.
TOP 50 Indonesia Global Brand and TOP 250 Indonesia Original Brand from SWA Sembada Magazine given for Sakura brand (SMSM’s filters product brand), obtained in July 2011.
“Disclaimer statement in the last page is an integral part of this report” www.pefindo.com
Selamat Sempurna, Tbk
th
Primaniyarta Award 2011 from Indonesian Government, granted for Indonesian exporters who have performed the best practice, obtained in October 2011. Marketing Award 2011 from Marketing Magazines for category The Best Marketing Driving and The Best in International Marketing; a recognition for SMSM’s capability in marketing their products to exports markets covering 105 countries and Sakura brands that have been registered in 90 countries. In addition, SMSM also recognized for their success in producing and introduced the first racing air filter in Indonesia. The award was obtained in November 2011.
Considering recognitions SMSM received, we believe SMSM has adequate capability in developing their business and we also confident that SMSM will persistently striving to penetrate deeper in the existing markets and likewise open possibilities in the new markets. Another encouraging development is SMSM stock registered in international index. On November 15th, 2011, for the first time SMSM stock was registered in Morgan Stanley Capital International (MSCI) Indonesia Small Cap Index. MSCI Index is one of global investors reference indexes to make investment decision, and therefore SMSM will enjoy the benefit of international exposure in the eyes of global investment communities, as well as the increased of investors’ confidence to SMSM’s business development capability and the future prospect.
World Economy Development: Collective Fiscal Austerity Effect to Global Economy Growth
Based on The Conference Board research, global economy growth is projected to grow at 3.2% in 2012, weakening from the previous year growth of 3.9%, but then expected to accelerate somewhat to 3.5% for the periods of 2013-2016. Global economy will faces exceptional uncertainty as it enters 2012 as weaker output among developed countries and collective of fiscal austerity is being launched particularly in Eurozone. These may result one of the most severe fiscal contractions in many years. While in US, stimulus programs launched in 2010 are being replaced by austerity measures, giving more effect to collective austerity of developed countries. Therefore, advance economies are expected to have a slowdown growth in 2012 of 1.3% as in 2011 already have low growth of 1.6%. But then, it is believed that in 2013-2016 advance economy may have some recovery and they expected to be back to pre-recession growth trend of a little more than 2%.
Developing countries will face weakening external demand in 2012, but in most emerging economies they can rely on domestic demand to propel the growth until the world economy becomes healthier. But for developing countries that rely on external demand, will impacted from the shrinking of global market. In line with the downturn in overall economy, emerging economies are estimated to have growth of only 5.1% in 2012 lowering from 6.4% growth in 2011. This shrinking as a result of emerging economies will experience slower export growth, and some may because already growing above the trend. However, they generally have more flexibility in fiscal policy than most of developed countries that may benefit them in term of more stable
Central & Eastern Europe 4.0 2.1
Rusia and other CIS 4.6 2.8
Emerging Market and Developing Economies 6.4 5.1
World 3.9 3.2
“Disclaimer statement in the last page is an integral part of this report” www.pefindo.com
Selamat Sempurna, Tbk
th
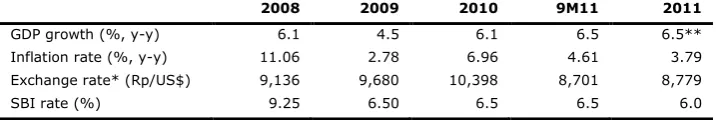
Indonesian Economy Development: Domestic Demand will continue to Support the Economy Growth
Indonesian economy expanded by 6.5% y-y up to 9M11, improved compared with 2010’s growth of 6.1% y-y. Domestic consumption continued to be the backbone of Indonesia’s economy as it was grew by 5.4% y-y in 9M11, higher than 5.2% y-y growth in 2010. Along with the domestic consumption growth, net export also expanded faster this year, it is expanded by 64.1% y-y in 9M11 faster than 14.1% in 2010 which supported mainly by commodity export to other Asian countries that are relatively better economic performance compared to Europe and US countries. Indonesia’s economy in 2011 also remarked by low inflation at the end of 2011 and reaches 3.79% y-y at the year end of 2011, much lower compared to 2010’s of 6.96% y-y. Similarly, Rupiah exchange rate against US$ strengthen compared to 2010’s and on average traded at Rp 8,700-8,800 per US$.
Table 4: Indonesian Economic Indicators ** Expected to be unchanged from 9M11 figure
Source: BPS, Bank Indonesia, Pefindo Equity & Index Valuation Division
For 2012, we see that Indonesia’s economic fundamentals will remain strong despite expected effect of current global crisis that may cause slow down to global economy. Therefore we estimate that Indonesia’s economy growth will slightly down to 6.2% y-y in 2012, as in 9M11 it was recorded of 6.5%. The growth locomotive would be contributed from private consumption with the support of continued consumers’ optimism, manageable inflation, lower interest rate, and increasing per capita income. Indonesia’s per capita income is expected to reach US$ 3,500 in 2011, and may break US$ 4,000 in 2012, compared to US$ 3,000 in 2010. Meanwhile, investment realization in 9M11 was Rp 120 trillion or rose by 16% compared to 2010’s, and expected to get Rp 170 trillion up to end of 2011. With population composition is dominated by productive age population (around 60%) and increasing international perception of Indonesia’s economy development that reflected from the inclusion of Indonesia into investment grade by Fitch on December 2011 and by Moody’s on January 2012, then we believe that Indonesia will able to maintain its favorable growth in the coming years.
Moderate Outlook of Global Car Sales and Developing Countries Car Sales will Exceed Mature Market in 2012
“Disclaimer statement in the last page is an integral part of this report” www.pefindo.com
Selamat Sempurna, Tbk
th
Figure 2: Car Sales in Some Developed Countries and BRIC Countries
Source: Global Auto Report, Pefindo Equity & Index Valuation Division
Fantastic of Domestic Car Sales in 2011 and Remain Fascinated in 2012 Indonesian Automotive Industries Association recorded domestic car sales throughout 2011 reached 894,180 units, up by 16.8% y-y compared to 2010’s sales of 764,710 units. This result was fantastic since in 2011 there was tsunami that struck Japan in March 2011 and flood in Thailand that disturbed automotive components and car units supply. In November 2011, Indonesia’s car sales already above Thailand’s car sales with 813,856 units, while Thailand’s car sales was only 739,506 units. This is for the first time as Thailand was always a leader in car sales in ASEAN region.
By considering Indonesia’s economy will remain continue to record good performance and Europe and US crisis will not significantly affect overall domestic economy, national automotive market is predicted will remain fascinated in 2012 with estimated domestic car sales will reach 930 thousand units. The optimism also driven by the restoration automotive components and car units supply from Thailand and Japan. Even some manufacturers already plan to launch several new models and including low-price cars. But it is wise to consider that domestic car sales will be slowing down within the first quarter of 2012 due to government’s plan of more strict limitation subsidized fuel consumption started on April 1st, 2012. However, we believe the effect will only occur in the short-time and then the car sales will continue to grow normally.
Figure 3: Domestic Car Sales
“Disclaimer statement in the last page is an integral part of this report” www.pefindo.com
Selamat Sempurna, Tbk
th
Heavy Equipment Industry will Continue to Expand in 2012
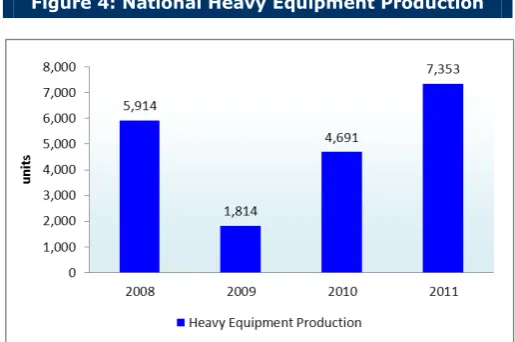
In 2011, national heavy equipment production reach 7,353 units, jump by 60.6% y-y from the previous year in 2010 that was only produced 4,691 units. The fascinating of heavy equipment industry will remain to continue in 2012, as Heavy Equipment Manufacturer Association of Indonesia that production growth will be at 35% y-y to around 10 thousand units. Global crisis and global economic slowdown may not significantly impacting heavy equipment industry as the products mainly absorbed by domestic demand; besides overall market demand for heavy equipment is further than local manufacturers can produced. Up to 2011, heavy equipment market is amounted of 17 thousand units and projected to expand to 21 thousand units in 2012.
Figure 4: National Heavy Equipment Production
Source: Equipment Manufacturer Association of Indonesia, Pefindo Equity & Index Valuation Division
Convincing Capability of Market Development in Developed Countries and Big Potential in Domestic Market
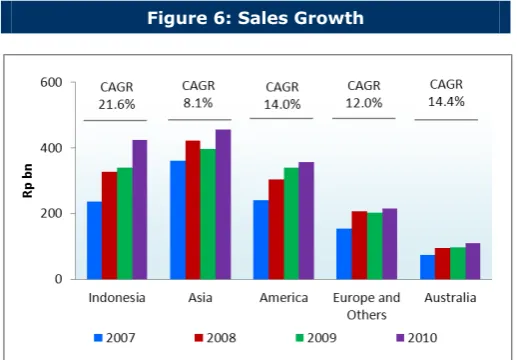
SMSM’s sales is dominated by filters product with 76.7% of sales contribution in 9M11, and then followed by radiators product by 20.6%. SMSM is a company with a very wide global market with export market of more than 100 countries. Export market was accounted more than 70% of sales spreading over Asia, Australia, America, Europe and other regions. Despite developed countries suffering from current crisis, SMSM’s sales in developed countries have a higher growth compared to sales in Asia and Indonesia. Sales in the region of Australia, America, and Europe and others experienced growth in 9M11 by 25.3%, 17.3%, and 31.0% respectively. Europe and others region market grew higher than other regions albeit Europe is the center of the current global crisis. SMSM able to developed significant sales growth in those three areas in the range of 12%-15% CAGR for the periods of 2007-2010. This condition provides us of convincing SMSM’s capability of market development in developed economy and demonstrates market recognition of SMSM’s products and services quality in those regions.
Asian countries are the highest contributor of SMSM sales and it was accounted for 28.1% in 9M11. Meanwhile the average growth in Asia region was only 8.1% CAGR for 2007-2010; the lowest average growth compared to others regions. On the other hand, domestic market is the fastest growing market for SMSM’s sales with the growth of 21.6% CAGR for 2007-2010. In 9M11 domestic sales still expanded by around 15% and with sales value has reached 93% of sales in Asia region, which demonstrate that domestic market has big potential for SMSM moreover with the encouraging development of Indonesian automotive industry in the last few years.
“Disclaimer statement in the last page is an integral part of this report” www.pefindo.com
Selamat Sempurna, Tbk
th
Figure 5: SMSM’s Sales Composition in 9M11
Sales by Product Sales by Geography
Source: PT Selamat Sempurna Tbk, Bloomberg, Pefindo Equity & Index Valuation Division
Figure 6: Sales Growth
Source: Bloomberg, PT Selamat Sempurna Tbk, Pefindo Equity & Index Valuation Division
Sales Growth Accompanied by Improved Profit Margins
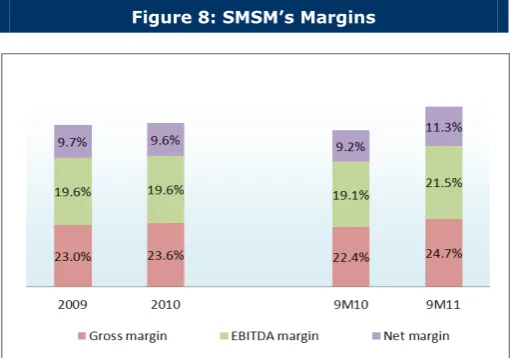
SMSM can realized sales of Rp 1.31 trillion in 9M11, grew 16.7% y-y from 9M10’s sales of Rp 1.12 trillion. The growth in 9M11 is higher than sales growth for 2010 which was only 13.6% y-y. What interesting from SMSM’s performance in 9M11 is that the increased in sales growth accompanied by improved profit margins driven by the increased in efficiency. SMSM was able to strike 2.2%-2.5% of increased in profit margins for 9M11. SMSM recorded 24.7% of gross margin in 9M11 compared to 22.4% in 9M10. The improved margin due to declining of SMSM’s COGS to sales in the midst of the rising of raw materials prices throughout 2011. For the first nine months in 2011, average prices of raw materials of steel, nickel, aluminum, copper, and tin have climbed up of about 10%, 15%, 18%, 20%, and 50% respectively from the same period in the previous year. This condition provides indication of SMSM capability to apply efficiency in raw material management.
“Disclaimer statement in the last page is an integral part of this report” www.pefindo.com
Selamat Sempurna, Tbk
th
Figure 7: SMSM’s Sales Growth
Source: PT Selamat Sempurna Tbk, Pefindo Equity & Index Valuation Division
Figure 8: SMSM’s Margins
Source: PT Selamat Sempurna Tbk, Pefindo Equity & Index Valuation Division
“Disclaimer statement in the last page is an integral part of this report” www.pefindo.com
Selamat Sempurna, Tbk
th
Figure 9: SMSM’s Margins vs Its Peers
Source: PT Selamat Sempurna Tbk, Pefindo Equity & Index Valuation Division
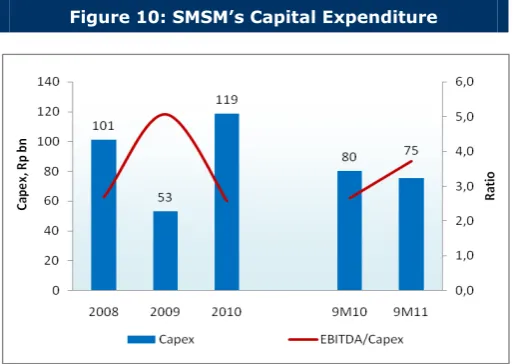
Figure 10: SMSM’s Capital Expenditure
Source: PT Selamat Sempurna Tbk, Pefindo Equity & Index Valuation Division
Dividend Update: Final Cash Dividend 2010 and Interim Dividend 2011
On June 6th, 2011, Annual General Meeting of Shareholders has decided cash dividend disbursement of Rp 136.8 billion or Rp 95 per share for 2010 fiscal year, which reflects 90.9% of net income of Rp 150.4 billion. As in 2010 SMSM has paid interim dividends of Rp 93.6 billion or Rp 65 per share, therefore the final cash dividend for 2010 fiscal year is Rp 43,2 billion or Rp 30 per share which then already paid by SMSM on August 4th, 2011. Meanwhile, for 2011 fiscal year, SMSM has scheduled interim dividend payment of Rp 72.0 billion or Rp 50 per share and already paid on December 1st, 2011. Based on long history of dividend payment, we believe SMSM will continue to have a strong commitment in dividend payment as they already apply as part of their long-term goals within 5 years ahead. Therefore, it is not surprising if SMSM commitment awarded by Finance Asia with predicate: most committed to a
strong dividend policy (ranked 6th) among listed companies in Indonesia.
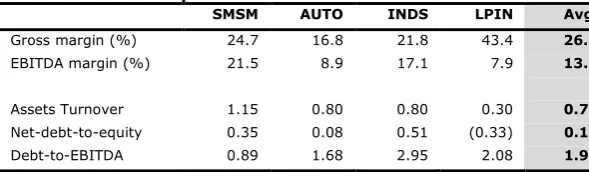
Still Highly Competitive Performance among Its Peers
“Disclaimer statement in the last page is an integral part of this report” www.pefindo.com
Selamat Sempurna, Tbk
th
Table 5: Peers Comparison of 9M11 Performance
SMSM AUTO INDS LPIN Avg.
Gross margin (%) 24.7 16.8 21.8 43.4 26.7
EBITDA margin (%) 21.5 8.9 17.1 7.9 13.8
Assets Turnover 1.15 0.80 0.80 0.30 0.76
Net-debt-to-equity 0.35 0.08 0.51 (0.33) 0.15
Debt-to-EBITDA 0.89 1.68 2.95 2.08 1.90
Source: Bloomberg, PT Selamat Sempurna Tbk, Pefindo Equity & Index Valuation Division
Business Prospect
SMSM now has a bigger production capacity which giving supply of idle capacity of estimated about 50% for radiators product and 45% for filters products in 2011. The idle capacities will become one of main capital for SMSM in market expansion measures so that SMSM already equipped for the increasing demand in the coming years. New agreements with Tokyo Roki Co., Ltd., Japan is expected to giving added value especially in technical assistance in production and marketing the related products and then becoming new driving engine for SMSM growth opportunity in future. We believe on SMSM’s capability in business development as well as many various institutions that have provided SMSM awards in 2011 for its outstanding business performance.
Although in 2011 world economy affected by the global crisis, SMSM’s sales to export markets were still able to grow with a convincing growth rate of 16%-31% (in 9M11) outperformed sales growth in domestic market. Moreover sales in Europe and others region recorded the highest growth among market regions SMSM have, suggest SMSM’s capability to keep growing in the midst of crisis that has faced. Global car sales outlook in 2012 is remain in moderate level, with expected sales growth in US market will higher than expected growth of global market, and fascinating growth will happened in developing countries where the car sales in developing economy market will exceed car sales in developed economy. Meanwhile, with the portion of 25%-35% and as a region with the highest average sales growth (21.6% CAGR, 2007-2010), domestic market also promising big opportunities for SMSM. Moreover supported with encouraging Indonesia’s economy development for the last few years and estimated to continue in 2012 with expected economic growth of 6.2 y-y. Domestic car and heavy equipment sales development was also fantastic in 2011 and expected to continue in 2012.
We see that 2011 was a very special year for SMSM. SMSM successfully scored sales growth accompanied by improved profit margins, moreover in the midst of the climbing of raw materials prices. Profit margins in 9M11 suggest a new level of margins which we expect will sustain in the years ahead. SMSM also has a capability in generating sufficient operating profits and proven assets utilization that even higher than its peers. Considering all the aspects described before, we believe SMSM has a bright prospect in the future in term of growth and competitiveness. Thus we estimate average SMSM’ sales growth for the periods of 2010-2015 will reach 16.7% CAGR.
Figure 11: SMSM’s Sales, Total Assets, and Total
Equity
“Disclaimer statement in the last page is an integral part of this report” www.pefindo.com
Selamat Sempurna, Tbk
th
Table 6: SMSM and Its Peers Performance Summary as of 9M11
SMSM AUTO INDS LPIN
Net sales [Rp bn] 1,306 5,451 891 44
Gross profit [Rp bn] 323 916 194 19
Operating profit [Rp bn] 220 362 131 3
Net profit [Rp bn] 148 754 86 6
Total asset [Rp bn] 1,131 6,779 1,117 150
Total liabilities [Rp bn] 447 2,217 518 36
Total equity [Rp bn] 684 4,562 599 113
Growth y-y 16.7 18.1 17.9 5.1
Net sales [%] 28.5 10.0 27.9 8.0
Gross profit [%] 38.6 (11.3) 44.9 (51.3)
Operating profit [%] 44.1 (9.4) 26.7 (34.5)
Net profit [%] 16.7 18.1 17.9 5.1
Profitability 24.7 16.8 21.8 43.4
Gross profit margin [%] 16.9 6.6 14.7 7.4
Operating profit margin [%] 13.1 11.1 7.7 4.3
ROA [%] 21.6 16.5 14.4 5.6
ROE [%] 24.7 16.8 21.8 43.4
Leverage
DER [x] 0.7 0.5 0.9 0.3
“Disclaimer statement in the last page is an integral part of this report” www.pefindo.com
Selamat Sempurna, Tbk
th
VALUATION
Methodology
We apply Discounted Cash Flow (DCF) method as the SMSM valuation approach considering the income growth is a value driver instead of the asset growth.
Furthermore, we also apply Guideline Company Method (GCM) as comparison method.
This valuation is based on 100% shares price as of January 24th, 2012, and Financial Report as of September 30th, 2011 as the basis for the fundamental analysis.
Value Estimation
We use the cost of capital and cost of equity of 10.89% and 12.71% based on the following assumptions:
Table 7: Assumption
Risk free rate [%]* 5.59
Risk premium [%]* 8.79
Beta [x]* 0.81
Cost of Equity [%] 12.71
Marginal tax rate [%] 22.00
Debt to Equity Ratio [x] 0.74
WACC [%] 10.89
Source: Bloomberg, Pefindo Equity & Index Valuation Division Estimates * as of January 24th, 2011
Target price for 12 months based on valuation as per January 24th, 2012, is as follows:
Using DCF method with discount rate assumption 10.89%, is Rp 2,020 – Rp 2,250 per share.
Using GCM method (P/E 9.7X and P/BV 2.1X) is Rp 1,358 – Rp 1,396 per share.
In order to obtain a value which represents both value indications, we have weighted both DCF and GCM methods by 70%:30%.
Based on the above calculation, target price of SMSM for 12 month is Rp 1,820 - Rp 1,990 per share.
Table 8: Summary of DCF Method Valuation
Conservative Moderate Optimist
PV of Free Cash Flows [Rp bn] 925 974 1,022
PV of Terminal Value [Rp bn] 2,221 2,338 2,455
Non-Operating Assets [Rp bn] 12 12 12
Debt [Rp bn] (249) (249) (249)
Number of Share [mn shares] 1,440 1,440 1,440
Fair Value per Share [Rp] 2,020 2,135 2,250
“Disclaimer statement in the last page is an integral part of this report” www.pefindo.com
Selamat Sempurna, Tbk
th
Table 9: GCM Comparison
SMSM AUTO INDS LPIN Average
Valuation, January 24th, 2012
Price [Rp] 1,560 3,500 3,775 2,200
Market capitalization [Rp bn] 2,246 13,495 849 47
P/E [x] 11.5 12.5 10.5 4.3 9.7
P/BV [x] 3.6 3.1 1.4 0.4 2.1
Source: Bloomberg, Pefindo Equity & Index Valuation Division
Table 10: Summary of GCM Method Valuation
Multiple [x] Est. EPS [Rp] Est. BV/share [Rp] Value [Rp]
P/E 9.7 140 - 1,358
P/BV 2.1 - 655 1,396
Source: Bloomberg, Pefindo Equity & Index Valuation Division Estimates
Table 11: Fair Value Reconciliation
Fair Value per Share [Rp]
DCF GCM Average
Upper limit 2,250 1,396 1,990
Bottom limit 2,020 1,358 1,820
Weight 70% 30%
Source: Pefindo Equity & Index Valuation Division Estimates
“Disclaimer statement in the last page is an integral part of this report” www.pefindo.com
Source: PT Selamat Sempurna Tbk, Pefindo Equity & Index Valuation Division Estimates
* Restated as refer to PSAK No. 22 (2010 revision)
Source: PT Selamat Sempurna Tbk, Pefindo Equity & Index Valuation Division Estimates
Figure 12: Historical P/E dan P/BV
Source: PT Selamat Sempurna Tbk, Pefindo Equity & Index Valuation Division
Figure 13: Historical ROA, ROE and Total Asset Turnover
Source: PT Selamat Sempurna Tbk, Pefindo Equity & Index Valuation Division
Table 14: Key Ratios
“Disclaimer statement in the last page is an integral part of this report” www.pefindo.com
Selamat Sempurna, Tbk
th
DISCLAIMER
This report was prepared based on the trusted and reliable sources. Nevertheless, we do not guarantee its completeness, accuracy and adequacy. Therefore we do not responsible of any investment decision making based on this report. As for any assumptions, opinions and predictions were solely our internal judgments as per reporting date, and those judgments are subject to change without further notice.
We do not responsible for mistake and negligence occurred by using this report. Last performance could not always be used as reference for future outcome. This report is not an offering recommendation, purchase or holds particular shares. This re port might not be suitable for some investors. All opinion in this report has been presented fairly as per issuing date with good intentions; however it could be change at any time without further notice. The price, value or income from each share of the C ompany stated in this report might lower than the investor expectation and investor might obtain lower return than the invested amount. Investment is defined as the probable income that will be received in the future; nonetheless such return may possibly f luctuate. As for the Company which its share is denominated other than Rupiah, the foreign exchange fluctuation may reduce the value, price or investor investment return. This report does not contain any information for tax consideration in investment deci sion making.
The share price target in this report is a fundamental value, not a fair market value nor a transaction price reference required by the regulations.
The share price target issued by Pefindo Equity & Index Valuation Division is not a reco mmendation to buy, sell or hold particular shares and it could not be considered as an investment advice from Pefindo Equity & Index Valuation Division as its scope of service to, or in relation to some parties, including listed companies, financial advisor, broker, investment bank, financial institution and intermediary, in correlation with receiving rewards or any other benefits from that parties.
This report is not intended for particular investor and cannot be used as part of investment objective on particular shares and neither an investment recommendation on particular shares or an investment strategy. We strongly recommended investor to consider the suitable situation and condition at first before making decision in relation with the figure in this r eport. If it is necessary, kindly contact your financial advisor.
PEFINDO keeps the activities of Equity Valuation separate from Ratings to preserve independence and objectivity of its analytical processes and products. PEFINDO has established policies and procedures to SMSMtain the confidentiality of certain non-public information received in connection with each analytical process. The entire process, methodology and the database used in the preparation of the Reference Share Price Target Report as a whole is different from the processes, methodologies and databases used PEFINDO in doing the rating.
This report was prepared and composed by Pefindo Equity & Index Valuation Division with the objective to enhance shares price transparency of listed companies in Indonesia Stock Exchange (IDX). This report is also free of other party’s influence, pressure or force either from IDX or the listed company which reviewed by Pefindo Equity & Index Valuation Division. Pefindo Equity & Index Valuation Division will earn reward amounting to Rp 20 mn each from IDX and the reviewed company for issuing report twice per year. For further information, please visit our website at http://www.pefindo.com