Detection of dairy cow behaviour changes associated with claw horn lesions using biosensors
Z E Barker1, H R Hodges1, J A Vazquez Diosdado2, N J Bell3, E A Codling2, D P Croft4, J R Amory1
1
Writtle College, Chelmsford, Essex, UK, 2University of Essex, Colchester, UK, 3RVC, Potters Bar, Hertfordshire, UK,
4University of Exeter, Devon, UK
Application Differences in dairy cow feeding behaviour detected by sensors may offer a method of predicting lameness on
farms.
Introduction Recent technological developments in biosensors offer the potential for automatic real-time monitoring of
animals. Early detection and therefore prompt treatment of lameness case reduces severity and duration of cases (Leach et al., 2012). Observational studies have shown that changes in behaviour often precede clinical signs of disease and may therefore be useful predictors of disease (e.g. Gonzalez et al., 2008). This study investigates the potential for a sensor combining location, activity and orientation to detect changes in time budget associated with lameness.
Material and methods All cows from a group of 120 high yielding dairy cows were fitted with neck collars mounted with
Omnisense 500 ® sensors between July and December 2014. A support vector machine was used to classify cows as standing, lying or feeding similar to the method described by Vazquez Diosdado et al, (2015). Cows were mobility scored every 2 weeks using the DairyCo. mobility score (score 2 or 3 were classified as clinically lame). ZB observed all trimming sessions by the foot trimmer and all lesions treated by the farm staff were recorded by the researcher in a weekly interview. The 7 days prior to lesion treatment were used in the analyses for cows clinically lame with sole ulcers (SU) or white line disease (WL). Cows with no lesions and no lame scores during the study period were classified as non-lame. Standing, lying and feeding behaviour variables were compared for SU, WL and Non-lame cows using a one-way ANOVA (Genstat v17).
Results The duration of feeding bouts were significantly shorter for cows lame with SU compared with non-lame cows
without lesions. There was also a non-significant trend for increased numbers of feeding bouts for cows with SU.
Table 1 Behaviour of cows lame with sole ulcer, white line disease or never lame with no lesions recorded
SU WL Non-lame SED* p-value
Number of cows 9 6 8
Number of Feeding Bouts 14.5 11.1 11.2 1.67 0.08
Mean Feeding Bout Duration (mins) 20.0a 25.4ab 32.5b 5.12 0.05
Total Feeding Duration (hrs) 5.3 5.4 5.5 0.38 ns
Number of Lying Bouts 20.2 21.2 19.5 2.28 ns
Mean Lying Bout Duration (mins) 40.4 40.5 41.2 4.55 ns
Total Lying Duration (hrs) 12.5 13.0 12.7 0.65 ns
Number of Standing Bouts 22.6 20.8 18.1 2.50 ns
Mean Standing Bout Duration (mins) 8.4 7.9 7.2 1.05 ns
Total Standing Duration (hrs) 3.3 2.8 2.2 0.56 ns
*SED; Standard Error of Difference. a,b Different letters in the same row indicate Tukey post hoc test difference P<0.05
Conclusion The pain associated with claw horn lesions whilst standing to feed may explain the larger number of shorter
feeding bouts for the SU cows compared with the non-lame cows. WL may also cause a similar effect, but a larger sample size is needed to confirm this. Alternatively recent evidence suggests that cows may already be thin cows before becoming lame and so these alterations in feeding behaviour may begin before the onset of lesions (Lim et al 2015). Detection of behaviour changes could make either the early detection of lameness or the prediction of cows at risk of lameness possible.
Acknowledgements We would like to thank the staff at the study farm for the help and cooperation. We also thank
Omnisense.
References
González, L.A., B.J. Tolkamp, M.P. Coffey, A. Ferret, and I. Kyriazakis. 2008. Journal of Dairy Science 91,1017-1028 Leach, K.A., D.A. Tisdall, N.J. Bell, D.C.J. Main, L.E. Green. 2012. Vet. J. 193:626-632
Lim, P.Y., J.N. Huxley, J.A.Wilshire, M.J. Green, R.R. Othman and J. Kaler (2015). Prev Vet. Med. 118,370-377
A new system for automatic weighing of beef cattle
D W Ross1, S M Troy1, C-A Duthie1, J J Hyslop2, R Ritchie3
1
SRUC Research, Midlothian, UK, 2SAC Consulting, Midlothian, UK, 3David Ritchie (Implements) Ltd, Angus, UK [email protected]
Application A configuration that allows automatic weighing of livestock at a water trough. Integrated with electronic
identification this could provide a valuable management tool for monitoring growing and finishing cattle, and provide a platform for complimentary technologies.
Introduction Growth rate is an important measure in assessing individual beef animal finishing performance, and is a key
variable in assessing feed efficiency, an economically important trait of beef cattle (Nkrumah et al., 2007). Average daily gain (ADG) systems are available that integrate at feed points (e.g. Growsafe Beef Feedlot), or as walkover systems (e.g. Fullwood WS). This embodiment validates the watering point position, in combination with individual electronic identification (EID). The objectives were to develop and test a passive recording system (in the form of an open ended-crate construct) designed for use by multiple animals, at a common watering point.
Material and methods 78 steers of various breeds were split into two adjoining pens (n=39) and offered ad libitum one of
two contrasting finishing diets: (i) forage-based diet (Mixed, 500 g concentrate / kg DM), or a high concentrate diet (Conc, 920 g concentrate / kg DM). Within each pen a BeefMonitor (BM) weight recording station was positioned at a water trough to automatically weigh each animal at every drinking event, using EID tags to identify the animal. Once per week the steers were also removed from their pens prior to receiving fresh feed and weighed using a calibrated weighing
platform (Tepari Cattlemaster “Titan”). The steers remained on the trial for a minimum of 5 weeks, after which time they
were sent for slaughter in 4 groups over a period of 8 weeks. Daily BM weights were calculated by averaging the individual animal BM weights collected over a 24 hour period. ADG (kg/day) for both the BM and crush weights were calculated by regressing weight against days on trial. ADGs for both weigh stations were analysed using general linear models with fixed effects of diet and weigh station.
Results ADG did not differ between weigh stations (P>0.05; BM: 1.3±0.04 kg/day, Crush: 1.3±0.04 kg/day). Steers
receiving the Conc diet grew at a faster rate than those steers receiving the Mixed diet (P<0.0001; Conc: 1.5±0.04 kg/day, Mixed: 1.1±0.03 kg/day).
Diet Mixed Conc Significance
Weigh Station BM Crush BM Crush Weigh Station Diet Weight Station * Diet
ADG (kg/day) 1.1 1.1 1.5 1.4 NS *** NS
Conclusion The is no difference in ADG gain values calculated from weights gathered automatic using a weighing station
positioned at a water trough and from weekly weights measured in a weighing system integrated into a handling system. All animals adapted to the physical BM system arrangement.
Acknowledgements This project was co-funded by Innovate UK. References
Nkrumah J.D., Basarab J.A., Wang Z., Li C., Price M.A., Okine E.K., Crews D.H., Moore S.S., 2007. Genetic and phenotypic relationships of feed intake and measures of efficiency with growth and carcass merit of beef cattle. Journal of Animal Science 85, 2711–2720
500 520 540 560 580 600 620 640 660
42219 42233 42247 42261 42275 42289 42303
Crush Weight
Effect of oestrous synchronisation programme and season on pregnancy rate to timed artificial
Application Artificial insemination (AI) is the most used and valuable reproductive biotechnology for genetic
improvement in beef cattle. Timed AI (TAI) based programmes are required to reduce labour requirements and the necessity for heat detection.
Introduction The use of AI in the Irish beef industry is limited with typically only ~20% of calves born to beef cows sired
by an AI bull. One of the principal reasons for the poor penetration of the technology is the challenge of detecting animals in oestrus. In particular, small herd size with resultant lower incidence of oestrus-related activity, land fragmentation and the part-time nature of the enterprise mitigate the use of AI, where heat detection is required. Oestrous synchronisation protocols which facilitate the use of timed AI (TAI) provide the opportunity to dramatically increase the use of AI on beef cows (Bó and Baruselli, 2014), but must be both labour efficient and effective. The aim of this study was to evaluate the use of three TAI protocols on pregnancy rate of beef cows under field conditions.
Material and methods A total of 1410 suckled cows located on 61 farms throughout the island of Ireland were enrolled on
the study, which was replicated in spring (S; n=703 cows) and autumn (A; n=707 cows) of 2014. A voluntary waiting period of 35 days post partum was employed. Body condition score (BCS) was assessed and ovarian ultrasonography was conducted to determine the presence of a corpus luteum (CL). Cows were randomly assigned to receive a 7 day progesterone-releasing intravaginal device (PRID) without (Group 1) or with (Group 2) administration of gonadotropin releasing hormone (GnRH) analogue at PRID insertion and a luteolytic dose of prostaglandin F2α was given at PRID removal. A third group of cows (Group 3) received 400 IU equine chorionic gonadotropin (eCG) at PRID removal. GnRH was administered at TAI 72 h after PRID removal. Pregnancy diagnosis by transrectal ultrasonography was conducted 35-40 days after FTAI. Data were analyzed using the GENMOD procedure of SAS, appropriate to the 2 (seasons) x 3 (treatments) factorial design employed.
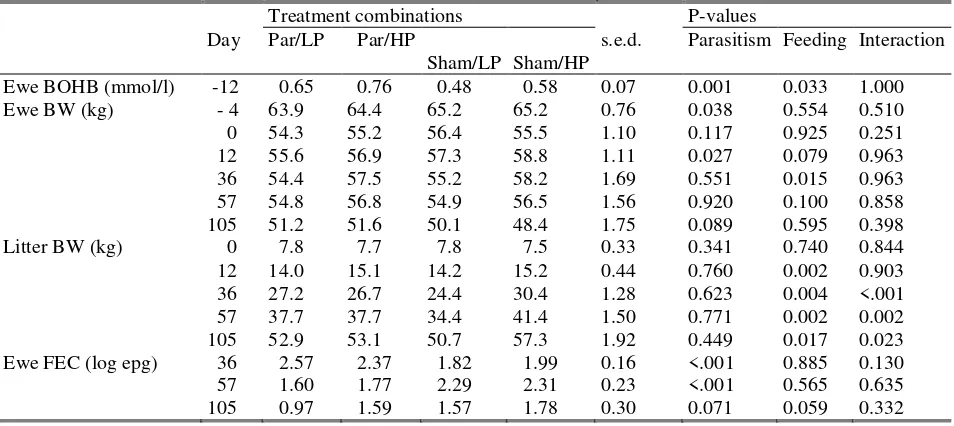
Results Mean BCS was 2.75 and 2.92 for S and A cows respectively and was not different between treatments. Overall
BCS was positively associated with pregnancy rate (P=0.003).Presence of a CL at treatment initiation increased pregnancy rate independent of either treatment or season (S 50.58%; A 69.97%; P=0.03). There was a treatment by season interaction for pregnancy rate (P=0.0002; see figure 1). Mean pregnancy rate was 59.1% (416/703) for spring calving cows and was affected by treatment (49.6 v 59.3 v 68.5%, for groups 1, 2 and 3, respectively P<0.05). In contrast, in autumn, overall pregnancy rate (52.6%, 364/707) was unaffected by treatment (53.7 v 52.0 v 48.7%, for groups 1, 2 and 3 respectively).
Conclusion The administration of
GnRH at the initiation of a 7 day Co-Synch+PRID protocol as well as supplementation of 400 IU of eCG at
PRID removal, both increased
pregnancy rate in spring-calving beef cows. However, these effects were not evident in autumn calving cows. Seasonal differences in outcome may reflect different management practices
Department of Agriculture, Food and the Marine under the Research Stimulus Fund (Project 13/S/515)
References
Bó G. A. and Baruselli P. S. 2014. Animal 8 Supplement s1, 144–150.
Comparative live weight, body condition score at breeding and reproductive performance of
high and low replacement index beef cows
S McCabe1,2, N McHugh3, N E O'Connell2, R Prendiville1
1Teagasc Grange, Dunsany, Co. Meath, Ireland, 2Queen’s University Belfast, UK, 3Teagasc Moorepark, Fermoy, Co.
Cork, Ireland
Application Replacement index is used to identify animals suitable for breeding or selecting replacements on the basis of
their genetic merit
Introduction Producing a live calf every spring in a defined calving period is critical to achieving a profitable suckler
system in Ireland (Crosson et al., 2009). However, current industry figures show that cows are producing 0.82 calves per year with a calving interval of 407 days (ICBF, 2015). With the inception of a replacement index by ICBF in 2012, availability of maternal genetic evaluations should enable breeders to improve current industry performance and ultimately improve maternal efficiency of the beef sector. Therefore, the objective of this study was to compare the live weight, body condition score (BCS) at breeding and reproductive performance of high and low replacement index cows.
Material and methods Data were available from 179 cows over two consecutive calving seasons; 101and 78cows of high
and lowindex, respectively. Animals were selected from high reliability (>70%) Aberdeen Angus and Limousin sires. The
replacement index was €119 and €50 for high and low index cows, respectively. Cows were targeted to calve for the first
time at 24 months of age. Live weight and BCS (0 to 5) were recorded every three weeks. Breeding commenced in late April in 2014 and 2015 and lasted 13 weeks. Tail paint and vasectomised bulls were used as aids for heat detection. Cows were artificially inseminated for six weeks in 2014, nine weeks in 2015 and stock bulls thereafter. Reproductive variables included: calving to service interval, 24 day submission rate, pregnancy rate to first service, six week calf rate, final in-calf rate, calving to conception interval and the number of services per cow. All pregnancy traits were defined based on trans-rectal ultrasound imaging (Aloka 210D * ΙΙ, 7.5 MH3) 70 days after the end of the breeding season. The effects of
cow genotype on cow live-weight, BCS and reproductive performance was analysed using mixed models in PROC HPMIXED (SAS Inst. Inc., Cary, NC). Sire of the cow was included as the random effect. Analysis of binary fertility data was undertaken using PROC GENMOD assuming a logit link function. Fixed effects included in all models were genotype of cow, year, parity and heterosis and recombination loss of the cow.
Results Live weight, age at first calving, actual calving interval, overall pregnancy rate and all aforementioned
reproductive variables investigated were similar across genotypes (Table 1). However, low genetic merit cows had 0.08 of a greater BCS (P<0.05) than high merit cows.
Table 1 Effect of genetic merit on live weight, body condition score and reproductive performance.
High Genetic Merit Low Genetic Merit s.e.1 P-value
Live weight (kg) 556 572 9.7 0.1453
Age at first calving (d) 756 758 5.9 0.7481
BCS at breeding2 2.70 2.78 0.024 <0.05
Calving to service interval (d) 61 58 2.7 0.3737
Submission rate in first 24 days (%) 0.67 0.55 0.0918
Pregnancy to first service (%) 0.50 0.48 0.8478
6 week in-calf rate (%) 0.56 0.57 0.9209
Pregnancy rate (%) 0.89 0.86 0.722
Calving to conception interval (d) 77 74 2.8 0.3742
No. of services per cow 1.81 1.65 0.094 0.2294
Actual calving interval (d) 360 354 4.8 0.3344
1Weighted standard error of the mean, 2BCS = body condition score: 0 = emaciated, 5 = extremely fat
Conclusion Results from the current study suggest that high merit animals had a lower BCS at breeding than low merit animals. However, genotype had no effect on live weight or any other reproductive traits investigated.
References
Effect of altering plane of nutrition during the first and second six months of life on age at
puberty onset in Holstein Friesian bulls
C Byrne1,2, A-M English1,3, S Fair3, P Lonergan2, D A Kenny1
1Animal & Grassland Research and Innovation Centre, Teagasc, Dunsany, Co. Meath, Ireland, 2School of Agriculture and
Food Science, University College Dublin, Belfield, Dublin 4, Ireland, 3Department of Life Sciences, University of Limerick,
Limerick, Ireland [email protected]
Application Earlier onset of puberty in young genomically-selected high genetic merit dairy bulls will advance the
availability of semen, shorten the generation interval and accelerate the rate of genetic improvement. Our data demonstrate that increasing the plane of nutrition during calf-hood advances the age at which puberty occurs.
Introduction With the advent of genomic selection, dairy bulls can now be identified as sires for use in artificial
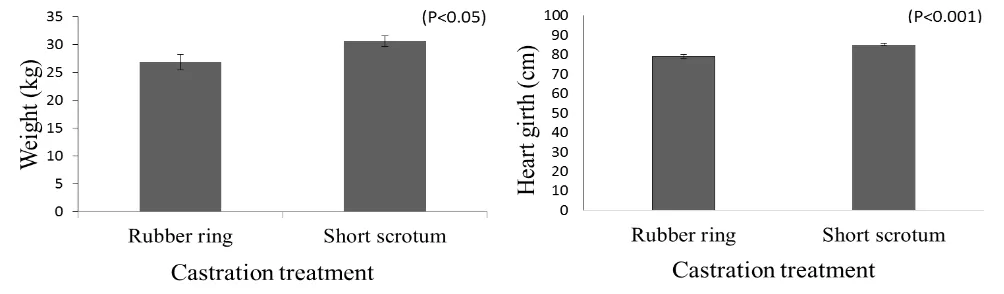
insemination much earlier than was previously possible, creating demand for semen from young sires as early as possible. Data from beef (Brito et al., 2007) and dairy (Dance et al., 2015) bulls show that offering bulls a high plane of nutrition in early life can hasten puberty onset. However, whether suboptimal performance in early life can be mitigated through improving plane of nutrition during the pre-pubertal period is unclear. The aim of this study was to examine the effects of plane of nutrition during the first and second 6 months of life on bull performance, scrotal circumference and age at puberty.
Material and methods Autumn-bornHolstein-Friesian bull calves (n=83) with a mean (±S.D.) age and bodyweight of 17
(±4.4) days and 52 (±6.2) kg, respectively, were blocked on age, bodyweight and sire and assigned to a high [H] or low [L] plane of nutrition for the first 6 months of life. Calves were individually offered milk replacer and concentrate using an electronic feeder. After five days acclimatisation H (n=37) and L (n=46) calves received 1200 g or 450 g of milk replacer, respectively. H calves were offered concentrate ad libitum while L animals received a maximum of 1 kg concentrates daily. Calves were weaned when consuming a minimum of 1 kg concentrates for 3 consecutive days, at a mean age (±S.D.) of 78 (4.4) days in H and 79 (5.8) days in L calves. Following weaning, H calves were offered ad libitum concentrates while L calves received 1 kg of concentrate daily. All calves had ad libitum access to hay. At 24 weeks of age, calves were re-assigned, within treatment, to either remain on their existing plane of nutrition or to change to the opposite diet, until puberty. This resulted in four groups: HH; HL; LL and LH (n=19, 18, 22 and 24, respectively). Animals were turned out to pasture at 26 weeks of age where HH and LH calves received grass and concentrate ad libitum while LL and HL calves received grass to appetite plus 0.5 kg concentrate daily. Animals were weighed weekly pre-weaning and fortnightly post-weaning. Scrotal circumference (SC) was measured every two weeks beginning at 15 weeks of age and electro-ejaculation commenced when a SC of 24 cm was reached. Puberty was defined as an ejaculate containing 50 million sperm cells with >10% motility. Data were analysed using mixed models ANOVA and orthogonal contrasts (SAS, version 9.3).
Results H bulls grew faster than L bulls during the first 6 months of life (P<0.001; Table 1). There was a pre x post 6
months diet interaction for average daily gain; growth slowed in bulls moved from H to L and accelerated in those moved from L to H. Diet affected weight at puberty during the second 6 months of life with HH and LH being heavier than either LL or HL (P<0.001). Bulls offered HH had a larger SC than LL at puberty (P<0.05). There was a tendency towards an interaction of diets pre and post 6 months, as bulls offered a H plane of nutrition during the first 6 months of life reached puberty 30 days earlier than L bulls (P<0.001) irrespective of diet post 6 months. There was no effect of plane of nutrition during the second 6 months of life on age at puberty (P= 0.35).
Table 1 Effect of plane of nutrition (PON) on growth and age at puberty in Holstein-Friesian bulls
PON pre 6 months High Low Significance1
PON post 6 months High Low Low High Pre Post Pre*Post
ADG Pre 6 months2 0.96 (0.03)a 0.96 (0.04)a 0.59 (0.03)b 0.60 (0.05)b *** NS NS
ADG Post 6 months2 1.60 (0.03)a 0.70 (0.05)b 0.96 (0.03)c 1.60 (0.03)a *** *** ***
ADG Overall2 1.24 (0.02)a 0.84 (0.02)b 0.57 (0.03)c 0.96 (0.03)b *** *** NS
Weight at puberty (kg) 404 (11.8)a 287 (6.52)b 269 (5.52)b 374 (15.0)a NS *** NS
SC at puberty (cm) 31 (0.52)a 29 (0.34)ab 28 (0.39)b 29 (0.74)ab * 0.06 NS
Age at puberty (days) 298 (6.3)a 283 (5.6)a 319 (3.9)b 323 (6.5)b *** NS 0.09
1*=P<0.05, ***=P<0.001. 2kg/day a, b= values within row with different superscripts differ significantly. ADG = average
daily gain; SC = scrotal circumference
Conclusion Feeding an increased plane of nutrition pre 6 months of age hastens puberty onset in dairy bulls. Bulls offered
a high plane of nutrition post 6 months did not reach puberty earlier than bulls restricted throughout life, despite having an improved growth rate and reaching live weights similar to those of unrestricted bulls.
Acknowledgements We acknowledge funding from the Department of Agriculture, Food and Marine. (Project 11/S/116) References
Brito, L.F., Barth, A.D., Rawlings, N.C., Wilde, R.E., Crews, D.H., Jr. Mir, P.S. Kastelic, J.P. 2007. Domestic Animal Endocrinology 33, 460-469
The effect of early life plane of nutrition on testicular development of Holstein Friesian bull
calves
A-M English1,2, C Byrne1,3, J Cassidy3, D A Kenny1,3, S Fair1
1Teagasc Grange, Dunsany, Co. Meath, Ireland, 2University of Limerick, Ireland, 3University College Dublin, Ireland
Application It is desirable for potential A.I bulls to reach puberty as early as possible and to have the capability of
producing high volumes of good quality semen early in life, which is dependent on early testicular development. This study demonstrates that early calfhood nutrition can advance testicular development in Holstein Friesian bull calves.
Introduction Developing sperm cells in the testes are supported by Sertoli cells; which are laid down in utero and from
birth to puberty. Sertoli cell numbers are directly correlated with adult testicular size and the rate of daily sperm production post puberty (Curtis and Amann, 1981). A high plane of nutrition during early calfhood has been shown to advance puberty in both dairy (Dance et al., 2015) and beef (Brito et al., 2007) bulls. The aim of this study was to examine the effect of plane of nutrition during the first 18 weeks of life on testicular development in Holstein Friesian bull calves.
Materials and Methods Holstein-Friesian (HF) bull calves with a mean (±S.D.) age and bodyweight of 19 (±8.2) days and 47.5 (±5.3) kg, respectively, were sourced from commercial dairy farms blocked on breed, age, sire and liveweight and subsequently assigned to either a high (H; n=10) or low (L; n=10) plane of nutrition. Calves were individually fed milk replacer and concentrates using an electronic feeding system. After five days acclimatisation, H calves received 1200 g of milk replacer daily, with concentrate ad libitum. L calves were allocated 450 g of milk replacer plus a maximum of 1 kg of concentrates daily. All bulls were weaned when consuming a minimum of 1 kg of concentrate for 3 consecutive days, at a mean age (±S.D.) of 82 (±3.9) days. After weaning, H calves were offered ad libitum concentrates, while L calves received 1 kg of concentrates daily. All bulls had daily access to approximately 0.5 kg of hay and ad libitum access to fresh water. At 126 days of age, the bulls were euthanized using an intravenous overdose of sodium pentobarbitone and testes were excised. The epididymides were removed and testes were weighed. Two sections of the parenchyma were dissected from each testis and fixed in formalin. Sections (5-µm thick) were stained using periodic acid-Schiff and assessed for outer seminiferous tubule (ST) diameter and stage of spermatogenesis. The outer ST diameters were quantified using an eyepiece micrometer at x400 magnification. Measurements were made on 20 different round tubules, selected at random from each testis. The sections were analysed for the most advanced stage of spermatogenesis at x1000 magnification. In the cross-sections of 20 ST per testis, the most mature sperm type was established using the methods of Curtis and Amann (1981).
Results H bulls grew faster and had a greater seminiferous tubule diameter than L bulls (Table 1). H bulls had a higher
percentage of spermatogonia denoted as the most mature cell type in spermatogenesis than L bulls. L bulls had a higher percentage of gonocytes and prespermatogonia.
Table 1 Effect of plane of nutrition on calf performance and testes development
Low High S.E.M. Significance1
Pre weaning ADG (kg) 0.43 0.73 0.04 ***
Post weaning ADG (kg) 0.57 1.46 0.11 ***
Slaughter weight (kg) 107.1 160.9 6.54 ***
Paired testes weight (g) 31.4 55.4 3.41 ***
Seminiferous tubule diameter (µm) 72.5 85.4 2.72 **
Gonocyte and prespermatogonia (%)2 57 31.5 ***
Spermatogonia (%)2 43 68.5 ***
ADG: Average Daily Gain 1** P<0.01; ***P<0.001; S.E.M: standard error of the mean. 2% seminiferous tubules with the
most advanced stage
Conclusion HF bull calves fed a H plane of nutrition from 2 to 18 weeks of age had greater testicular seminiferous tubule diameter and a greater percentage of seminiferous tubules with spermatogonia compared to calves fed a L plane of nutrition.
Acknowledgements We acknowledge funding from the Irish Research Council (Project GOIPG/2013/1391) and the Department of Agriculture, Food and the Marine (Project 11\S\116).
References
Brito, L.F., Barth, A.D., Rawlings, N.C., Wilde, R.E., Crews, D.H., Jr. Mir, P.S. and Kastelic, J.P. 2007. Domestic Animal Endocrinology 33, 460-469
Curtis, S.K. and Amann, R.P. 1981. Journal of Animal Science 53, 1645-57
Sero prevalence of reproductively important pathogens in beef cows on the island of Ireland
M H Parr1, P Doolan1, F Randi1,2, F Lively3, M G Diskin4, D Barrett5, D A Kenny1
1
Teagasc, Grange, Co.Meath, Ireland, 2University College Dublin, Ireland, 3Agri-Food and Biosciences Institute, Hillborough, Belfast, UK, 4Teagasc, Athenry, Co.Galway, Ireland, 5Department of Agriculture, Food and Marine, Co.Sligo, Ireland
Application Sero prevalence ofreproductively important pathogens such as leptospirosis, bovine viral-diarrhoea, infectious
bovine rhinotracheitis and neosporosis were determined for the first time in beef cows on the island of Ireland.
Introduction Numerous bacterial, viral and protozoan pathogens have been associated with poor fertility and abortion in cattle. Leptospirosis (hardjo-bovis and -prajitno genotypes), bovine viral-diarrhoea (caused by bovine viral-diarrhoea virus; BVDV), infectious bovine rhinotracheitis (IBR) (caused by bovine herpesvirus-1) and neosporosis (caused by Neospora caninum) are all transmissible diseases that are considered to be of economic importance in the international trade of animals and animal products. Each of these pathogens can lead to clinical disease that can have both direct and indirect effects on productive (Tiwari et al., 2007) and reproductive (Van Leeuwen et al., 2010) efficiency. Therefore the aim of the study was to quantify the sero prevalence of the above listed pathogens in both vaccinated and non-vaccinated herds across the island of Ireland.
Material and methods In the months of May through August of 2014 and 2015, a total of 5554 cows from 155 spring
calving suckler cow herds across the island of Ireland were blood sampled to measure the sero-prevalence of the above diseases. All cows were body condition scored (BCS) and were blood sampled from a coccygeal vessel with serum and plasma stored until subsequent laboratory analyses. All serum samples were tested for antibodies against the above listed pathogens using commercially available diagnostic tests at the Department of Agriculture, Food and Marine in the Republic of Ireland. Additionally a short questionnaire was carried with the herd owners to determine if cows were routinely, or had been previously vaccinated for leptospirosis, BVDV or IBR. There are currently no vaccines available for neosporosis in Ireland or Northern Ireland.
Results Percentage sero prevalence of leptospirosis, BVDV and IBR in both vaccinated and non-vaccinated suckler cow
herds sampled across the island of Ireland are shown in Table 1. Sero prevalence of leptospirosis, BVDV and IBR was 88%, 92% and 33% respectively in vaccinated herds. Sero prevalence of leptospirosis, BVDV and IBR was 71%, 78% and 44% respectively in non-vaccinated herds. Sero prevalence of neosporosis was 5% (289/5554) with a within-herd prevalence range of between 0 – 29%. Mean BCS ± s.e.m was 2.57 ± 0.01 for all cows sampled.
Conclusion The results from this study indicate, for the first time, the sero prevalence to leptospirosis, BVDV, IBR, and
neosporosis in both vaccinated and non-vaccinated beef cow herds on the island of Ireland. Further investigation will be required to determine the effect of these pathogens on reproductive and performance measures in these herds.
Table 1 Percentage sero prevalence of leptospirosis, Bovine viral-diarrhoea (BVDV) and infectious bovine rhinotracheitis (IBR) in both vaccinated and non-vaccinated herds
Acknowledgements We gratefully acknowledge support from the Department of Agriculture, Food and the Marine under
Bovine viral diarrhoea virus infection alters uterine prostaglandin profiles and inhibits
interferon tau initiated pregnancy recognition in cows
Z Cheng1, R Ellis1, A Abudureyimu2, F C Oguejiofor1, D C Wathes1
1Royal Veterinary College, Hertfordshire, UK, 2Life Science and Engineering College, Northwest University for
Nationalities, Lanzhou, China [email protected]
Application A high rate of early embryonic mortality leads to poor fertility in lactating dairy cows, which is, at least in
part, due to failed pregnancy recognition (PR). The situation is even worse if the cows are infected with the bovine viral diarrhoea virus (BVDV), which is currently highly prevalent in the UK dairy population. Understanding the mechanisms how BVDV interrupts PR will help prevent PR failure.
Introduction Poor reproductive performance, of which early embryonic mortality is a major component, causes significant
economic loss to the dairy industry. Embryonic mortality rates in cattle can be as high as 40%, with 70-80% of losses occurring before day 16 of gestation (Diskin et al. 2011). Evidence has shown that early embryonic mortality in cows can be caused by failed PR and BVDV infection (Grooms 2014). Prostaglandins (PG) play important roles in many reproductive processes, including luteolysis, pregnancy recognition and implantation. The aims of the present study were to investigate the effect of BVDV infection on uterine PG production and PR using an in vitro endometrial PR model.
Material and methods Fresh and apparently healthy uteri from 10 BVDV free cows in the early luteal phase of the
oestrous cycle were collected at the local abattoir. Uterine endometrial cells (a mixture of primary epithelial and stromal cells) were isolated and cultured and half the cultures were infected with non-cytopathic BVDV (ncpBVDV) for 4 days following the methods described previously (Oguejiofor et al. 2015). Four days after infection the cells were treated with 0 or 100 ng/ml interferon-tau (IFNT) for 24 h. PGF2α and PGE2 concentrations in the spent medium were measured using
radioimmunoassays. Data were expressed as mean ± SE. Statistical analysis was carried out using analysis of variance with repeated measure via a linear mixed effect model built in SPSS version 23.
Results The cultured uterine endometrial cells produced a significant amount of PGE2 and PGF2α (Table 1). Compared with the control, IFNT challenge significantly stimulated PGE2 production (P<0.05). However, in the cells infected with the
ncpBVDV, this stimulatory effect was neutralised (P>0.05) and the PGF2α concentration was lower than in the control cells (P<0.05). ncpBVDV infection alone significantly increased PGE2 and decreased PGF2α production (P<0.05), leading to an increased PGE2:PGF2α ratio (P<0.05). Both IFNT and IFNT+ncpBVDV treatments appeared to increase the ratio of PGE2:PGF2α and IFNT appeared to decrease PGF2α production, but the differences were not statistically significant due to large variations between animals (P>0.05).
Table 1 Effect of ncpBVDV infection ± IFNT treatment on PG production by cultured uterine endometrial cells#
Treatment PGE2 (ng/ml) PGF2α (ng/ml) PGE2:PGF2α
CONT 4.8 ± 0.55b 13.3 ± 2.27a 2.5 ± 0.82b
IFNT 9.3 ± 1.78a 11.2 ± 1.75ab 5.0± 2.15ab
ncpBVDV 10.8 ± 2.35a 10.2 ± 1.47bc 6.1 ± 1.83a
IFNT+ncpBVDV 3.9 ± 0.40b 9.0 ± 1.59c 4.3 ± 1.42ab
# The complete experiment was replicated using cells from 10 individual cows. Within columns a>b>c, P<0.05-0.01.
Conclusion Our study suggests that BVDV infection may impair PR by 1) inhibiting the effect of IFNT on uterine PG
production and 2) inducing an endocrine switch of PG production from PGF2α to PGE2. This in turn is predicted to decrease
uterine immunity, so potentially predisposing the animals to uterine disease.
Acknowledgements We wish to thank Dr. N.L. Poyser, University of Edinburgh for his generous gift of PGE2 and PGF2α antibodies and Prof Joe Brownlie and Miss D Olivia L Anstaett, Royal Veterinary College, London for providing the ncpBVDV for this study. The work was supported in part by the Commonwealth Scholarship Commission.
References
Diskin et al. 2011 Reproduction, Fertility and Development 24, 244-251.
Interaction of preimplantation factor with the bovine global endometrial transcriptome
R E Clamp1, C Creevey1, M Natoli1, E R Barnea2,3, D Nash1, M T Rose1
1
IBERS, Aberystwyth University, Ceredigion, UK, 2SIEP The Society for the Investigation of Early Pregnancy, Cherry Hill, New Jersey, USA, 3BioIncept LLC, Cherry Hill, New Jersey, USA
Application This is the first study to show that preimplantation factor (PIF) interacts with the bovine endometrial
transcriptome, paving the way for future research to investigate the importance of PIF in bovine pregnancy.
Introduction Preimplantation factor (PIF) is a novel peptide secreted from viable embryos as early as the 2 cell stage.
Synthetic PIF (sPIF) has been shown to interact with human endometrial stromal cells in culture through three distinct pathways relating to the implantation and acceptance of the embryo by the maternal immune system (Paidas et al., 2010). There is limited knowledge related to bovine PIF, although it has been determined that the peptide is secreted by viable embryos and detectable in maternal serum (Ramu et al., 2013; Stamatkin et al., 2011). The present preliminary study aimed to improve the current knowledge on the interaction of sPIF with the bovine endometrium through RNA-sequencing.
Material and methods Endometrium from bovine heifer uteri (n=4), in the follicular stage of the oestrous cycle, were
sampled and intercaruncular tissue explants from each replicate were cultured with or without sPIF (100 nM) for 24 hours. Medium was replaced with fresh medium containing sPIF (100 nM) for a further 6 hours. At the end of the incubation, tissue was stored in RNA later and total RNA subsequently extracted and quality assessed. Extracted RNA that was of a suitable quality was subjected to library preparation for RNA sequencing on the Illumina HiSeq 2500 platform. Following sequencing, a previously described data analysis workflow was adapted for the sample set to determine differentially expressed genes (DEG) and biological pathways modulated by sPIF treatment (McCabe et al., 2012). A p-adjusted value of less than 0.1 was used to determine statistically significant differential expression in the transcript data set.
Results A total of 60 DEG were identified, with 16 down-regulated and 44 up-regulated following treatment with sPIF;
however, none showed greater than 2 fold change in expression. There was a strong influence of animal replicates on the data variance, with the native gene expression differing between animals. sPIF treatment up-regulated several genes shown to be important in the endometrium, such as OXTR (oxytocin receptor); PTGER2 (prostaglandin E receptor 2) and IL6R (IL-6 receptor). Furthermore, LEF1 (lymphoid enhancer-binding factor 1) and ITGA2 (integrin alpha-2), shown to be up-regulated in human endometrium following sPIF treatment were also upup-regulated in the bovine samples. Six biological
pathways were over represented in the set of DEG following sPIF treatment (P<0.01) such as the ‘Immunoregulatory
interactions between a lymphoid and a non-lymphoid cell’. The KEGG pathway ‘Biosynthesis of unsaturated fatty acids’
was also over represented following sPIF treatment, through upregulation of genes coding for the enzymes fatty acid desaturase 1 and 2.
Conclusion This preliminary study showed that sPIF interacts with the bovine endometrial transcriptome, although the
response appears to be relatively weak compared to that identified in humans. Bovine homologs of genes altered by sPIF in the human endometrium were upregulated, however only 2 genes of the 60 DEGs were in that set. The tissue used in the present study was non decidualized endometrial tissue, sPIF may have a greater effect on the pregnancy primed bovine endometrium and future work will reveal if it may show a more similar response to that observed in human studies.
Acknowledgements The authors gratefully acknowledge Aberystwyth University for DCDS studentship funding and Randall Parker Foods for sample collection.
References
McCabe, M., Waters, S., Morris, D., Kenny, D., Lynn, D. and Creevey, C. 2012. BMC Genomics 13, 193.
Paidas, M. J., Krikun, G., Huang, S. J., Jones, R., Romano, M., Annunziato, J. and Barnea, E. R. 2010. American Journal of Obstetrics and Gynecology 202, 459 e1-8.
Ramu, S., Stamatkin, C., Timms, L., Ruble, M., Roussev, R.G. and Barnea, E.R. (2013). Reproductive Biology and Endocrinology 11, 105.
The effect of dietary omega-6 and omega-3 fatty acid supplementation on semen volume and
quality in young post-pubertal dairy bulls
C Byrne1, A-M English1,3, S Fair3, P Lonergan2, D A Kenny1
1Animal & Grassland Research and Innovation Centre, Teagasc Grange, Dunsany, Ireland, 2School of Agriculture and
Food Science, UCD, Ireland, 3Department of Life Sciences, University of Limerick, Ireland [email protected]
Application Supplementation with dietary polyunsaturated fatty acids does not lead to an improvement in gross in vitro semen quality parameters.
Introduction Sperm utilise polyunsaturated fatty acids (PUFA), in particular n-3 and n-6 PUFA, to maintain normal cell
membrane function (Wathes et al., 2007). As ruminants lack the desaturase enzymes which allow de novo synthesis of such fatty acids, they require dietary supplementation (Mattos et al., 2000). Recent work has shown some positive effects of dietary supplementation of n-3 PUFA on semen quality in rams (Fair et al., 2014) and bulls (Gurler et al., 2015); however, published data on bulls are limited. The aim of this study was to examine the effects of dietary supplementation with both n-3 and n-6 PUFA on semen volume and aspects of semen quality in young post-pubertal dairy bulls.
Material and methods Holstein-Friesian (n=43) and Jersey (n=7) bulls with a mean ± s.e.m. age and bodyweight of 420.1
± 5.86 days and 382 ± 8.94 kg, respectively, were blocked on breed, weight, age and semen quality (motility and concentration per ml; based on two pre-trial ejaculates) and randomly assigned to one of three diets, namely (i) a non-supplemented control (CTL, n=15), (ii) rumen protected safflower (n-6 PUFA, n=15), or (iii) rumen-protected n-3 PUFA-enriched fish oil (n-3 PUFA, n=20). Both fats were added at 2% of dietary dry matter (DM) and all three diets were isonitrogenous (160g/kg crude protein). Diets included: 25% rolled barley, 20% maize, 15% soyabean, 17% beet pulp, 12% soy hulls, 4% oil, 2% minerals, 5% molasses. Animals were housed in a slatted-floored shed and fed individually, for the initial 6 weeks, using an electronic feeding system (Calan Inc., Northwood, New Hampshire). Animals were allowed two weeks acclimatisation to the facility followed by ten days acclimatisation to the diets, and were then offered diets ad libitum for 12 weeks. All animals were offered 5 kg (fresh weight) of grass silage daily. Semen was collected via electro-ejaculation (Pulsator, Lanes, CO, USA) at weeks -2, -1, 0, 10, 11 and 12 relative to the beginning of the trial period (week 0). On collection, semen volume and progressive linear motility (PLM), assessed using a phase contrast microscope with a heated stage, were recorded. Sperm concentration was measured using a photometer (Minitub, Germany) calibrated for bovine semen. Semen was then diluted to 80x106 sperm per ml in Bioxcell (IMV, L'Aigle, France) and loaded into 0.25 ml
straws (IMV, L'Aigle, France). Straws were cooled gradually from room temperature to 4˚C over a period of 90 min and allowed to equilibrate at 4˚C for 3 h. They were then frozen to -140˚C over 9 min (-15.5˚C/min) in a programmable freezer
(Planar, Birmingham, UK) followed by immersion and storage in liquid nitrogen until use. Post-thaw PLM (n=1 straw per
collection for each bull) was assessed as described earlier, after thawing by immersion into a beaker of water at 37˚C. Data
were analysed by repeated measures ANOVA (PROC MIXED, SAS, version 9.3). Fixed terms for diet and week along with their interactions, where appropriate, were included in the model. Week was included in the analysis as a repeated term.
Results All values represent mean ± s.e.m. Concentrate intake across the three diets did not differ with bulls on the CTL,
n-6 PUFA and n-3 PUFA diets consuming; 9.54 ± 0.37 kg, 9.54 ± 0.31 kg, 9.34 ± 0.35 kg DM respectively. The average daily gain between diets was also similar, with CTL, n-6 PUFA, n-3 PUFA bulls gaining 1.4 ± 0.19, 1.4 ± 0.17 and 1.6 ± 0.29 kg per day, respectively. No effect of week was detected after 70 days feeding; therefore, these data (three successive collections beginning on week 10), were pooled. There was no effect of diet (P>0.05) on semen concentration, PLM or drop in post-thaw PLM (Table 1.). Throughout the trial period, the average volume of semen collected at each ejaculation did not differ between diets (P>0.05).
Table 1 Effect of dietary treatment on semen volume and quality after 10 weeks feeding (average of three collections)
Treatment
CTL n-6 PUFA n-3 PUFA SEM P-value
Volume (ml) 42438 42434 42435 0.15 0.64
Concentration (x106) 1069.3 1139.3 1132.7 40.65 0.83
PLM (%) 28703 29983 28550 1.32 0.39
Drop in PLM post- thawing (%) 20.0 42513 42417 1.85 0.50
Conclusion Dietary supplementation with either n-3 or n-6 PUFA to young post-pubertal bulls had no effect on semen
volume or gross measurements of semen quality. Further investigation into post-thaw in-vitro quality parameters of sperm from these treatment groups is on-going.
Acknowledgements We gratefully acknowledge support from the Department of Agriculture, Food and the Marine under the Research Stimulus Fund (Project 11/S/116)
References
The development of a UK national terminal combined breed genetic evaluation
K L Moore1, S Boon2, K Kaseja1
1
SRUC, Bush Estate, UK, 2Signet Breeding Services, Kenilworth, UK [email protected]
Application The development of a UK terminal combined breed genetic evaluation (CBGE) will enable, for the first time,
accurate genetic evaluations for cross bred animals. In addition, it will provide an improved service to the UK sheep industry allowing more frequent genetic evaluations. Both these aspects will help to engage farmers, resulting in increased use of Estimated Breeding values (EBVs) and ultimately improving the genetic progress of the UK sheep industry.
Introduction UK genetic evaluations of sheep have traditionally been undertaken within breeds. However, the UK sheep industry is a mostly stratified system with approximately 56% of ewes in the national flock being crossbred. This represents a 6% increase in the past decade (Pollott et al (2012); Pollott and Stone (2003)). This shift has also been noticed in the rams that are used in the national flock. The recent sheep census found that 5% of rams used in the national flock were crossbred. Increasingly, breeders are incorporating crossbred sheep into genetic improvement systems, and it is then not surprising that requests for combined breed EBVs from these cross-breeding flocks have also increased. CBGE allows multiple breeds of sheep to be evaluated simultaneously and animals from different breeds to be compared directly via the resulting EBVs. The benefits of CBGE are that they can accelerate genetic improvement as they increase the accuracy of EBVs (more data is included in the analysis) and allow more intense selection (as the gene-pool to select the next generation can be substantially widened as a result of CBGE and the increased EBV accuracy). Rates of genetic improvement can also be increased indirectly by the ability to provide a more efficient service. At the moment, genetic evaluations are run 3-4 times a year for individual breeds. In a combined-breed scenario only 1 genetic evaluation is required to service many breeds. Therefore, it will be possible to provide up-to-date genetic evaluations more frequently, meaning that breeders always have up-to-date information when they are making their selection decisions. This will help to engage more farmers in performance recording and result in farmers making better use of EBVs, ultimately improving the genetic progress of the national sheep industry.
Material and methods To enable CBGE accurate knowledge of the breed make up is required and full details of this are
reported in Kaseja et al (2016). The biggest changes to the genetic evaluation system were genetic groups, genetic parameters and the inclusion of heterosis and recombination coefficients to account for hybrid vigour. Previously genetic groups were defined based on gender and year of birth, and varied depending on the breed. In the new system a breed element was incorporated to allow animals of different breeds to be separated. Initially, the genetic group definitions have remained the same as those used in the within breed evaluations. Previously each within breed evaluation had their own set
of genetic parameters, however in the CBGE we can only use one set of parameters and a ‘best-fit’set of parameters was determined after considering the individual parameters from the within breed evaluations and phenotypes scaled based on the different phenotypic variances. As heterosis/recombination coefficients between all breeds are impractical for computational reasons, two approaches are being considered. The first is to group individual breeds into 3 breed types; European terminal, British terminal and non-terminal, and estimate coefficients for the different breed type combinations. The second is to determine the coefficients on an individual breed basis, but assume the heterosis/recombination effects are the same regardless of breed, and sum the coefficients into a single term.
Results Twelve common terminal breeds were combined to make up the terminal CBGE; Texel, Suffolk, Charollais,
Meatlinc, Hampshire Down, Beltex, Dorset, Shropshire, Blue Texel, Blue du Maine, Vendeen and Southdown. The terminal CBGE runs in approximately 22 hours from extraction, to analysis and then post processing ready for publication. Given it would take approximately 48 hours to run all 12 breeds individually, this represents a saving of 104 hours in a year, assuming all breeds are run 4 times a year. This can result in an extra 4-5 CBGE in the year without using any more resources. Initial quality assurance of the results produced from the terminal CBGE has shown between 0.7-0.95% correlation in EBVs when comparing purebred animals, although the most benefit will come from having EBVs for cross bred animals which were previously unavailable.
Conclusion The system for CBGE has been developed and it is planned to run the within and combined breed systems in parallel in 2016 before fully implementing the CBGE for terminal breeds in 2017.
Acknowledgements The authors gratefully acknowledge AHDB Beef and Lamb for funding and Signet performance
recording for the use of the data.
References
Kaseja, K., Boon S. Moore, K.L. 2016. Advances in Animal Biosciences 7(1), 13. Pollott G. et al 2012. AHDB report
Gene pool fishing by out-crossing and back-crossing cycles to accelerate genetic improvement in
carcass traits of sheep
L Bunger1, G Fell2, K McLean1, J Gordon1, K L Moore1, N R Lambe1
1SRUC, Edinburgh, UK, 2MeatLinc, West Grange, Thorganby, York, UK
Application The enormous potential of outcrossing and composite breeding is currently mostly unused in the UK sheep
industry, largely due to the shackles of breeding society rules. However, its exploitation could have a large impact on the economy of the UK sheep industry, as it brings the best of breeds together, increases genetic variance and heterozygosity and thereby accelerates genetic progress. This project is a blueprint and a cost-efficient demonstration for employing genetic progress made in other breeds to further enhance the performance of a developed terminal sire breed on a reasonable budget.
Introduction There are ~90 recognised breeds of sheep in the UK (Pollott, 2014), which represent a vast gene pool. The wide genetic variation between breeds is largely under-exploited. Improvements in the productivity of sheep are needed, and out-crossing using composite breeding provides solutions with a large impact, bringing the best of breeds together,
increasing genetic variance and heterozygosity and accelerating genetic progress. The UK’s many sheep breeds and their variation allows the introduction of valuable alleles from one breed into another (target breed) where these alleles do not segregate or do so at very low frequencies. This can be done using molecular genetic methods, e.g. marker assisted
selection. However, this is usually expensive and requires knowledge of the trait relevant genes/QTL. Also, there are too few known genes and these explain only small proportions of the genetic variance, a situation that will not change in the next few years by the use of SNP chips or sequencing. A cost effective approach to improve a target breed using unknown genes is using a system of out-crossing followed by backcrossing (to re-establish the typical breed characteristics), whilst keeping useful alleles from the ‘donor’ breeds. The main focus in terminal sire (TS) breeds is on muscle growth and -shape.
Material and methods An open composite breeding system with outcrossing to Charollais (CH) and Texels (TX) followed
by repeated backcrossing has been used to further develop a terminal sire breed (MeatLinc, ML) to become superior to other TS Breeds. This genetic approach, paired with the exploitation of computer tomography (CT), will retain the newly captured muscling alleles. Additional CT traits (not presently available as selection traits via SIGNET) for TS, e.g. muscling, spine traits, killing out % and lean meat %) have also been measured on all male selection candidates, with the potential to include these traits in future selection. The initial outcross (F1), was followed by a cross of the two crossbred types (F2, MLxTX and MLxCH), an inter-se mating between these (F3) and a backcross to ML ewes (F4, lambs born 2015). All available ram lambs (n=43; expected gene contribution 75% ML, 12.5% TX, 12.5% CH) were scanned ultrasonically and using CT at about 132d and 155d, respectively. To shorten the generation interval in the newML line, ewe lambs and ram lambs were used for breeding. In 2015, in both the new and oldML lines, mature ML ewes served as mothers, allowing a initial comparison, which was somewhat restricted, since ram lambs from the oldML were strongly pre-selected to go forward to CT scanning, whereas all available ram lambs from the newML were used. ProcGLM from SAS was used for the statistical analysis. Data were adjusted for live weight.
Results The LS-means and their standard errors (SE) for CT traits in both linesare shown in Table 1.
NewML have slightly less fat, P=0.15) but significantly more muscle. They have a significantly (P = 0.045) KO_P, they are slightly leaner and have a higher muscle percentage (results not shown). There is a significant improvement of the LM_P by 1%, which is an indicator of economic return and carcass waste. NewML would be more superior if a similar pre-selection would have been applied as among the
Conclusion A system of outcrossing and repeated backcrossing with an accurate and stringent phenotyping screen (here
CT) is a cost-effective way to improve the performance of a TS breed using genetic variants in other developed breeds.
Acknowledgements Supportive funding of this project from Innovate UK is much appreciated. References
Table 1 Initial comparison New ML vs. Old ML
NewML OldML
Determining accurate proportion of breed make up of UK sheep to enable combined breed
genetic evaluations
K Kaseja1, S Boon2, K L Moore1
1SRUC, Bush estate, UK, 2Signet Breeding Services, Kenilworth, UK
Implications Creating the Proportion of Breed (PEB) value for each sheep allows to calculate accurate EBVs (Estimated
Breeding Values) from a terminal combined breed genetic evaluation, which will satisfy the increasing appetite for combined breed evaluations as a result of the increasing levels of cross breeding in the UK sheep industry.
Introduction The UK sheep industry has a stratified structure with specific breed types and crosses; i.e. hill breeds in the
uplands and terminal breeds in the lowlands. Pollott (2012) reported that the amount of cross breeding is increasing indicating that about 56% of all ewes in the national UK flock were crossbred. This along with increased pressure from breeders who performance record has meant that development of a combined breed analysis is required for the national genetic evaluations. In order to provide a national combined breed evaluations accurate knowledge of the breed makeup is required to enable heterosis and recombination coefficients to be calculated and fitted in the model, resulting accurate EBVs of cross bred animals.
Material and methods The UK National genetic evaluation system for sheep has traditionally been undertaken on a within
breed basis. A fundamental step to produce EBVs for the combined breed genetic evaluation is correct knowledge of the animals breed make up. Currently, in the BASCO (Beef and Sheep Company) database, an animals breed is recorded as
‘breed 16ths’ and can include up to 4 different breeds. The composition of all 4 breeds must sum up to 16. This record is
not suitable for the combined breed analysis as it does not allow precise recording of the breed make up or allow additional breeds as animals become increasingly crossbred. Consequently, EGENES created a system to calculate a PEB value for every animal. The PEB values sum to 100% and currently contains between 1 (for pure breed animals) and up to 12 (although more is possible) different breeds for each animal. The procedure of obtaining the PEB values is fully automated, with the values calculated each day as a part of a snapshot taken from the BASCO database. PEB are obtained by a cycle of iterations starting with the oldest animals iterating to the youngest, where at the end all animals have a PEB value. For all animals the PEB is calculated as half the PEB of the sire + half the PEB of the genetic dam. However, where both or one parents are not known some assumptions are applied. If both parents are unknown, then providing a valid breed 16th is supplied then the PEB will be based on the breed 16ths, alternatively the animal will be assumed to be 100% of the breed code associated with that animal. In the case on one parent known and the other unknown, then again the breed 16th value
of the animal, if valid, will be adjusted to subtract the PEB of the known parent and then used to determine the breed of the unknown parent. For example, if the breed 16th is 8 Suffolk and 8 Texel, the animal is a Suffolk*Texel cross, if the known parent has a PEB of 100% Texel then we can deduce that the unknown parent must have been 100% Suffolk. Alternatively if the breed 16th is not available, then the unknown parent is assumed to be 100% of the breed code associated with the
animal.
Results Considering performance recorded animals born 2010-2014, the
largest purebred (PEB>87.5% of breed) terminal breeds were Texel, Suffolk, Charollais and Hampshire Down with 49%, 20%, 17% and 4% of purebred animals recorded in BASCO coming from these breeds, respectively. The remaining 10% of purebred terminal animals came from 13 other breeds. Animals were assumed to be a terminal first cross if the PEB were approximately 50:50%. The most numerous first crosses are shown in Table 1. As can be seen, majority of 1st cross animals are Texel*Charollais and
Texel*Suffolk, namely the crosses between the biggest recorded breeds. A further 21% of first cross terminal animals are included in a further 58 first
cross combinations indicating the large diversity of cross breeds in the UK sheep industry.
Conclusion The breed make up in the current national sheep population support the need for combined breed genetic
evaluations. This new method of determining PEB will provide more accurate EBVs and enable better selection decisions to be made when choosing crosses and the animals mated for crossing. Moreover, the frequency of evaluations could increase from 3-4 per breed per season to monthly for all recorded animals, which undoubtedly will be the benefit to all breeders.
Acknowledgements The authors gratefully acknowledge AHDB Beef and Lamb for funding and Signet performance recording for the use of the data.
References
Pollott G. et al 2012. The breeding structure of the British sheep industry
Table 1 Percentage of 1st cross animals
A comparison of the reproductive performance of Lleyn and Scottish Blackface ewes mated to
same-breed rams and managed together post-mating in a Scottish hill farm
P Zhou1,2, N Sargison2, N R Lambe1, C Morgan-Davies1, T McEvoy1
1SRUC, Edinburgh, UK, 2University of Edinburgh, UK
Application The aim of this work is to investigate breed substitution versus breed improvement in a hill sheep system.
Lleyn ewes producing pure-bred Lleyn lambs could potentially improve output and profitability of hill sheep enterprises.
Introduction One of the major constraints of hill sheep breeds such as the Scottish Blackface (BF), is low productivity,
and most hill sheep farming systems are not financially viable without support. Lleyn sheep, a more prolific lowland/upland breed, might improve output and profitability of hill sheep enterprises. However, harsh hill environments and poor nutritional supply in such conditions could compromise their reproductive performance, leading to high barren rates and low lamb birth weights, the latter a key factor for lamb survival (Dwyer, 2008). The aim of the current study was to investigate the effects of a harsh hill environment on the reproductive performance of Lleyn ewes, comparing lambing outcomes with those of BF sheep (2 lines) in the same environment.
Material and methods This 2014-2015 study was part of an ongoing project at SRUC’s Hill & Mountain Research Centre
(56⁰N, 4⁰W; elevation: 200 to 1025 m; mean annual rainfall: 2528 mm). The flock comprised approximately 150 control line BF ewes, 150 selection line BF ewes (Conington et al., 2006) and 150 Lleyn ewes. One management system was applied to all ewes, with winter feeding levels tailored to individual weight changes. Lleyn x Lleyn & within-line BF x BF mating was from mid-November for two oestrous cycles; ewes were ultrasound-scanned in mid-February and ewe live weights (LWT) and body condition scores (BCS) recorded pre-mating and at scanning. Two supplementary feeding levels (low/high) were applied from January 8th to lambing, initially on the basis of LWT change (versus a target LWT change
adjusted for pre-mating LWT and BCS) and, after scanning, number of foetuses carried. Lambing data recorded included litter size and weight, lamb weight and gender. Data analysis used a Generalized Linear Model (GenStat 16; VSNi). Terms in the model for analysis of ewe litter weight data were genotype, ewe scanning LWT, feeding level and ewe age.
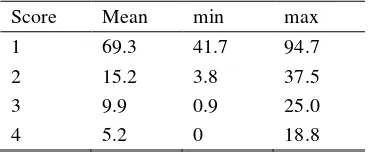
Results Barren rates among control BF, selection BF and Lleyn ewes were proportionately 0.17, 0.12 and 0.06,
respectively. Among ewes lambing, control BF had the highest incidence of singletons (0.60) while selection BF had the highest incidence of twins (0.54). Litter weights, as recorded, are in Table 1. In the analysis, litter weight was influenced by ewe genotype (P<0.001), ewe age (P=0.016) and post-scanning feed level (P<0.001). Litter weight was positively associated with LWT at scanning (P<0.001). Of lambs born to control BF, selection BF and Lleyn ewes, proportionately 0.75, 0.76 and 0.87, respectively, weighed more than 3 kg at birth. Incidence among twins is illustrated in Figure 1. Among singles and twins, incidence of birth weight above 5 kg was 0.03, 0.03 and 0.13 for control BF, selection BF and Lleyn, respectively. Perinatal mortality incidence did not differ among genotypes (control BF: 0.12; selection BF: 0.10; Lleyn: 0.10).
Table 1 Overall mean ± sem litter weights (kg) at birth for singleton,
twin, triplet and quadruplet offspring of control BF, selection BF and Lleyn ewes
Genotype Control BF Selection BF Lleyn
Singleton (n) 4.2 ± 0.10 (65) 4.1 ± 0.10 (55) 4.6 ± 0.10 (80)
Twin (n) 6.8 ± 0.19 (42) 7.1 ± 0.15 (66) 7.3 ± 0.16 (66)
Triplet (n) 9.6 ± 0.35 (2) 7.4 ± 1.26 (3) 9.2 ± 0.80 (4)
Quadruplet (n) - (0) - (0) 13.2 (1)
Conclusion This preliminary study indicates that, on the basis of litter weight, the Lleyn genotype can produce lambs of
sufficient birth weight (above 3 kg) to emulate BF counterparts in a harsh hill environment. While the data also show that selection BF ewes achieved higher twin-bearing and lower barren rates compared to control BF counterparts, a notable feature of the investigation was the productivity of Lleyn ewes. Of course, these results are from one season, so future investigations will further assess the comparative resilience and reproductive competence of Lleyn ewes and their offspring.
Acknowledgements Research funded by Scottish Government’s RESAS Strategic Research Programme 2, 2011-2016 (Food, Land and People). PZ is supported by SRUC Trust funding (PhD Studentship).
References
Conington, J., Bishop, S.C., Lambe, N.R., Bünger, L. and Simm, G. 2006. Animal Science 82, 445-453.
Figure 1 Incidence (%) of twin-bearing ewe
Investigating the measurement of feed efficiency in sheep
N R Lambe, L Bunger, J Conington, K L Moore, M P Coffey SRUC, Edinburgh, UK
Application Recording feed intake in sheep could enable feed efficiency to be included as a goal in UK breeding
programmes. This could lower production costs, or allow more sheep meat to be produced from a given area of land.
Introduction Sheep produce meat from grazing land that is often marginal and unsuitable for other agricultural production.
High quality grazing is limited in most systems, at least seasonally, and supplementary feed is provided at key times. Feed and forage are the most significant costs across different UK sheep production systems. Producing sheep that use feed more efficiently for growth and reproduction could lower feed costs, or allow more sheep to graze per hectare of land. Livestock feed efficiency (FE) impacts on land use and methane emissions, as well as productivity and profitability. Genetic improvements in FE are expected to help meet these challenges, but many knowledge gaps exist in the best methodology to enable this. To allow genetic selection, genetic parameters must be estimated in a relevant breed. However, there is no current method to measure individual feed intake at pasture with sufficient accuracy for use in a breeding programme. Technological advances in electronic identification of animals and computer-controlled feeding equipment present an opportunity to measure individual feed intake during performance trials in growing lambs. However, the best methodology to use such equipment to allow full expression of feeding behaviour in sheep should be investigated in a relevant system and breed. Relationships with feed intake on pasture and feed intake in mature ewes should also be examined. The objective of this study was to investigate the best way to record feed efficiency in sheep for use in future genetic selection.
Material and methods A desk-based review was undertaken, to assess available technical solutions and methodological
approaches to measure and select for FE in sheep. A literature review on FE in sheep (and beef cattle) was produced, concentrating on the use of automated feeders to record feed intake. Other information sources included reports from visits by academic and industry representatives to relevant companies in the USA and Netherlands, and e-mail communications with a research group in New Zealand that is designing a similar experiment in a maternal sheep breed. The resulting review summarised current knowledge and published research, considering installation of recording equipment, recording of feed intake and related traits, and incorporation of FE into a sheep breeding programme.
Results Evidence exists in the literature of variation in FE traits in sheep (Table 1). Moderate heritabilities have been estimated for FE traits in growing sheep (Pulina et al., 2013), as in cattle. Methodological recommendations for using automated feeders to record lamb feed intake include: 9-11 lambs/feeder; 1-2 week adaptation period; 6-8 weeks on test; a forage-based diet. This information could provide a relevant starting point for UK trials. To incorporate FE into a breeding programme, individual feed intake records would be required from 1000-2000 animals at the same stage of development, for robust genetic parameter estimation. Selection for (residual) feed intake should only be
Table 1 On-test differences between groups of growing
considered as part of a multi-trait selection index, since evidence suggests that selection for FE could reduce fatness and may delay maturity. Findings from cattle studies suggest that selection for FE in young growing animals (using automated feeders and a pelleted diet) affects growth and FE on pasture and FE of mature females (Herd et al., 1998).
Conclusion Potential exists to record feed efficiency in individual sheep. Metrological research is required to refine feed intake measurement methods, to allow FE to be assessed in sufficiently powerful samples of relevant UK sheep breeds from grass-based systems. Genetic relationships with other important traits should be investigated to allow recommendations for the incorporation of FE in UK sheep breeding programmes. This is likely to require industry-wide collaboration.
Acknowledgements SRUC received funding from the Scottish Funding Council and Scottish Government. References
Archer J.A., Reverter A., Herd R.M., Johnston D. and Arthur P. 2002. Proc. 7th WCGALP, Montpellier 221-225 Cockram, R.R., Stobart, R.H., Lake, S.L. and Cammack, K.M. 2013. Small Ruminant Research 113, 313-322
Herd R.M., Richardson, E.C., Hegarty R.S., Woodgate, R., Archer J.A. and Arthur P.F. 1998. Proc. Australian Society of Animal Production 22, 137-140
Johnson P.L., Miller S.P. and Knowler K. 2015. Proc. AAABG, Lorne, Victoria, Australia