F O R W A R D
Estimates of the number of individuals among key populations at higher risk for HIV exposure (KP) are essential to advocate for resources, prioritize prevention and other programmatic activities among groups, predict the number of persons living with HIV (PLHIV) and the impact of the HIV epidemic through modeling, and assess program coverage. Population size estimates (PSEs) are an important component of surveillance as well as monitoring and evaluation.
Ministry of Health has started the population size estimation (PSE) since 2002. The PSE methods were kept updated and being improved for obtaining better result. Report of Size Estimates HIV of Key Population in 2016 is a renewal of the report of Size Estimation of Key Affected Population in 2012 issued by the Ministry of Health in year of 2014. This report describes a comprehensive situation and can understand in relation to the size of key affected population up to district level.
The estimation results in 2012 showed that there were 7.4 to 10.2 million people with a median value around 8.8 million key population. The results of these estimates were then included in the calculation of estimation and projections of HIV/AIDS in Indonesia
in 2011-2016. The 2016 PSE exercise was resulting final population size estimate of
FSW, MSM, Waria, PWID, and Clients of FSW and Waria which the highest size estimate is clients of FSW which account for 5 million, and the smallest size estimates is PWID which account only 33 thousand. The results of these estimates are also then included in the calculation of estimation and projections of HIV/AIDS in Indonesia in 2015-2020.
The process of size estimation of the key population has gone through a long and complex process involving a variety of associated partners. This estimation methodology and results have been reviewed by a group of experts and presented to stakeholders. The results of the reviews stated that with all the limitations that exist in the calculation of this estimate, the result is the best result that can be obtained with the data available at the time the calculation is done.
CONTRIBUTOR LIST
WORKING GROUP
Anak Agung Sagung Sawitri - WHO/Consultant; Ari Wulan Sari – Ministry of Health; Dwi Rahmadini- National AIDS Comission; Irma Siahaan –National AIDS Comission; Lely Wahyuniar –UNAIDS; Leonita Agustine—UNAIDS; Muhardi Kahar –National Statistic
Office; Rizky Hasby –Ministry of Health; Sigit Ari Saputro – Airlangga University; Yori
Novrianto –FHI 360.
WRITER
Anak Agung Sagung Sawitri– WHO/Consultant
REVIEWERS
Siti Nadia Tarmizi – Ministry of Health; Endang Budi Hastuti – Ministry of Health; Triya Novita Dinihari – Ministry of Health; Irawati Panca – Ministry of Health;Gerald
Jacobson – WHO/Consultant; Lisa G. Johnston – FHI360/Consultant; Dongbao Yu – WHO; Taoufik Bakkali – UNAIDS; Fetty Wijayanti – WHO; Geoffrey Nan Li – UNICEF;
Caroline Francis – FHI 360; Siti Sulami – FHI 360; Indang Trihandini – University of Indonesia; Mondastri Korib – University of Indonesia; Rossy – PHO West Java; Aan Hermawan – PHO West Java.
CONTRIBUTORS
Asep Hardiansyah – GWL Ina; Ayu Oktariani – IPPI; Christian – Gaya Dewata; Christian P. – Kios Atmajaya; Citra Wahyuningsih – VCT Sanglah; Cok Istri Sri Dharma Astiti
– PHO Bali; D W Wirma – PAC Bali; Dewa Nyoman Wirawan – Udayana / Yayasan KertiPraja; Dewi Dian – VCT Sanglah; Eva Kartikasari – YKS; Fais Abdillah –Yakeba;
Fonny J Silvanus – NAC; Gde Agus Suryadinata – PHO Bali; Hartini – IPPI; I Made Adi Wiguna – PHO Bali; I Made Ari Sudana – PAC Bali; I N Kenyem Subagja – PHO Bali; I N Sudiyasa – PHO Bali; Irawati –MoH; Komang Ayu Trisna – VCT Sanglah; Kon Sriwiyartini – RS Sanglah; Luh Putu Musnitarini – PHO Bali; M. Syamsoel – Orbit; Made
Ratri – VCT Sanglah; Marstyo Catur – YSS; Ni Luh KD Sri Sastradewi – PHO Bali;
Ni Nyoman Sri Sutarmi – VCT Sanglah; Ni PutuPutri Pratiwi – DAC Badung; Novita E
Wuntu – Citra Usada Indonesia; Otto Sugiarto – Yayasan DuaHati; Pipiet Laksmono –
GWL Ina; Priscillia Anastasia – WHO DKI Jakarta; Puji Suryantini - WHO Indonesia;
ExECUTIvE SUmmARy
Population size estimates (PSEs) is an important component in planning and evaluating HIV prevention program, and also for further projection of people living with HIV (PLHIV) in Indonesia. The 2016 PSE was collaborative works of Ministry of Health (MOH), National
AIDS Commission (NAC), National Statistic Office, Universities, within the technical
support from WHO, UNAIDS, and FHI Linkages. The results have assessed for face validity by relevant key stake holders and the respective communities.
Indonesia has started PSE since 2002. The PSE methods were kept updated and being improved for obtaining better result. In 2016, the PSE is adopted the 2012 PSE methods with several improvements for additional vary and updated data sources, implementing theoretical concepts in predictors selection, and implementing adjustment factors. KPs being estimated is included female sex workers (FSW), men have sex with men (MSM), waria, and people who inject drug (PWID). Client of FSW and client of waria were also estimated.
The 2016 PSE used multivariable regression models to extrapolate estimates based on mapping conducted at locations (“venues”) frequented by KPs in selected districts to other districts where mapping had not been conducted, to arrive at a national PSE. Further adjustments were implemented to the estimates to account for KP members
who may not have been reflected in the mapping figures.
The main data to be used for predicting the size estimates was mapping data and 2015 IBBS. Thus, the 2016 PSE was starting with assessment of data and the process of obtaining those data. Then, the predictor variables for the extrapolation models were
selected based on theoretical framework and statistical significance. This was followed by developing and fitting the regression models to the mapping data and using the fitted
models to extrapolate the mapping counts to the unmapped districts. Further adjustments were conducted to account for KP members who do not attend venues, and additional
calculations to convert mapping counts to annualized figures that represent the number
of KP during a 12-month period. The size estimates result was also assessing for face validity, and revision may also raise from consensus among stake holders and expert.
The main results of 2016 PSE were as follows:
There was a lot of discussion in determining the above size estimates result. The followings are the main points of discussion:
• FSW size estimates are stable and similar with the 2012 PSE, and also in line with
the common range size of FSW in Asia
• MSM size estimate s are far lower than the 2012 PSE, and also lower than the common range size of MSM in Asia. This is due to the use of consensus inflation number for MSM because no supporting data for reasonable inflation factor currently. In addition, there were arguable of the 2012 PSE inflation factor for MSM.
• Waria size estimates are slightly higher than the 2012 PSE and far lower than other
country. However, this number was acceptable for face validity.
• PWID size estimates are far lower than the 2012 PSE and other report. However,
there are supporting data to convince the accuracy of this number
• Clients of FSWs were lower than the 2012 PSE; but still in the common range of
Asia. Most of available data are coming from high risk men, thus consensus should
be used to obtain the final estimates
• Clients of waria were lower than the 2012 PSE; but no supporting data available.
The 2016 PSE is not without limitations. Although the statistical methods are sophisticated,
the data being used have their originated weaknesses; and these must have influenced
the result of the PSE. Likewise, the size estimates produce less reliable in the district level. In addition, there were still many consensuses should be taken during the exercise; which may subject to error.
AEM : AIDS Epidemic Modeling
DHS : Demographic and Health Survey DFSW : Direct Female Sex Worker
IBBS : Integrated Biologic Behavior Survey
FHI Linkages : Family Health International Linkage (FHI360) FSW : Female Sex Workers
HIV : Human Immunodeficiency Virus
IDFSW : Indirect Female Sex Worker
IF : Inflation Factor
KP : Key Population
MSM : Men Who Have Sex with Men MOH : Ministry of Health
NAC : National AIDS Commission
NSO : National Statistic Office
PODES : Survei Potensi Desa (Survey of Village Potency) PLHIV : People Living with HIV
PSE : Population Size Estimate PWID : People Who Inject Drug UNAIDS : United Nations on AIDS WHO : World Health Organization
SAKERNAS : Survey Angkatan Kerja Nasional (National Survey of Work
Labor)
SUSENAS : Survei Sosial Ekonomi Nasional (National Survey of Economy
and Social)
FORWARD ... iii
CONTRIBUTOR LIST ... iv
EXECUTIVE SUMMARY ... v
GLOSSARY ... vii
TABLE OF CONTENTS... ix
1. BACKGROUND ... 1
2. METHODOLOGY ... 3
2.1. Objectives ... 3
2.2 General Overview of the PSE Process ... 3
2.3. Definition of KPs ... 4
3. STEPS IN THE CALCULATION OF KPs ... 7
3.1. Review of Mapping Data ... 7
3.2. Extrapolation of Mapped Counts to Unmapped Districts Using Regression Models ... 7
3.3. Using Inflation Factors to Account for Non-Venue-Going KP ... 14
3.4. Estimating Number of Clients of Female Sex Workers ... 17
3.5. Estimating Number of Clients of Waria ... 18
4. RESULT ... 19
5. DISCUSSION ... 20
Annex 1. Mapping and IBBS Sources and Limitations ... 25
Annex 2. Comparison of 2012 with 2016 PSEs. ... 30
Annex 3. Adjusting district-level KP Size Estimates for Use in Setting Program Coverage Targets and Assessing Program Performance ... 32
Annex 4. Calculation of Clients Using 2012 PSE Method ... 33
Annex 5. PSE Result by Province ... 34
Annex 6. Akaike Information Criterion ... 40
Estimates of the number of individuals among key populations at higher risk for HIV exposure (KP) are essential to advocate for resources, prioritize prevention and other programmatic activities among groups, predict the number of persons living with HIV (PLHIV) and the impact of the HIV epidemic through modeling, and assess program coverage. Population size estimates (PSEs) are an important component of surveillance as well as monitoring and evaluation.
In Indonesia, the Sub-Directorate of AIDS and Sexually Transmitted Infections (STIs) of the Ministry of Health (MOH) has conducted several rounds of size estimation, in 2002, 2004, 2006, 2009, and 2012. Indonesia develops size estimates for six populations: men who have sex with men (MSM); female sex workers (FSWs); clients of female sex workers; people who inject drugs (PWID); and, Waria (male-to-female transgender); and clients of waria sex workers. Worldwide, Indonesia is one of 38 countries to produce size estimates at the national level using a well-documented methodology for any KP.
A key challenge faced by all countries is to develop size estimates at the national level given that actual data are typically available in only a small number of urban centers where PSE studies, mapping and/or HIV biological and behavioral surveys (IBBS) have been conducted. KPs are often hidden and hard-to-reach and conventional survey and sampling methods do not perform well in these populations; while there are several methods available for size estimation, all are subject to biases and have large levels of
statistical error (i.e., large confidence intervals). Beginning in 2009, Indonesia adopted
a sophisticated statistical strategy using multivariable regression models to extrapolate estimates based on mapping conducted at locations (“venues”) frequented by KPs in selected districts to other districts where mapping had not been conducted, to arrive at a national PSE. This approach also included additional adjustments to the estimates
to account for KP members who may not have been reflected in the mapping figures.
Indonesia was one of just 13 countries globally to use regression modeling to produce national estimates.2In 2012, PSEs for KP were estimated using this modeling method based on 2010 mapping data. However, the PSE results may have resulted in under or
over estimations because of the questionable quality of mapped data. The final report
recommended that future mapping activities follow a more rigorous process using a standardized protocol. In 2014, a standardized mapping exercise was carried out among KPs incorporating these recommendations including assessing mobility or frequency of visits, conducting more than one visit to hot spots, gathering data from non-key population members at the selected venues in addition to KP members, and the inclusion of low- and middle- KP density areas in addition to high density areas.
BACKGROUND
1
1 UNAIDS/WHO Working Group on Global HIV/AIDS and STI Surveillance. Guidelines on Estimating the Size of Populations Most at Risk to HIV. 2010. Geneva, Switzerland.
2 Ministry of Health of Indonesia. 2012 Size Estimation of Key Affected Populations (KAPs). 2014. Jakarta, Indonesia.
3 Sabin K, Zhao J, Garcia Calleja JM, Sheng Y, Arias Garcia S, Reinisch A, et al. Availability and Quality of Size
Estimations of Female Sex Workers, Men Who Have Sex with Men, People Who Inject Drugs and Transgender Women in Low- and Middle-Income Countries. Sandstrom P, editor. PLoS One. 2016. 11(5):e0155150. Available from: http://dx.plos.org/10.1371/journal.pone.0155150.
4 Yu D, Calleja JMG, Zhao J, Reddy A, Seguy N. Estimating the Size of Key Populations at Higher Risk of HIV
infection: a Summary of Experiences and Lessons Presented During a Technical Meeting on Size Estimation
among Key Populations in Asian Countries. West Pacific Survey Response. 2014;5(3).
The regression models to carry out this extrapolation 2016 were developed using the 2012 to 2015 mapping in over 70 districts (of 511 districts and 34 provinces nationally), in locations where KPs are known to gather (“venues” or “hotspots”). During the mapping, the number of KPs that frequent each hotspot was estimated by local KP members and
stakeholders during meetings. In addition, field teams visited each venue at times of peak
attendance to ascertain an observed count of the number of KP members present. While these mapping counts were limited to districts where mapping is conducted, the predictor variables utilized in the extrapolation models were drawn from the national census and health and social surveys, all of which have national coverage, and therefore provide the basis for extrapolating the observed mapping counts to the districts that were not included in the mapping.
The 2016 PSE process for Indonesia involved many steps, including the assessment of data and the process of obtaining mapping data, selection of predictor variables for the
extrapolation models, developing and fitting the regression models to the mapping data, using the fitted models to extrapolate the mapping counts to the unmapped districts,
conducting further adjustments to account for KP members who do not attend venues,
additional calculations to convert mapping counts to annualized figures that represent
the number of KP during a 12-month period, and assessing the resulting size estimates for face validity.
In March and November of 2016, MOH conducted the latest round of PSE. From May 30 to June 2 2016, technical experts representing WHO, FHI360, UNICEF and UNAIDS met in Bandung, Indonesia with statisticians, methodologists and program managers
from the MOH National AIDS Committee (NAC), National Statistics Office, Airlangga and Udayana Universities to provide recommendations to refine the final methodology
to ensure the most accurate PSEs possible. Another working group meeting was held in
July 2016, with technical experts to review and refine the PSEs. Serial team workshops
involving core team, reviewers and contributors were conducted on August, September,
2.1. Objectives
The objectives of estimating the sizes of MSM, FSW, PWID, Waria, and clients of FSW as well clients of Waria are to be able to:
1. Evaluate the coverage of existing programs 2. As basis for program planning
3. Estimate the number of PLHIV in the current year,
4. Project the number of PLHIV and burden of HIV in the future,
2.2 General Overview of the PSE process
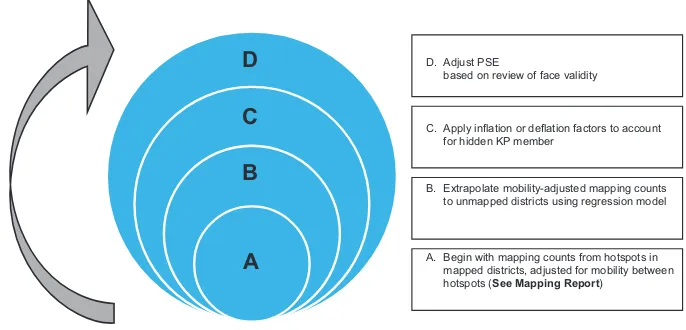
There are several steps involved in the process to generate national PSE of KP in Indonesia, all of which are described in detail in this report and in supplemental annexes (Figure 1). This process began with assessing the data from a mapping exercise conducted in 2014 - 2015 (Section 3.1 and Annex). Data from the mapping exercise had been reduced to account for potential double-counting (i.e., a mobility adjustment). The mobility-adjusted estimates provide information about the number of KP members who frequent hotspots during peak times of attendance in the mapped districts. The next step involved using these estimates from the “mapped” districts in the remaining districts that were not mapped by extrapolation using regression modeling (section 3.2). The mapping data (in mapped districts) and extrapolated estimates (in unmapped districts)
were adjusted further by an inflation factor in order to reflect those KP members who do not frequent the types of venues where mapping was conducted. These inflation factors
were derived from data from the IBBS surveys of FSW, waria and PWID conducted in
2015 (Section 3.3). For MSM, the inflation factor was based on consensus estimates.
Finally, local experts reviewed the estimates to assess face validity, including comparing them to other sources of data (i.e., HIV outreach program data, ARV coverage). To some
extent, PSE team considered to make further exercise with other inflation factors when
most of local experts agreed that the preliminary PSEs were not correct. There was agreement to use PSE result in the provincial level rather in district level. There is also suggestion to provide further explanation on how to use the PSE result wisely (ANNEX).
Figure 1. Steps in the calculation of the PSE of KPs in Indonesia, 2016
D
C
B
A
A. Begin with mapping counts from hotspots in mapped districts, adjusted for mobility between hotspots (See Mapping Report)B. Extrapolate mobility-adjusted mapping counts to unmapped districts using regression model C. Apply inflation or deflation factors to account
for hidden KP member D. Adjust PSE
based on review of face validity
2.3. Definition of KPs
In a PSE exercise, how the KP is defined has important implications for the interpretation
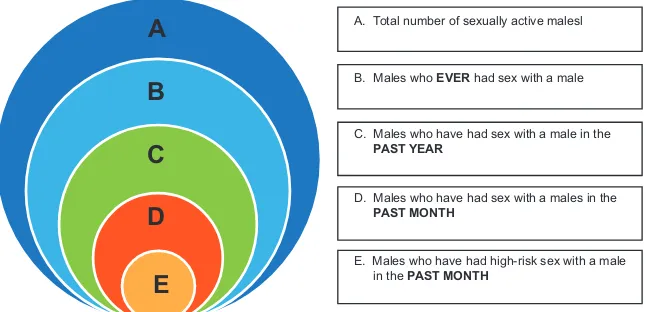
of the estimates and should be determined based on the intended use of the PSEs. To illustrate, Figure 2 presents concentric circles, which represent different subsets of MSM. In this (hypothetical) illustration, the size of each circle is proportional to the relative
number of MSM in each subgroup. The figure demonstrates how different definitions of
MSM can lead to very different size estimates. For instance, if the objective is to model all potential HIV transmission(circle C) over the course of a year, the MSM “population”
could be defined broadly as all men who have had sex with another man in the past 12 months; alternatively, the population could be defined more narrowly, as those MSM
Figure 2. Defining men who have sex with men according to the objectives of the PSE
A
B
C
D
D. Males who have had sex with a males in the
PAST MONTH
C. Males who have had sex with a male in the
PAST YEAR
B. Males who EVER had sex with a male A. Total number of sexually active malesl
E. Males who have had high-risk sex with a male in the PAST MONTH
E
Generally, different data sources used to calculate the PSE also reflect different
subgroups. For instance, the mapping data reflect KPs who frequent known hotspots and are therefore thought to reflect KP members who are currently active in high-risk
behaviors; however, the actual time period of the risk behavior, the type of behavior (i.e., oral vs. anal sex), and the age of those mapped are not measured. In contrast,
the IBBS surveys reflect KPs who meet survey eligibility criteria, namely, being 15 years
or older and having engaged in the respective risk behavior during the last month (for DFSW and IDFSW) or during the last 12 months (for MSM and PWID). 6
These differences in definitions are important for interpreting each data source (See Annex 1 for definitions of KP in the mapping and IBBS). The key challenge for developing the PSE is to work with these differences and produce final estimates that reflect the desired
segment of the target population. The analysis conducted as a part of this PSE exercise
was designed to produce size estimates that reflect the population definitions in Table1.
Table 1. Definitions of KP for the final size estimates
Population Definition
FSW Females aged 15 years or older who receive money or goods in
exchange for anal or vaginal penetrative sex in the last 12 months
MSM Biological males aged 15 years or older who had sex with a man in
the last 12 months
PWID Males or females aged 15 years or older who injected drugs categorized
as narcotics in the last 12 months
Waria Biological males aged 15 years or older who identify their gender
identity as females
Clients of FSW Males aged 15 to 49 years old who paid a female money or goods for anal or vaginal penetrative sex in the last 12 months
3.1. Review of mapping data
Mapping data collected from 72 to 114 districts per KP (comprising 14% to 22% of all 511 districts nationally) were used to develop the extrapolation models. The MOH protocol for the 2014 and 2015 mapping exercise was also reviewed and the mapping process was discussed with MOH and NAC stakeholders in order to understand the representativeness and reliability of the mapping data. Data from 2014 to 2015 mapping exercise had taken mobility adjustment; but not for the 2012 mapping exercise. For more information on the collection of mapping data, the mobility adjustment and limitations, please see Annex 1.
3.2. Extrapolation of mapped counts to unmapped districts using regression
models
The purpose of the regression models was to extrapolate the mapping findings (i.e., the
number of KP members who frequent hotspots in each district), already adjusted for mobility, to districts where mapping had not been conducted. One model was developed per KP. The extrapolation models use data from national demographic and health surveys
to predict the mapping findings. Because a wealth of variables is available in these surveys, the first step of extrapolation was to select which variables should be examined
for potential inclusion in the regression models (“candidate variables”).
3.2a. Defining the candidate predictor variables
Candidate variables for the extrapolation models were selected based on theoretical considerations of what factors could potentially be strongly associated with the number of KPs found at known hotspots. A conceptual framework was developed by technical and local experts at the April - June 2016 meetings in Jakarta and Bandung. The themes (constructs) that were hypothesized to be related to the mapping count of each KP are shown in Table 2. The types of constructs included in the conceptual framework are driven to a large extent by the types of data available in the national surveys; they include for the most part population size, poverty, crime and the types of establishments present in a district or its constituent villages.
Table 2. Theoretical framework used to select predictor variables for the extrapolation models
Constructs Theorized association with number of KPs at hotspots
MSM
Presence of touristic establishments, Such locations are known hotspots (i.e., places
such as movie theaters, pubs, where MSM gather and look for partners)
discotheques, tennis courts, swimming pools and fitness centers
Male employment in services sector MSM are thought to work in particular branches
of the services sector, such as gymnastic,
marketing, and entertainment
Larger population MSM are thought to often live in larger cities due to
the present of touristic establishment
FSW
Presence of touristic establishments, Such locations are known hotspots (i.e., places
such as open public areas, hotels, where FSW find clients) parks, fields, and pavilions
Female employment in services sector FSW are thought to work particular branches of the services sector, such as salons, bars, karaoke, hotels and restaurants
Poverty FSW are thought to have limited economic
resources and come from poor families
Legal environment FSW usually related with law repressive action due
to not legal
Demographics FSW characteristics to be young, divorced, less
educated, mobile with respect to work
Larger population FSW are thought to often live in larger cities due to the availability of tourist establishment
Waria
Constructs Theorized association with number of KPs at hotspots
Larger population Waria are thought to often live in larger cities due to the availability of touristic establishment
PWID
Crime rates PWID are thought to be more involved in crimes,
including drug offenses as well as non-drug offenses caused in part by substance abuse
Poverty PWID are thought to often have social problems in
the early life, such as poverty or becoming street children
Larger population PWID are thought to often live in larger cities due to the availability of the drug supply
Data for the candidate predictor variables came from the following data sources:
1. Sakernas survey (2015): This survey measures labor data from household members,
aged ≥10 years old in all 511 districts in Indonesia. A total of 200,000 households
were randomly selected. 7
2. Susenas survey (2015): This survey measures socioeconomic conditions, including health, education, fertility, family planning, housing, etc. from household members in
all 511 districts in Indonesia. The survey is conducted twice per year. The first survey
included a sample of 300,000 randomly selected households and was designed to provide district-level estimates. The second survey included a sub-sample of the
first survey of 75,000 households to provide province-level estimates. 8
3. PODES survey (2014): A survey of 73,709 randomly selected villages in all 511 districts in Indonesia. Provides data related to infrastructure, population and reproductive health, natural resources, and education at the village level. Data were gathered
from government officials in the sampled villages, such as the head of the village.9
4. Indonesia Population Projection. Based on national census in year 2010, projection was made to obtain number of population age 15-49 years old in year 2015.10
Most of the predictor variables considered were expressed as proportions by dividing the respective variable (a number of individuals in each district) by the total number of females and/or males aged 15 – 49 years old in the same district, according to population projection10 data (e.g., proportion of divorced young women among females ages 15 to
49 years). The denominator included females in models of FSW, males in models of MSM and waria, and both females and males in models of PWID.
7. National Statistic Office. Survei Angkatan Kerja Nasional 2015. Available at: https://sirusa.bps.go.id/sirusa/index.php/
dasar/pdf?kd=5&th=2015
8. National Statistic Office. Indonesia - Survei Sosial Ekonomi Nasional 2015 Maret (KOR). http://microdata.bps.go.id/
mikrodata /index.php/catalog/657
9. National Statistic Office. Indonesia – Pendataan Potensi Desa 2014. http://microdata.bps.go.id/mikrodata/index.php /
catalog/PODES)
Several variables were derived from PODES data that are aggregated at the village level and thus expressed as a proportion of villages with a given characteristic (e.g., proportion of villages with a bar, proportion of villages with a private high school). These variables could not be disaggregated further.
The rationale for specifying some variables as proportions rather than absolute numbers is to account for differences in the size (in terms of total population or number of villages) of the districts by modeling the relative level of the given characteristic in each district.
However, because this step might limit the variation among districts, particularly when counts are very small relative to the total population, we left some potential predictor as absolute numbers (e.g., reported number of males age 15-49 years old). Finally, we explored as potential predictors the total number of males and females ages 15-49 years old in each district, from the population projection10, hypothesizing that a district’s size
would be related to the number of KP members found at identifiable venues.
Considering that mapping data were not available in all districts in all region, we also
included region as a predictor variable. We defined 6 regions included Sumatera, Jawa, Kalimantan, Bali and NTT, Sulawesi, and Maluku and Papua. The final predictors chosen
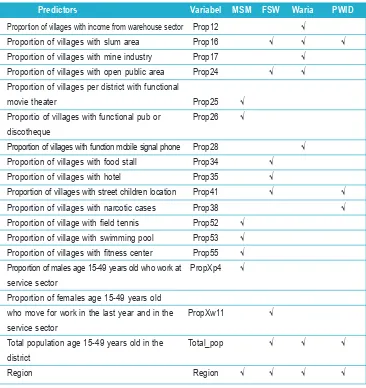
Table 3. Final predictors of each key population
Predictors Variabel MSM FSW Waria PWID
Proportion of villages with income from warehouse sector Prop12 √
Proportion of villages with slum area Prop16 √ √ √
Proportion of villages with mine industry Prop17 √
Proportion of villages with open public area Prop24 √ √
Proportion of villages per district with functional
movie theater Prop25 √
Proportio of villages with functional pub or Prop26 √
discotheque
Proportion of villages with function mobile signal phone Prop28 √
Proportion of villages with food stall Prop34 √
Proportion of villages with hotel Prop35 √
Proportion of villages with street children location Prop41 √ √
Proportion of villages with narcotic cases Prop38 √
Proportion of village with field tennis Prop52 √ Proportion of village with swimming pool Prop53 √ Proportion of villages with fitness center Prop55 √ Proportion of males age 15-49 years old who work at PropXp4 √
service sector
Proportion of females age 15-49 years old
who move for work in the last year and in the PropXw11 √
service sector
Total population age 15-49 years old in the Total_pop √ √ √
district
Region Region √ √ √ √
3.2b. Algorithm to calculate the KPs
PSE team conducted several steps of statistical analysis to develop the model of mapped
district and finally to extrapolate this model to unmapped district. Those steps include: 1) selecting the predictor variable, 2) fitting the best regression model, and 3) applying the regression model for unmapped district to predict the final estimates of KP. These
A. Selecting predictor variables
After variables were selected based on theoretical model, the simple regression
model were applied to select variables which have significant correlation (P value
<0.05) and higher adjusted R-square. Three models of Linear, Poisson and Negative Binomial were chosen to run the regression as the type of dependent variable is a count. This step resulted three functional forms of regression. Each predictor variable
for KP which was significant in bivariate regression was included in the multiple
regression model. In each of the three-functional form model, the relationship was tested using different transformations of the predictor: natural log, square root and polynomial (x + x2).
B. Fitting the best fit model
Following the multiple regression using the Linear, Poisson and Negative Binomial regression, test of classical assumption was done to determine the best regression
model; by assessing the goodness of fit and the predictive result of KP number.
Based on those criteria, the best regression model for modeling all KP was Linear Regression Multiple Form.
We measured the goodness of fit from Multivariable Regression Model using AIC
correction and Adjusted R squared. Classical assumption for the Linear regression model were also tested, including test for:
- autocorrelation (by assessing Durbin Watson value),
- homoscedasticity (by assessing the plots of standardized regression and heteroscedasticity value),
- linearity (by assessing the plots of predicted values), multicollinearity (by
assessing the VIF and tolerance) to obtain the best-fit model, and
- normality (by assessing skewness and kurtosis plots (Z-score)).
C. Applying the regression model for unmapped district to predict the final estimates of KP
Remaining variables that were found to no longer be significant were removed from
the multivariable model through a stepwise backward regression with a threshold
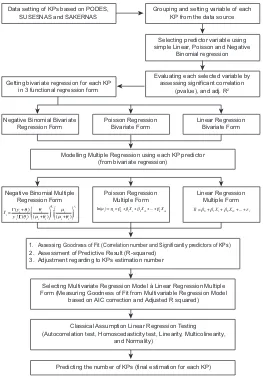
Figure 3. Algorithm of statistical analysis for 2016 PSE
Data setting of KPs based on PODES, SUSESNAS and SAKERNAS
Getting bivariate regression for each KP in 3 functional regression form
Negative Binomial Bivariate Regression Form
Poisson Regression Bivariate Form
Modelling Multiple Regression using each KP predictor (from bivariate regression) Grouping and setting variable of each
KP from the data source
1. Assessing Goodness of Fit (Correlation number and Significantly predictors of KPs) 2. Assessment of Predictive Result (R-squared)
3. Adjustment regarding to KPs estimation number
Selecting Multivariate Regression Model à Linear Regression Multiple Form (Measuring Goodness of Fit from Multivariable Regression Model
based on AIC correction and Adjusted R squared)
Classical Assumption Linear Regression Testing (Autocorrelation test, Homoscedasticity test, Linearity, Multicolinearity,
and Normality)
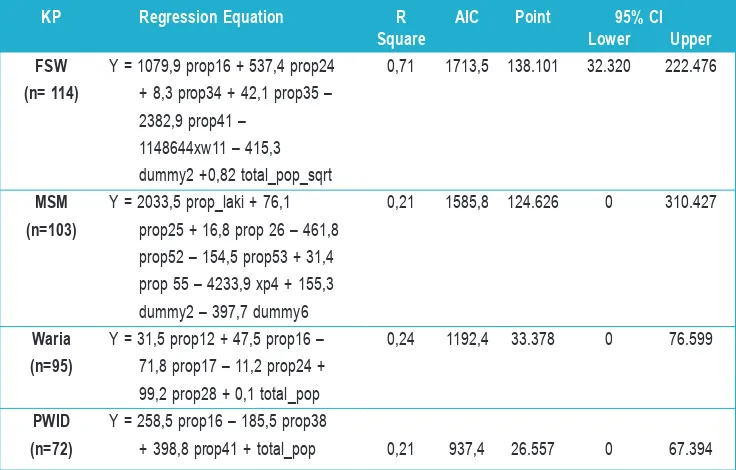
Table 4. Final regression model for each key population
KP Regression Equation R AIC Point 95% CI
Square Lower Upper
FSW Y = 1079,9 prop16 + 537,4 prop24 0,71 1713,5 138.101 32.320 222.476 (n= 114) + 8,3 prop34 + 42,1 prop35 –
2382,9 prop41 – 1148644xw11 – 415,3
dummy2 +0,82 total_pop_sqrt
MSM Y = 2033,5 prop_laki + 76,1 0,21 1585,8 124.626 0 310.427
(n=103) prop25 + 16,8 prop 26 – 461,8 prop52 – 154,5 prop53 + 31,4 prop 55 – 4233,9 xp4 + 155,3 dummy2 – 397,7 dummy6
Waria Y = 31,5 prop12 + 47,5 prop16 – 0,24 1192,4 33.378 0 76.599 (n=95) 71,8 prop17 – 11,2 prop24 +
99,2 prop28 + 0,1 total_pop
PWID Y = 258,5 prop16 – 185,5 prop38
(n=72) + 398,8 prop41 + total_pop 0,21 937,4 26.557 0 67.394
3.3. Using inflation factors to account for non-venue-going KP
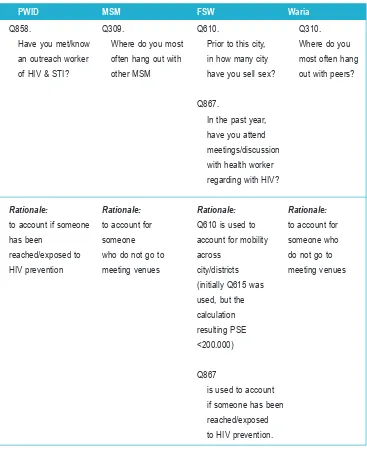
Based on review of the types of venues included in the mapping data, we applied adjustments to account for KPs who do not frequent these types of venues (“hidden population”), and therefore were not likely to have been captured during mapping. These were developed from responses from the IBBS surveys conducted in 2015 (Table 5). For more information on the collection of IBBS data and limitations of the IBBS data, please see Annex 1.
Based on those questions, we calculated proportion of survey participants who have
answer “YES” to the option that reflected potentially missing in mapping for each KP.
Table 5. IBBS survey questions and responses used for adjustment*
PWID MSM FSW Waria
Q858. Q309. Q610. Q310.
Have you met/know Where do you most Prior to this city, Where do you
an outreach worker often hang out with in how many city most often hang
of HIV & STI? other MSM have you sell sex? out with peers?
Q867.
In the past year,
have you attend
meetings/discussion
with health worker
regarding with HIV?
Rationale: Rationale: Rationale: Rationale:
to account if someone to account for Q610 is used to to account for
has been someone account for mobility someone who
reached/exposed to who do not go to across do not go to
HIV prevention meeting venues city/districts meeting venues
(initially Q615 was
used, but the
calculation
resulting PSE
<200.000)
Q867
is used to account
if someone has been
reached/exposed
to HIV prevention.
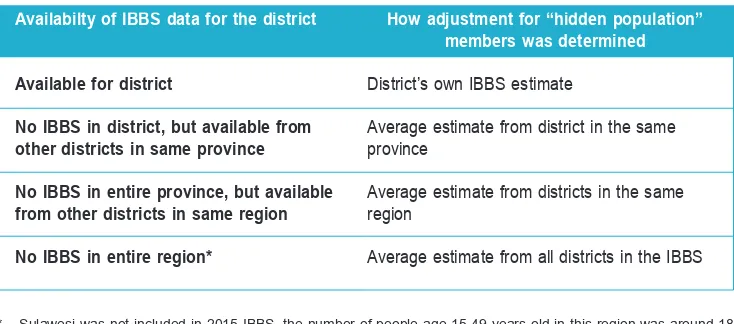
Table 6. Determination of adjustment factors by district
Availabilty of IBBS data for the district How adjustment for “hidden population” members was determined
Available for district District’s own IBBS estimate
No IBBS in district, but available from Average estimate from district in the same
other districts in same province province
No IBBS in entire province, but available Average estimate from districts in the same from other districts in same region region
No IBBS in entire region* Average estimate from all districts in the IBBS
* Sulawesi was not included in 2015 IBBS, the number of people age 15-49 years old in this region was around 18 million or 7.2% of the total population
Hidden populations inflation factor for districts not included in the IBBS
The inflation factor to account for hidden population members was derived from the IBBS. Rules were needed to determine what inflation factor would be applied to districts that were not included in the IBBS. In such cases, the average inflation factor from other
districts in the IBBS in the same province or region was used (Table 6).
Hidden populations inflation factor (IF) for MSM
The inflation factors for MSM based on the above method (using 2015 IBBS) resulting
the average IF of 1.7 times (1.6 – 1.9). The implementation of the IF across district resulting number of MSM across districts were varied from 0 to 1,388 MSM, nationally was 208,808 MSM.
The mapping-based estimates, following adjustments for mobility (i.e., potential
double-counting), extrapolation to unmapped districts, and this inflation factor to account for
Local experts’ consensus adjustments to the preliminary PSEs
Given the various sources of potential under-estimation inherent in mapping-based size estimates (see annex and discussion section), the meeting of local experts held on 27 to 29 July 2016 considered that MSM size estimates for Indonesia should be similar to those reported elsewhere in the region. UNAIDS data suggest a regional PSE for MSM of approximately 2% of the male population aged 15 to 49 years.11 This would
be equivalent to applying a hidden populations inflation factor of approximately 4.0 to
the extrapolated mapping counts. Because the number of 2% is still considered as high, this number was used as the maximal IF which was allocated for big cities such as the capital of provinces. The remain cities considered as urban but not capital were arbitrarily given number below 2%, while the district considered as rural were given the lowest number of 0.5%.
3.4. Estimating Number of Clients of Female Sex Workers
Referring to 2012 PSE, the size of clients of sex workers and waria were calculated by multiplying the number of estimated FSW. This method is applied to in to calculation with average number of clients of DFSW and IDFSW per week (4) and number of work-days (23-25) for 10 months per year which were obtained from the result of 2015
IBBS survey for DFSW/IDFSW. Because the definition of sex work in the 2015 IBBS is
only one month, and also to reduce double counting of clients per FSW, the correction
factors were applied. Using Q617 and Q618 from the 2015 IBBS survey for high risk
men (HRM), the number of HRM looking for 3.3 different FSW per year. This resulting the estimated number of clients of FSW was approaching 19 million or 27% of male age 15-49 years old in Indonesia. Since this number was calculated (Annex 4) from the survey of high risk men, this number was considered too high.
The Demographic and Health Survey (DHS)12 conducted in 2012 provides data on
married men who paid for sex in the last year, by age group and province. The DHS is a nationally representative household survey that uses conventional multistage random sampling; it is assumed to be representative of the entire household population and therefore is more suitable for PSEs than the IBBS (for a calculation of clients of FSW using IBBS data as above). Among the 60.9% of men ages 15 to 49 years who reported being married at the time of the survey, 1.9% reported having paid for sex in the previous year. Assumed if the unmarried men have same proportion with married men to buy sex in the previous year, this percentage was multiplied by the estimated number of men between the ages of 15 to 49 years (according to the population projection of 2010 census) to provide the size estimate of married men who were clients of sex workers. This resulting the estimate number of client of FSW was 1,4 million in Indonesia. As paid sex with FSW is a stigmatized behavior in Indonesia, the percentage of 2% may be underestimate.
To determine number of clients of FSWs, there were e-mail discussion among AEM consultants, other consultants and stakeholders during 27 September to 3 October 2016. AEM consultants suggested that the latest proportion for Asian countries is ranging from 5% to 15.3%,13 however, others considered that some of those numbers were obtained
from high risk men. Currently, the available data of clients in Indonesia is from the IBBS, where it is also coming from high risk men; thus, this data also cannot directly be used for adjusting the estimated clients in the entire district. Therefore, PSE team made some consensus to address this issue:
• District with IBBS result use clients’ proportion from 2015 IBBS result (note: district
with IBBS is account of 4% among total districts)
• Districts without IBBS result, but are the capital of provinces, big cities, located in the
economic road track/near the beaches, or having big factories are given proportion of clients of 10%. This number was account based on the lowest and the highest IBBS result (5% to 13.5%) (note: district include in this category is 13.7% among total districts).
• Districts without IBBS result, not fulfilled criteria (2), are given the lowest proportion
of 5% (note: district include in this category is 82.3% among total districts)
3.5. Estimating Number of Clients of Waria
This estimate was calculated using data from the IBBS surveys of waria and of high risk men (based on employment categories) conducted in 2015.
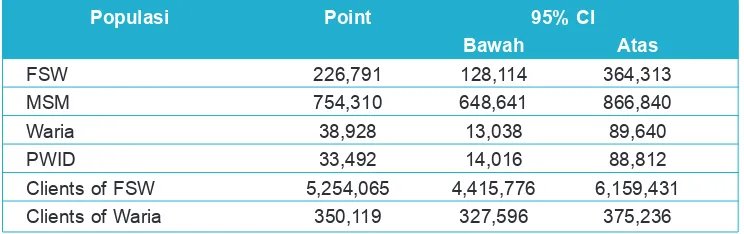
The above calculation resulting final population size estimate of FSW, MSM, Waria,
PWID, and Clients of FSW and Waria as presented in the below table. The highest size estimate is clients of FSW which account for 5 million, and the smallest size estimates is
PWID which account only 33 thousand. The 95% confidence level are relatively narrow
for FSW, MSM, clients of FSW and clients of waria; but this are wide for waria and PWID.
Table 7. Final population size estimations of KPs
Populasi Point 95% CI
Bawah Atas
FSW 226,791 128,114 364,313
MSM 754,310 648,641 866,840
Waria 38,928 13,038 89,640
PWID 33,492 14,016 88,812
Clients of FSW 5,254,065 4,415,776 6,159,431
Clients of Waria 350,119 327,596 375,236
The 2016 PSE used the regression and extrapolation method. This method has been
used in Indonesia since 2009 and refined in the 2012 PSE; while the extrapolation
method also has been widely used globally. The effort to conduct the PSE regularly is an evidence of strong commitment of Ministry of Health and stakeholders to provide
scientific data for planning HIV/AIDS prevention program in Indonesia. In addition, the
2016 PSE had some improvements from previous PSE (see below paragraph), had been
examined and agreed by main and relevant stake holders as part of verification process
(face validity). In general, the national and regional stake holders accepted the 2016 PSE result as reliable, particularly for PSE result in the national and provincial level.
The 2016 PSE conducted mapping-based size estimates in districts throughout Indonesia in order to develop national estimates of the number of MSM, Waria, FSW and PWID in the country. All regions, including Sumatera, Java, Kalimantan, Sulawesi, Bali and Nusa Tenggara, and also Papua have been covered in mapping in proportional basis. However, the mapping only account for 1/5 of 511 districts, and about a half were still using the un-standardized 2012 mapping data. To overcome common limitations to mapping data—such as potential double-counting and the limited number of individuals who frequent known venues—adjustments were applied to the estimates based on data collected during the mapping, data from IBBS, and local expert opinion. More than 99%
of identified hotspots in 2014-2015 mapped district represented well coverage of location.
The actual estimate of 2016 PSE as reflected in Table 4 was only reflected those who frequently visited venue. The estimates had incorporated a number of adjustments to improve the degree to which they approximate the target populations. To avoid the potential double-counting across hotspots mapping data had been adjusted for mobility
inside respective district, therefore we did not do the deflation. The extrapolation was
done from the districts where mapping was conducted to unmapped districts. Finally,
the inflation factor was applied to account KP members who do not frequent venues.
The final PSE after adjustment with inflation factor resulting the national size of each KP
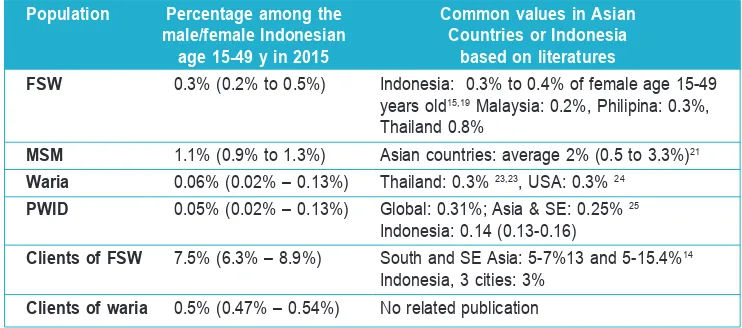
as shown in the Table 7. Comparing to the 2012 PSE14 (Table 8), there are decreasing
trend for most KPs, particularly MSM, PWID, clients of FSW and clients of waria. While number of FSW is relatively similar, there is slightly higher number for waria. Although 2016 PSE used similar methods with 2012 PSE, in the 2016 PSE used more data sources and had different adjustments which may contribute to the difference. Table 8 presented comparison of the percentage of 2016 PSE among total females/males’ population age
The 2016 PSE has provided the uncertainty ranges convey a sense of potential variation in the estimates due to uncertainties in the data available for analysis, although some
of them are not confidence intervals. Likewise, the point estimate, the number of FSW
and clients of FSW were in range of value for Asian common, but not for other KPs. These will be explained in the following paragraphs.
PSE 2016 resulting number of MSM that is relatively much lower than the 2012 PSE15
(1,095,970) and even the common values in Asia.11MSM estimated in the 2016 PSE
have been limited to those who have sex in the last year, which its definition is less
wide than the 2012 PSE. The number of MSM resulting in 2012 PSE accounted for 1.6% of total male age 15-49 years old in Indonesia in 2015. However, this number have been argued among relevant stake holders as this number is considered too high. Moreover, none of current studies support whether number of MSM reach the 2% of males’ population in Indonesia. One network study in three big cities in Indonesia provided impression that MSM were not too hidden. Many of them were frequently visit more than one hotspots once a month. Most of them were looking for friends, and 30%
were finally ended with sex relationship. One web-based study in Jakarta to assess
visitors of MSM websites during one week resulting 22,493 unique telephone number
to access at least one web-provider. Based on Statistic Office data, average of people
have 2 – 3 mobile phone, thus will resulting about 7,648 or 11,472 MSM in Jakarta which are in the range of 2016 PSE for Jakarta. However, this study was lack of clear information about the methods because no valid report can be obtained. In addition, this study also could not disregard the possibility of double counting between MSM, fail to ensure that only MSM have access the website, and this study was done for only one week. Discussion with MSM outreach workers from Jakarta (25 July 2016) and also in Bali (14 July 2016) concluded that the 2012 PSE for MSM were too high, however, they were also not able to provide the best estimate due to lack of clear individual record for the MSM under their coverage. Therefore, we considered that this is the best estimate for current situation, but it will need further supporting data for the next PSE.
The sharp decreasing trend of PWID in Indonesia might be related to the high mortality and the lack of heroin supply for several years. The high number of mortality related to PWID in Indonesia was noted but not really well documented. It was known that the prevalence of HIV and Hepatitis C among the PWID also very high, 16,17 that may lead
to cause mortality. One study in Bali supported the estimation of high mortality among PWID during 2007 to 2009. Also, the police data showed the dramatic shift in arrests for drug possession 2002-2003 (37.4% related to heroin, 11% to amphetamine) compared with arrest during 2009 (3.1% related to heroin, 30.9% related to amphetamine).18 This
number of PWID was much different with the latest estimate in 2012.15
15 Jeffrey Grierson, Stephen McNally, Irwan Hidayana, 2013. Networks of MSM in Indonesia: A 2 mode study of MSM and sites of engagement. Report. http://www.latrobe.edu.au/arcshs/
16 Prasetyo et al. – Blood-borne viruses in drug abuser inmates. J Infect Dev Ctries 2013; 7(6):453-467
17 E. J. Nelwan et al. Blood-borne infections in an Indonesian prison. Tropical Medicine and Internasional Health. volume 15 no 12 pp 1491–1498 december 2010
The number of Waria obtained from 2016 PSE is very much less than the common number in Thailand and in US, even for the highest (upper) estimate. There were very limited data available regarding the population size estimate for waria and for clients of waria in other Asian countries. Latest PSE in 2012 reported the size of waria was 37,99815 or will be around 0.056% of male ages 15-49 years old in Indonesia. This was
slightly lower than the 2016 PSE estimate for waria.
Mapping for 2014 and 2015 were conducted with standardized methods, had high coverage
of hotspots, available in all region, means will have better reflection of over districts in
Indonesia. However, mapping mainly done in urban area, the representativeness of
PSE is less for rural area than for urban area. Also, the definition of KP mapping data
was limited to those who met directly in certain places or location (i.e., hotspots, bar, etc.); therefore, this PSE is not covered those KP who use other ways (i.e., web-based, mobile) to meet their clients or partners.
One purpose for PSE estimate is to define the target setting for HIV programming.
As has been provided in Figure 1 and 2 that the process of PSE was begin with the
mapping data which represent a smallest subset of KP until the KP being defined in
the PSE process. Each subset of KP will provide data for different uses. When using the size estimates for target setting, it is important to take into account the design of the interventions being planned, which subgroups they intend to target, and how the
indicators for service coverage are defined. For example, a prevention strategy for
FSW that conducts outreach at entertainment venues to promote uptake of testing and distribute condoms may be best served calculating monthly outreach targets based on
the estimated number of FSW at hotspots unadjusted for the inflation factor (for the
non-venue-going part of the population). On the other hand, if the purpose is modeling
the epidemic among FSW then the “best estimate”, which includes the inflation factor, should be used. However, in this report we only provide the final number that have taken
Table 8. Proportion of PSE result among the population and comparison with common values in Asia
Population Percentage among the Common values in Asian male/female Indonesian Countries or Indonesia
age 15-49 y in 2015 based on literatures
FSW 0.3% (0.2% to 0.5%) Indonesia: 0.3% to 0.4% of female age 15-49
Clients of waria 0.5% (0.47% – 0.54%) No related publication
The size estimates also provide key insights for how to improve the reach of current
intervention strategies. The large inflation factor to account for “hidden” KP subgroups
that do not frequent venues (which was reached by consensus among local experts familiar with the KPs of interest) suggests that new strategies are needed to reach the majority of KPs who cannot be reached by venue-based strategies alone. In addition,
other intervention strategies that specifically target non-venue-going KPs are needed.
Approaches that have proven effective in other settings include peer-driven interventions (which are disseminated by way of social networks) and Internet-based promotion of prevention and testing services.
Particularly, because the national estimates are done with the regression with the small number of samples, using an average, is not a design to produce robust sub-national estimates (e.g., at the district, provincial, or regional levels). A caution is needed when using the PSE for district-level estimates. Therefore, we provide some general suggestions in the Annex 3 on how to use the result of PSE.
19 Vandepitte et al., 2006. Estimates of the number of female sex workers in different regions of the world. Sex Transm Infect 2006;82(Suppl III):iii18–iii25. doi: 10.1136/sti.2006.020081 (Indonesia, based on 2002 PSE)
20 AIDS data hub, 2015. HIV and AIDS. Review on Slide. Female Sex Workers. Last update: December 2015 21 GARPR online reporting 2016, China 2013 HIV estimation and United Nations, Department of Economic and Social
Affairs, Population Division (2015). World Population Prospects: The 2015 Revision online reporting 2016 (Indonesia was based on 2012 PSE)
22 Sam Winter, 2002. Counting kathoey.http://www.transgenderasia.org/paper_counting_kathoey.htm 23 Sam Winter, 2002. Country Report: Thailand. http://transgenderasia.org/country_report_thailand.htm
24 Gary J. Gates, Williams Institute. 2011. How many people are lesbian, gay, bisexual, and transgender?
25 UNODC. Global trends in injecting and hiv. EMCDDA week on : measuring, understanding and Responding to drug
problems in Europe. 23-27 september 2013. http://www.emcdda.europa.eu/attachements.cfm/att_230536_EN_05.pdf
Several improvements for 2016 PSE have been done to improve the quality of PSE – as recommended in the 2012 PSE - including the use of standardized mapping and the addition of data being used for predictors. With the standardized mapping, the
population being mapped and who they were reflected were known clearly. The addition
data, instead of PODES provides more opportunities to exercise which predictors were accurate. However, several main limitations for 2016 PSE were noted as a consequence of limitation from the data being used such as the mapping data, the IBBS and the predictor data. In addition, there are still some portion of mapping data was contributed by 2012 mapping which was less standardized. These limitations have been provided in detail in the Annex 1.
a. Limitation of standardized mapping including:
• Proportion of district were small (1/5 from total)
• The selection of district still not random (programmatic based, focus in big
cities, and in region Java and Sumatera)
• Relied on key persons in the hotspots
b. Limitation of predictors data, because the predictors data represent the characteristics of general population that less sensitive to detect the existence of KP in the district. Among all data sources being used for predictors, PODES contributed more predictors than others. Meanwhile PODES were based on interviewed with key person in the
respective district to provide the profile of the district which may be subjective.
c. Limitation of IBBS data to be used as sources of inflation or deflation factors: • The selection of provinces and district still not random (programmatic based,
focus in big cities, and in region Java and Sumatera)
• The selection of KP for MSM and PWID using peer to peer recruitment and
may be not representative
Further recommendation is to refine the methods of data being used for PSE, particularly the mapping and IBBS. For predictors, there should be more questions specifics to detect
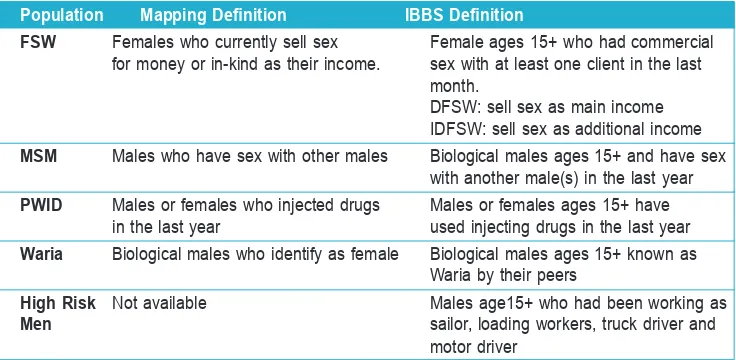
In Table A-1 are the definitions used for the populations during mapping and IBBS. These definitions differ from those used in the 2016 PSE exercise which were refined
to be more precise.
Table A-1. Definitions of KPs in the PSE data sources: mapping exercise
and IBBS
Population Mapping Definition IBBS Definition
FSW Females who currently sell sex Female ages 15+ who had commercial
for money or in-kind as their income. sex with at least one client in the last
month.
DFSW: sell sex as main income IDFSW: sell sex as additional income
MSM Males who have sex with other males Biological males ages 15+ and have sex
with another male(s) in the last year
PWID Males or females who injected drugs Males or females ages 15+ have
in the last year used injecting drugs in the last year
Waria Biological males who identify as female Biological males ages 15+ known as Waria by their peers
High Risk Not available Males age15+ who had been working as
Men sailor, loading workers, truck driver and
motor driver
Overview of 2015 Mapping Data
Based on recommendations in PSE 2012, Indonesia adopted a standardized mapping procedure since 2014, which may improve the PSEs for 2016.However, districts with mapping data in 2014 to 2015 will be very limited to develop good model for PSE. Therefore, we still use mapping data in 2012; even though these mapping data were not standardized. The 2012 mapping data had been examined for face validity by the team of National AIDS Commission, thus these mapping data were only included data that considered as reliable. The 2012, 2014, and 2015 mapping were done in 72 to 114 districts among total 511 districts, this mean the coverage district was only 1/5 among total districts. Although all regions have been covered in mapping, the proportion were distributed more in Java (see Table A-2).
The population size estimations primarily used data gathered through mapping. However, because districts were not selected randomly, there is potential for bias due to non-random selection of districts. The number of districts mapped in each region was proportional to the size of the general population based on census data; thus, the mapping provides coverage of all regions of the country. In each region, districts were selected mostly from among large cities and based on availability of local resources to conduct mapping. This approach ensures that the mapping data are collected where
they can benefit existing programs.
MAPPINg AND IBBS SOUrcES AND LIMITATIONS
A list of hotspots and peak gathering times at each hotspot was developed in each district based on input from stakeholders (provincial and district AIDS Commission, Tourism
Office, Welfare Office, and NGOs) and key person information before the mapping
process was conducted. Mapping was conducted at more than 99% of the hotspots
identified. Mapping of some of the hotspots was not carried out due to time constraints and field teams tended to map the larger hotspots first. Mapping data were adjusted
for double counting and mobility (in respective districts). Table A-2 provides distribution and proportion of mapping of each KP in the region.
Table A-2. Distribution and proportion of mapping district 27
Total Kota/ Jumlah dan Persen Kota/Kabupaten Region Total Number and Percent of Districts Mapped
Districts FSW MSM Waria PWID F % F % F % F %
Sumatera 154 25 16 25 16 24 16 10 6
Jawa 119 47 39 44 37 39 33 48 40
Bali dan Nusa Tenggara 41 8 20 7 17 8 20 4 10
Kalimantan 56 10 18 9 16 9 16 4 7
Sulawesi 78 11 14 10 13 10 13 6 8
East Indonesia 63 13 21 8 13 5 8 0 0
Total 511 114a 22 103b 20 95c 19 72d 14
• Proportion mapping data from 2012: a= 46,5% (53 districts), b=33,65% (35 districts), c= 63,2% (60 districts) and
proportion mapping data from 2014: d=100,0% (72 District)
Note:
Key persons to provide estimated number of KP in a hotspot
Each hotspot was visited by two surveyors with knowledge of the hotspot location (i.e., knows members of the key populations, knows venues, knows peak venue visiting times, etc.). Each surveyor selected at least 3 key informants comprising two from the key population and one not from the key population (e,g., cashier at venue/bar, taxi driver,
security officer, etc.). Key informants were asked to name the number of people that
could be found in hotspots during peak hours.
Adjustment of the district-level mapping counts for mobility
Mapping data were adjusted for mobility and double counting using the following questions:
• “Are you going to another hotspot to meet your friend/client before coming to this
place?”
• “Are you planning to go to another hotspot to meet your friend/client today/tonight?” • “When you are going out to see your friend/client, how many different hotspots do
you visit in one day/night?”
The above questions resulted in a correction factor for each KP in each hotspot and the average correction factor across all hotspots in the district was applied to the total district-level count for each KP.
Validating mapping data
Reliability
During the mapping activities, field staff evaluated the reliability of key informant information by subjectively scoring 1 (less) to 3 (most) reliable. Data receiving high reliability scores were used.
Revisits
Revisits to hotspots were conducted in 10% of hotspots for the following reasons:
• number of KP was more than 50; • visit was not during the peak time;
• visit was interrupted (i.e., police raid, poor weather);
• responses provided by key informants were ambiguous or inconsistent; • hotspots were big and located in hard to access locations.
First and second visit results then discussed among the surveyors and final number is
Weaknesses of using mapping data
Previous rounds of PSE in Indonesia have relied exclusively on mapping-based methods. Mapping is useful for prevention programs. However, mapping-based PSEs are subject to several limitations, which, on net, are likely to lead to under-estimation for the following reasons:
• not identifying all venues;
• not identifying all KP members at venues;
• counting only venue-going segments of the KP population;
• reliance on key informant opinion, which is subject to recall bias and the difficult
people generally have at estimating the number of individuals present at venues at a given time;
• collecting data just once from each venue, with unknown reliability over time; • reliance on “peak periods”, which is likely to lead to over-estimation;
• difficulty of extrapolating estimates from the brief “snapshot” captured during data
collection to the true number of KPs that frequent venues during a given period, i.e., a month or year;
• mapping an insufficient number of venues and districts; and,
• difficulty of extrapolating to venues that were enumerated but could not be mapped.
Mapping is not appropriate when a relatively small proportion of the population frequents venues. There is currently no evidence available to assess this in Indonesia. During the review meeting, the local PSE team described several factors that suggest that the proportion of KPs that frequent venues may actually be decreasing, among them, the increasing use of geo-social networking cellular phone apps among MSM, FSW and Waria and increasing stigma and intolerant legal and social environments, which could cause KP to remain hidden and move away from public venues.
Overview of 2015 IBBS data
Table A-3. Area of IBBS Survey in 2015
Province District Sample Size
Key Populations High Risk Males
DFSW IDFSW PWID Waria MSM Sailor Loading Truck Motor
Worker Driver Driver
North Sumatra Medan 250 250 400
Deli Serdang dan
Serdang Bedagai 250 300 300
Riau Islands Batam 250 250 400
Jakarta Jakarta Utara 250 250 250 250 400
Jakarta Barat 250
West Java Bandung 250 250 250 250 250
Bekasi 250 250
Central Java Semarang 250 250 250 250 250 400
Batang 250 400
East Java Surabaya 250 250 250 250 250 400
Banyuwangi 250
Malang Raya 250 250 250 250 250
Bali Denpasar 250 250 250 400
East Nusa Kupang 250 250 400
Tenggara
Papua Jayapura 250 250 300
Wamena 250
Lampung Bandar Lampung 250 250
Lampung Selatan 400
Maluku Ambon 250 250 400
Table A-4 Comparison 2012 PSE to 2016 PSE
PSE 2012 PSE 2016 Definitions
KPs to be estimated FSW analyzed by DFSW and FSW analyzed as a single KP
IDFSW subgroups
Time frame of definition Broader definition: no time Narrower definition, time frame is
of KPs frame applied one year (excluded waria)
Extrapolation models
Source of outcome Multiple data mapping sources Unstandardized 2012 mapping
variable (unstandardized) and was data, Standardized 2014 and 2015
selected based on criteria. mapping data.
The coverage of mapping data The coverage of mapping data
available ranged from 24% available was range from
to 52% 14% to 22%
Coverage of mapping 119 to 260 districts per KP, 72 to 114 districts per KP,
data corresponding to 24% to 52% corresponding to 14% to 22%
coverage of districts: coverage of districts:
DFSW (51%), IDFSW (52%) FSW (22%)
Waria (52%) Waria (19%)
MSM (29%) MSM (20%)
PWID (24%) PWID (14%)
Data cleaning and Considering in one district Each district has one
consideration of may have more than one consolidated mapping
mapping data mapping data from data; therefore, all mapping
different institution, implausible data were used.
mapping counts and extreme data points were excluded.
Source of predictors PODES 2011, Population PODES 2015, SAKERNAS 2015,
projection 2012 SUSENAS 2015, Census
Population projection 2015
Selection of predictors Implicit conceptual framework Explicit conceptual framework
Regression diagnostics Standard diagnostics were Prior to regression process,
conducted to assess whether classical assumption regression
theoretical assumptions test was conducted:
were met:
• plots of predicted values • plots of predicted values
against each predictor to against each predictor to
assess linearity assess linearity
• plots of residuals against • plots of standardized