on Sulfonated Polystyrene (Sunit Hendrana)
ROLES OF PREPARATION METHOD ON CHARACTERISTICS
OF SUPRAMOLECULAR-STRUCTURED POLYMER
ELECTROLYTE MEMBRANE FUEL CELL BASED ON
SULFONATED POLYSTYRENE
Sunit Hendrana
1, Morina Septiviani Semboor
2, Christi Liamita Natanael
2,
Iman Rahayu
2, Mashadi
3and Sudirman
31Research Centre for Physics - LIPI
Kawasan Puspiptek, Serpong 15314, Tangerang Selatan
2Chemistry Department, Faculty of Mathematics and Natural Sciences - Padjadjaran University
Jatinangor, Jawa Barat
3Center for Science and Technology of Advanced Materials - National Nuclear EnergyAgency
Kawasan Puspiptek, Serpong 15314, Tangerang Selatan Email: [email protected]
Received: 3 February 2017 Revised: 6 July 2017 Accepted: 12 July 2017
ABSTRACT
ROLES OF PREPARATION METHOD ON CHARACTERISTICS OF SUPRAMOLECULAR-STRUCTURED POLYMER ELECTROLYTE MEMBRANE FUEL CELL BASED ON SULFONATED POLYSTYRENE. Polymer Electrolyte Membrane Fuel Cell with supramolecular structure based on Sulfonated Polystyrene (S-PS) have been developed in Research Centre for Physics LIPI. In forming the supramolecular structure sulfonate groups in S-PS are aligned with polyethylene-graft-maleic anhydride (PE-g-MA) which carried out by dissolution of the constituent and mixing of both. The alignment of sulfonate groups in s-PS is carried out in a liquid form. Therefore, in this study, the effect of concentration of the solution of both polymers constituent to the alignment of the sulfonate groups and the characteristics of the membrane produced is studied. Scanning Electron Microscope (SEM) images show that all membranes prepared are rigid. Differential Scanning Calorimetry (DSC) studied show very significance differences in its crystal sizes. XRD diffraction data also support the previous results. Membrane prepared from very dilute solution having better ion exchange capacity (IEC), water uptake and ionic conductivity. Therefore, the experiments results showing that very low concentration of polymer constituent, clearly, produced better interaction of both, which agree with hyphotesis in this work where supramolecular structure can be formed by mixing two very dilute polymer solutions.
Keywords:PEMFC, Sulfonated polystyrene, PE-g-MA, Supramolecular structure
ABSTRAK
PERAN METODE PREPARASI PADA KARAKTETISTIK DARI POLIMER ELEKTROLIT
MEMBRANFUEL CELLDENGAN STRUKTUR SUPRAMOLEKULAR BERBASIS POLISTIREN
TERSULFONASI. Polimer Elektrolit Membran Fuel Cell dengan struktur supramolekular berbasis polistirena tersulfonasi (S-PS) telah dikembangkan di Pusat Penelitian Fisika LIPI. Pada pembentukan struktur supramolekular gugus sulfonat pada polistirena tersulfonasi diarahkan dengan polietilen-graft-anhidrida maleat (PE-g-MA) yang dilakukan dengan melarutkan kedua bahan penyusun tersebut. Pengarahan gugus sulfonat dari S-PS dilakukan dalam kondisi cair. Karenanya, dalam studi ini, efek dari konsentrasi dari kedua larutan polimer penyusun pada pengarahan gugus karbonat dimaksud dan karakteristik-karakteristik dari membran yang dihasilkan akan dipelajari. Image SEM menunjukkan bahwa semua membran yang dibuat adalah rigid. Studi DSC
INTRODUCTION
Membrane is one of essential part in polymer electrolyte membrane. The membrane shall have owing high conductivity of ion, and at the same time, shall owing low conductivity of electron over 100 oC [1-2].
Nafion®of DuPont de Nemours is of Perfluorocarbon
type polymer electrolyte membranes available in the market [3-4]. Despite their superior properties in chemical resistance, stability in operation, and stability in big pressure difference [5-6], it owes weakness in methanol crossover, humidity control and high cost [7-8].
Therefore, there are some effort to make polymer membrane other than perfluorocarbon polymer [1, 4, 9]. There some types of membrane [10-13] including mixed matrix membranes [14]. The latter may include an addition of nanoparticle in their membrane formulation [15-17] which can improve ionic conductivity and transport selectivity of the membrane prepared. However, as cost is also concern, there are also another trend in developing new fuel cell membrane form in expensive material [18]. This leads to the attention on sulfonated polystyrene [19-22] which easily available in the market and beside its ability for DMFC application [23-24].
However, there are differences between Nafion®
and sulfonated polystyrene in term of mobility of their sulfonate groups. Figure 1 (a) showing the nano structure of sulfonate group within Nafion® membrane [25]. This figure show the flexibility of sulfonate group in sulfonate
domains within the bulk of the membran due to the length of pendant group where sulfonate group is attached on. The group in Nafion®attached in the pendant
group which consist of at least 8 atomic length to 18 atomic length [2]. While in sulfonated polystyrene, the sulfonate group locate in benzene molecule which directly attached into the main backbone (see Figure 1 (b)). Therefore, sulfonate groups in sulfonated polystyrene are not as free as the one in Nafion®and
create steric hyndrance. Consequently, sulfonate group in sulfonated polystyrene have difficulties to form a sulfonate cluster/sulfonate domain as occurs in Nafion®
because those steric hyndrance of the benzenic group where sulfonate is attached.
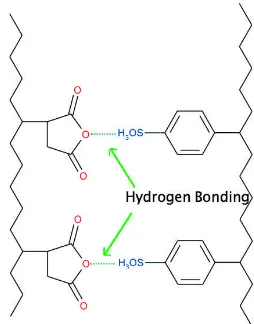
To overcome the above situation, this work tries to aligned the sulfonate group and not forming sulfonate domain such occurs in Nafion®. The alignment would be made by forming hydrogen bonding between anhidride group in PE-g-MA and sulfonate group in S-PS. The formation of hydrogen bonding between one along one single polymer molecule with others single polymer molecules forming a supramolecular structure. The pictorial description of the supramolecular structure can be seen in Figure 2. One long single S-PS molecule, for example, may forms hydrogen bond with anhydride group from two or more different PE-g-MA. The maleated Polyolefin is selected for this purpose because the graft mostly only with single molecule [26-27], beside their excellent properties in industrial point of view [28].
bahwa dengan larutan yang sangat encer dari polimer penyusunnya, secara nyata, menghasilkan interaksi diantara polimer penyusun yang lebih baik, yang mana hal ini sesuai dengan hipotesis penyusunan struktur supramolekular melalui pencampuran dua polimer dengan konsenstrasi sangat encer.
Kata kunci: PEMFC,Polistirena tersulfonasi, PE-g-MA,Struktur supramolekular
Nafion® sulfonated polystyrene
Figure 1. Ilustration of sulfonate group in sulfonate
cluster in Nafion® [2] (a) and the pictorial ilustration of comparison between Nafion® and sulfonated polystyrene
Figure 2. Pictorial description of supramolecular
on Sulfonated Polystyrene (Sunit Hendrana)
According to the above explanation, it is clear that formation of supramolecular structure occurs in solution state. Therefore, two polymers constituent should be dissolve in proper solvent prior to mixing to form supramolecular structure. However, polymer molecules in solution usually coiled and mostly entangled. The entangled molecules would disturb or even prevent the formation of hydrogen bond to form supramolecular struture.
Accordingly, attention have to be paid for the preparation of polymers’ solution. The principles of sample preparation for molecular weight measurement of polymer is applied for this purposes, in which polymer solution shall be as dilute as possible [29]. For example, in preparing samples for Gel Permeation Chromatography measurement to measure average molecular weights of polymer, it is suggested that polymer solution in very dilute state in order to be able for polymer molecules having no aglomeration (or not entangled).
Therefore, in this works membrane prepared with different preparation method based on variation of concentration of polymer constituents and mixed them prior to casting to form membrane to prove the above concept and investigate their membrane’s characteristic.
EXPERIMENTAL METHOD
Chemicals
The solvent, i.e. toluene and methanol are from Merckp.a.grade. Polyethylene-graft-maleic anhydride is supplied fromAldrich Lot#MKBG0507V. Benzimidazol is supplied fromAldrich Lot.: S04704-124.All chemicals are used directly without any treatment before used. Sulfonated polystyrene are prepared by a method developed in our Lab [30].
Membrane Preparation
All membrane’s ingredients, S-PS, PE-g-MAH, and benzimidazol, are prepared in powder. They are mixed manually and then dissolve in various volume of solvent, i.e. toluene:methanol (9:1,v/v).
The formulas (shown in Table 1) were dissolved in the solvent at 40 oC, followed by casting in teflon
surface with glass wall to form rectangular shape. Temperature of the surface is 40 oC. The membrane is
hot rolled at 150oC prior to designated measurements.
Instrumental Analysis
Fourier Transform Infrared (FT-IR) were analysis using FT-IR Shimadzu 4300. The film for FT-IR measurement were prepared by performing hot press for a membrane being measured at 500 kg/cm2for 10 seconds.
The scanning of FT-IR run from wavenumber 4000 cm-1
to 400 cm-1at a resolution of 2 cm-1, at a double beam
measurement for 16 accumulations.
For Scanning Electron Microscope (SEM), the sample were dipped in liquid Nitrogen before be broken into two pieces, and the cross section of the broken membrane we laminated with gold before measurement. Differential Scanning Calorimetry were scanned from room 25 to 260 oC at the rate of 20 oC/minutes for
the first run and at 10 oC/minutes in the second run. The
presentation of data is the second run one.
Microscope Optic measurement were carried out with magnification of 100 times.
Water Uptake were measured by putting the sample in the closed bath with water inside the bath and taken into oven at 50 oC for scheduled measurement.
The water uptake (W) were calculated using the Equation (1).
... (1)
where is difference weight after and before
adsorption, and is membrane volume (in cm3).
Chemical Analysis
In the ion exchange capacity determination, the membranes were dried at 40 oC with vaccuum of 0,1 atm
until constant weight. The dried membranes were soaked in 0.1 M NaCl solution overnight. The proton content in the salt solution were titrated using 0,01 N NaOH solution with Phenolphtalein as indicator. Ion Exchange Capacity (IEC) were measured using Equation (2).
... (2)
where,MH+is proton concentration, andW
dried is weight
of the samples after dried-vaccum.
RESULTS AND DISCUSSION
Role of solution concentration
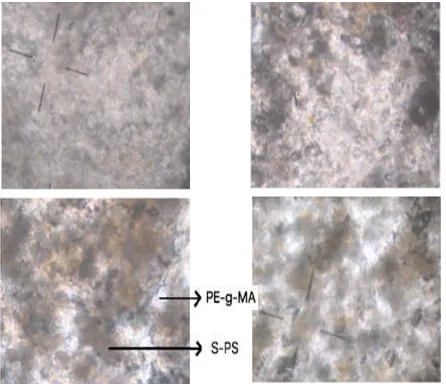
Figure 3 is an optical microscope image of membrane prepared using approach applied in this paper. Image in Figure 3 (a) show much better homogen profile than that of the others three,i.e.Figure 3 (b) for M2 membrane, Figure 3 (c) for M3 membrane, and Figure 3 (d) for M4 membrane. The later three membranes
Table 1. Basic formula for preparation of
have transparant region and non-transparant (dark-grey) region which indicate separation of two. The white-transparant color is PE-g-MAH region and the dark-grey region is S-PS region. While M1 membrane shows no such separation indicating homegeneity of both polymer constituents, S-PS and PE-g-MA. This data indicate an excellent interaction between S-PS and PE-g-MA, which also could means an oocurance of supramolecular structure that hypothesized have been taken place.
In concentrated solution, M4 membrane in Figure 3(d), most of polymer constituent are separated in two regions, i.e. white-transparant region and dark-grey region. This separation becomes less and lesser (see Figure 3 (c) and Figure 3 (b)) and disappearing in M1 membrane when the polymer solutions to prepare the membrane at very dilute. This is the evidence that very dilute solution, which polymer molecule in single form and not entangled, can promote better interaction to form supramolecular structure through formation along every single polymer molecule. One single polymer preferably form hydrogen with many single polymer of the polymer opponents. This situation is hard to occurs when the polymer solutions are not in dilute state as entangled polymers still present in the solution which, then, inhibit the formation of hydrogen bond due to the nature of entangled polymer molecules itself (or aglomeration). This is the evidence that solution concentration is very important to designed the interaction as required. This is agree with a characteristic of polymer in solution [31] and that to prevent aglomeration, or entanglement amongst single polymer molecules, it is need to bring the solution into very dilute state, or as dilute as possible [29].
Further investigation on Fourier Transform Infrared (FT-IR) was performed to clarify. The result is presented in Figure 4. Strong broad absorption at
3500 cm-1 as shown in |Figure 4 show strong
intermolecular hydrogen bond in sample M1, which is much higher than that of three other membranes. The strong intermolecular hydrogen bond in the sample, shown in FT-IR spectogram, agree with homogen distribution of both polymers constituent of the membrane, shown in optical microscope images in Figure 3.
This fact is an evidence that in the state where there are single polymer without entanglements could produce better interaction between polymer to form an designed interaction proposed, as describe in Figure 2. The solid morphology of membrane with supramolecular structure also shown in Scanning Electron Microscope (SEM) images depicted in Figure 4. The cross section of M1 membrane (Figure 5 (a)) shows solid and rigid image. Other membranes,i.e.M2 membrane, M3 membrane and M4 membrane in Figure 5 (b), 5 (c), and 5 (d) respectively, show cutlet of two constituens polymers in various
Figure 3. Optical microscope images of membranes
prepared using approach applied in this paper: (a). M1 membrane, (b). M2 membrane, (c). M3 membrane, and (d). M4 membrane at magnification of 40 X.
Figure 5.Scanning Electron Microscope (SEM) images
of cross section of membranes prepared using approach applied in this paper: (a) M1membrane, (b) M2 mem-brane, (c) M3 membrane and (d) M4 membrane.
(a) (b)
(c) (d)
Figure 4.FT-IR Spectogram of membrane prepared in
on Sulfonated Polystyrene (Sunit Hendrana)
degree. This is obvious that M1 have have the best homogeneity than the other three membranes and is agree with bulk properties as shown in optical microscope images (Figure 3). Furthermore morphology of membrane will affect membrane performances [32], and it will be discussed latter.
Structural changes
Figure 6 is DSC scanning of the membranes showing the importance of preparing membrane in very dilute solution. The second order thermal transition (glass transition temperature, Tg) of M2, M3 and M4 membrane occurs at similar temperature,i.e.at around 78oC (showing by blue solid arrow). On the other hand,
the Tgof M1 membrane lies at around 68,5oC (showing
by blue dashed arrow), indicating the new amorphous region in membrane having different interaction have been made. This could happen as in the preparation of M1 membrane, the concentration of polymers constituents is very low, allowing the possibility every single molecules present without entanglements. In this state, the formation of hydrogen bonding from every single polymer with other opponent single polymer molecules is much more easy and much more possible.
Moreover, the first order thermal transition, or melting point, Tm, also showing the evidence in the structural changes of the membranes, i.e. in the region of crystalline structure. Tm prepared with
concentrated solution, i.e. M4 membrane and M3
membrane, show two different region of the thermal transition. While, in membrane prepared
with medium dilute solution, i.e. M2 membrane,
showing transition that lies those two region, indicating there is an evidence of stronger interaction between polymer constituents. Furthermore, membrane prepared with very dilute solution,i.e.M1 membrane, the first thermal transition lies in lower temperature. This is an evidence the formation new crystalline structure that it could be attribute to the formation of supramolecular structure.
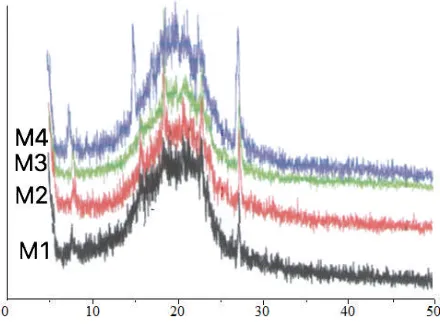
The change in crystalline structure also can also be proven in the XRD difractogram shown in Figure 7. The 2-tetha diffraction at 14.5 of membrane M4 shift into higher diffraction in membrane M3 and M2, and it is disappearing in membrane M1. In addition, membrane M1 also have higher shoulder in lower diffraction (see the arrow).
Those DSC and X-RD data are evidences of the structural change either in amorphous or in cryslline region.
Membrane Characteristics
During operation PEMFC, humidity in the membrane is very importance [33]. Water Uptake could affect cell performance [34]. Water will assist H+ion to
attached to sulfonate groups region in membrane which then enabling a current of ion from anode to cathode. Humidification will improve proton conduction by reducing proton resistivity [35]. Humidification could have different impact on every part of PEMFC system [36]. Therefore, water uptake is very important parameter
Figure 8. Variation of water uptake of various
mem-brane, M1 memmem-brane, M2 memmem-brane, M3 memmem-brane, and M4 membrane with time
Figure 7. X-RD Diffractogram of membranes prepared
using approach applied in this paper M1 membrane, M2 membrane 2, M3 membrane, and M4 membrane.
Figure 6. Thermal scanning of Differential Scanning
for success of PEMFC operation. Figure 6 show the variation of water uptake of various membrane with time. The characteristics of the membran is very good, since the water uptake remain quite stable after long periode test (30 minutes). It means the membrane can maintain performance, because the water state will remain the same at the same water concentration on membrane. The change in water content will influence water state in membrane [18], that would lead to change in ionic conductivity [37-38]. The decrease of water uptake at 10 minutes observation to M1 membrane and M3 membrane may caused by desorption phenomena [39].
Figure 8 show that in membrane prepared with very concentrated polymer solution (M4 membrane) have very high variation in water uptake along 30 minutes experiment, this could be caused by inhomogeneity of bulk of membrane as can be seen in Figure 3 (d) and the discussion within. Membrane M2 and M3 show steady increasing of water absorption. While membrane M4 show higher water uptake at long operation (in this data during 30 minutes water uptake experiment). The latter could be associate with structural change in crystalline and amorphous region [40-43].
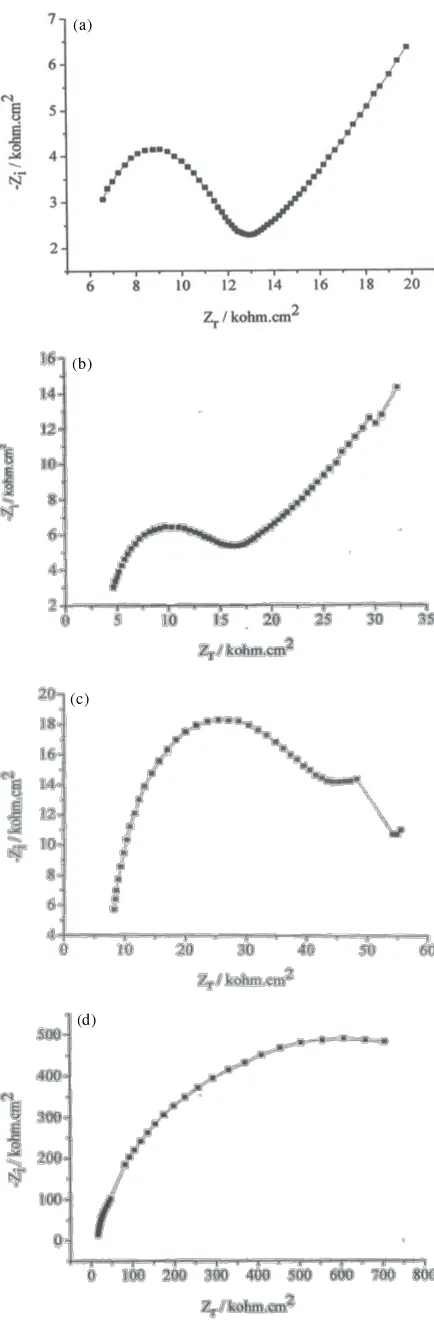
Figure 9 is Ny-quist plot of membranes prepared in this works. Membrane M4 show very good typical solid electrolyte which can not be seen in membrane M3 and M4. Though membrane M2 show similar Ny-quist profile to that of membrane M1, the membrane does not show bulk homogeneity.
Moreover, membrane with supramolecular structure also show the best ion exchange capacity (IEC) amongst them, as listed in the Table 2.
The higher Ion Exchange Capacity (IEC), the higher ionic conductivity will be, because IEC represent capability of membrane to facilitate a movement of ion,
i.e.hydronioum ion, in membrane [38].
From the above data, it is clear that the highest value on IEC of membrane M1strongly related to its morphology and water uptake, which is agree with previous work that membrane morphology affect on selectivity and other membrane characterictics [44].
CONCLUSION
A new approach for preparation of membrane for polymer electrolyte fuel cell based on polystyrene have been introduced. The approche, which involving alignment of sulfonate group in sulfonated polystyrene to form supramolecular structure with
polyethyelen-graft-Figure 9.Ny-quist plot of (a). M1 membrane, (b). M2
membrane, (c). M3 membrane, and (d). M4 membrane. (d)
(c) (a)
(b)
No Sample Code Ion Exchange Capacity (meq.g-1
)
1. M1 0.35
2. M2 0.32
3. M3 0.24
4. M4 0.25
on Sulfonated Polystyrene (Sunit Hendrana)
aleic anhydride have been proven. In this work membrane with supramolecular structure have been prepared by employing properties of polymer in solution. Membrane prepared with the solution with only single polymer molecules within, can form excellent supramolecular structure showing by FT-IR, DSC, SEM data and also optical microscope image for bulk evaluation. This work also showing that methode for membrane preparation, i.e using dilute or concentrated solution, strongly affect the final products.
ACKNOWLEDGEMENT
This research is funded by Riset Kompetitif LIPI dan Riset Unggulan LIPI
REFERENCES
[1]. L. Gubler and G. G. Scherer. “Trends for Fuel Cell Membrane Development.” Desalination, vol. 250, pp. 1034-1037. 2010.
[2]. B. Pengq and J. Chen. “Functional materials with high-efficiency energy storage and conversion for batteries an fuel cells,” Coordination Chemistry Reviews , vol. 253, pp. 2805-2813, 2009.
[3]. K. A. Mauritz and R. B. Moore. “State
Understanding of Nafion.” Chemical Review, vol. 104, pp. 4535-4585, 2004.
[4]. M. Rikukawa and K. Sanui. “Proton-Conducting Polymer Electrolyte Membranes Based on Hydrocarbon Polymers.” Progress in Polymer Science, vol. 25, pp. 1463-1502, 2000.
[5]. K. Kordesch and G. Simader. “Chapter 4,” in Fuel Cells and Their Applications, Weinheim, 1996. [6]. J. Larminie and A. Dicks. “in Fuel Cell System
Explained.” Great Britain: Wiley, 2000.
[7]. T. V. Nguyen and N. Vanderborgh. “The Rate of Isothermal Hydration of Perfluorosulfonic Acid Membranes.” J. Membr. Sci., vol. 143, p. 235. 1998. [8]. W. S. Ho and K. K. Sirkar. “Membrane Handbook”. New York : Van Nostrand Reinhold, 1992, pp. 236-237.
[9]. C. Wannek, A. Glusen and d. Stolten. “Materials, manufacturing technology and costs of fuel cell membranes.” Desalination, vol. 250, pp. 1038-1041. 2010.
[10]. R. E. Rosli, A. B. Sulong, W. R. Daud, M. A. Zulkifley, T. Husaini, M. I. Rosli, E. Majlan and M. A. Haque. “A Review of High-Temperature Proton Exchange Membrane Fuel Cell (HT-PEMFC) System.” International Journal of Hydrogen Energy, vol. 42, pp. 9293-9314. 2017.
[11]. H. Lade, V. Kumar, G. Arthanareeswaran and A. F. Ismail. “Sulfonated Poly(Arylene Ether Sulfone) Nanocomposite Electrolyte Membrane for Fuel Cell Applications: A review.” International Journal of Hydrogen Energy, vol. 42, pp. 1063-1074. 2017.
[12]. M. A. Hickner, H. Ghassemi, Y. S. Kim, B. R. Einsla and J. E. McGrath. “Alternative Polymer Systems for Proton Exchange Membranes (PEMs).” Chemical Review, vol. 104, pp. 4587-4612, 2004. [13]. A. Chandan, M. Hatternberger, A. El-kharouf, S.
Du, A. Dhir, V. Self, B. G. Pollet, A. Ingram and W. Bujalski. “High Temperature (HT) Polymer Electrolyte Membrane Fuel Cells (PEMFC) e A review.” Journal of Power Sources, vol. 231, pp. 264-278, 2013.
[14]. E. Bakangura, L. Wu, L. Ge, Z. Yang and T. Xu. “Mixed Matrix Proton Exchange Membranes for Fuel Cells: State of the art and perspectives.” Progress in Polymer Science, vol. 57, pp. 103-152. 2016.
[15]. S. E. Bozbag and C. Erkey, “Supercritical Fluids in Fuel Cell Research and Development (Review),” The Journal of Supercritical Fluids, vol. 62, pp. 1-31. 2012.
[16]. D. S. Su and G. Centi, “A Perspective on Carbon Materials for Future Energy Application.” Journal of Energy Chemistry, vol. 22, pp. 151-173, 2013. [17]. A. B. Yaroslavtsev. “ Composite Materials With
Ionic Conductivity: from Inorganic Composites to Hybrid Membranes.” Russian Chemical Reviews. vol. 11, pp. 1013-1029, 2009.
[18]. D. V. Golubenko, E. Y. Safronova, A. B. Ilyin, N. V. Shevlyakova, V.A. Tverskoi, L. Dammak, D. Grande and A. B. Yaroslavtsev. “Influence of The Water State on The Ionic Conductivity of Ion-Exchange Membranes Based on Polyethylene And Sulfonated Grafted Polystyrene.” Materials Chemistry and Physics, vol. 197, pp. 192-199, 2017. [19]. N. Kang, J. Shin, T. S. Hwang and Y.-S. Lee. “A Facile Method for The Preparation of Poly(Vinylidene Fluoride) Membranes Filled with Cross-Linked Sulfonated Polystyrene.” Reactive and Functional Polymers, vol. 99, pp. 42-48. 2016. [20]. E. F. Abdrashitov, D. A. Kritskaya, V. C. Bokun, A. N. Ponomarev, K. S. Novikova, E. A. Sanginov and Y. A. Dobrovolsky. “Synthesis and properties of stretched polytetrafluoroethylene–sulfonated polystyrene nanocomposite membranes.” Solid State Ionic, vol. 286, pp. 135-140. 2016.
[21]. P. Kumar, K. Dutta, S. Das and P. K. Kundu. “Membrane Prepared by Incorporation of Crosslinked Sulfonated Polystyrene in The Blend of Pvdf-Co-HFP/Nafion: A Preliminary Evaluation for Application in DMFC.” Applied Energy, vol. 123, pp. 66-74, 2014.
[23]. J.-P. Shin, B.-J. Chang, J.-H. Kim, S.-B. Lee and D. H. Suh. “Sulfonated Polystyrene/PTFE Composite Membranes.” Journal of Membrane Science, vol. 251, pp. 247-254. 2005.
[24]. P. Kumar, K. Dutta, S. Das and P. P. Kundu. “Membrane prepared by incorporation of crosslinked sulfonated polystyrene in the blend of PVdF-co-HFP/Nafion: A preliminary evaluation for application in DMFC.” Applied Energy, vol. 123, pp. 66-74, 2014.
[25]. H. -G. Haubold, T. Vad and H. Jungblud. “Nano structure of NAFION: a SAXS study.” Electrochimica Acta, vol. 46, no. 10-11, pp. 1559-1563, 2001.
[26]. W. Heinen, C. H. Rosenmöller, C. B. Wenzel, H. J. de Groot, J. Lugtenberg and M. van Duin., “13C NMR Study of the Grafting of Maleic Anhydride onto Poyethene, Polypropene, and Ethene-Propene Copolymers.” Macromolecules, vol. 29, pp. 1151-1157. 1996.
[27]. M. Sclavons, V. Carlier, B. De Roover, P. Franquinet, J. Devaux and R. Legras. “The Anhydride Content of Some Commercial PP-g-MA: FTIR and Titration,” Journal ofApplied Polymer Science, vol. 62, pp. 1205-1210. 1996.
[28]. I. Vicente, J. Campos, J. M. Bordado and M. R. Ribeiro. “Maleic Anhydride Modified Ethylene-Diene Copolymers: Synthesis and Properties,” Reactive and Functional Polymer. vol. 68, pp. 519-526, 2008.
[29]. P. M. Doty and H. Mark. “Size and Shape of Macromolecues in Solution.” Ind. Eng. Chem., vol. 38, no. 7, pp. 682-686. 1946.
[30]. S. Hendrana, “Metode Kontrol Sulfonasi Molekular Pada Sulfonasi Heterogen Fasa Gas- Cair”. Indonesia Patent P0020090096, - - 2009.
[31]. W. -F. Su, “Chapter 2 Polymer Size and Polymer Solutions,” in Principles of Polymer Design and Synthesis, Vols. LNC, V 82, Berlin: Springer-Verlag, 2013, DOI: 10.1007/978-3-642-38730-2_2.
[32]. R. L. Thankamony, J.-M. Hwang and T.-H. Kim. “Azide-Assisted Terminal Crosslinking Of Ionomeric Blocks: Effects on Morphology and Proton Conductivity.” Journal of Membrane Science, Vol. 392-393, pp. 58-65. 2012.
[33]. M. M. Mench. “Polymer Electrolyte Fuel Cells.” in Fuel Cell Engines, New Jersey: John Wiley & Sons, 2008, pp. 298-301.
[34]. C.-Y. Jung and S.-C. Yi. “Influence of The Water Uptake in The Catalyst Layer for The Proton Exchange Membrane Fuel Cells.” Electrochemistry Communications, vol. 35, pp. 34-37, 2013.
[35]. S. Galbiati,A. Baricci,A. Casalegno and R. Marchesi. “Experimen study of water transport in a polybenzimidazole-based high temperature PEMFC.” International Journal of Hydrogen Energy, vol. 37, pp. 2462-2469., 2012.
[36]. T. V. Reshetenko, G. Bender, G. Bethune and R. Rocheleu. “Systematic studies of The Gas Humidification Effects on Spatial PEMFC Performance Distributions,” Electrochimica Acta, 2010. doi:10.1016/j.elecacta.2012.02.111, pp. [37]. Z. Wan, H. Chang, S. Shu, Y. Wang and H. Tang.
“A Review on Cold Start of Proton Exchange Membrane Fuel Cells.” Energies, vol. 7, pp. 3179-3203, 2014.
[38]. E. López-Chávez, Y. Pçna-Castañeda, G. González-García, P. Perales-Enciso,A. García-Quiroz and J. I. Díaz-Góngora. “Theoretical methodology for Calculating Water Uptake and Ionic Exchange Capacity Parameters of Ionic Exchange Membranes with Applications in Fuel Cells.” International Journal of Hydrogen Energy, vol. 40, pp. 17316-17322, 2015.
[39]. S. Chaudary, V. K. Sachan and P. K. Bhattacharya. “Two Dimensional Modelling of Water Uptake in Proton Exchange Membrane Fuel Cell.” International Journal of Hydrogen Energy, vol. 39, pp. 17802-17818. 2014.
[40]. A. Danch and W. Osoba. “Structural Relaxation of the Constrained Amorphous Phase in the Glass Transition Zone.” Journal of Thermal Analysis and Calorymetry, vol. 72, pp. 641-650, 2003.
[41]. I. Bocharnikova, L. A. Wasserman, A. V. Krivandin, J. Fornal, W. Blaszczak, V. Y. Chernykh,A. Schiraldi and P. V. Yuryev. “Structure and Thermodynamic Melting Parameter of Wheat Starches with Different Amylose Content.” Journal of Thermal Analaysis and Calorimetry, vol. 74, pp. 681-695. 2003. [42]. S. H. de Almeida and Y. Kawano. “Thermal
Behaviour of Nafion Membrane.” Journal of Thermal Analysis dan Calorimetry, vol. 58, pp. 569-577. 1999.
[43]. F. H. Sànchez, J. M. M. Dueñas and J. G. Ribelles. “Influences of the Molecular Mass on the Segmental Relaxation Times of Polystyrene Determined by DSC.” Journal of Thermal Analysis dan Calorimetry, vol. 72, pp. 631-640, 2003. [44]. V. M. Barragán and M. Pérez-Haro. “Correlations
Between Water Uptake and Effective Fixed Charge Concentration at High Univalent Electrolyte Concentrations in Sulfonated Polymer
Cation-Exchange Membranes with Different