Journal of Physics: Conference Series
PAPER • OPEN ACCESS
The role of visual representation in physics
learning: dynamic versus static visualization
To cite this article: Agus Suyatna et al 2017 J. Phys.: Conf. Ser.909 012048
View the article online for updates and enhancements.
Related content
Microscopic Virtual Media (MVM) in Physics Learning: Case Study on Students Understanding of Heat Transfer
F C Wibowo, A Suhandi, D Rusdiana et al.
-Student Analysis of Handout Development based on Guided Discovery Method in Process Evaluation and Learning Outcomes of Biology
S Nerita, A Maizeli and A Afza
-Development of soft scaffolding strategy to improve student’s creative thinking ability in physics
Novinta Nurulsari, Abdurrahman and Agus Suyatna
1234567890
International Conference on Science and Applied Science 2017 IOP Publishing IOP Conf. Series: Journal of Physics: Conf. Series 909 (2017) 012048 doi :10.1088/1742-6596/909/1/012048
The role of visual representation in physics learning: dynamic
versus static visualization
Agus Suyatna1, Dian Anggraini2, Dina Agustina2, Dini Widyastuti 2
1 Lecturer of Physics Education Study Program, Lampung University,
Jl. Prof. Dr. Sumantri Brojonegoro No. 1 Bandar Lampung, INDONESIA
2 Student of Physics Education Study Program, Lampung University,
Jl. Prof. Dr. Sumantri Brojonegoro No. 1 Bandar Lampung, INDONESIA
E-mail: [email protected]
Abstract. This study aims to examine the role of visual representation in physics learning and to compare the learning outcomes of using dynamic and static visualization media. The study was conducted using quasi-experiment with Pretest-Posttest Control Group Design. The samples of this research are students of six classes at State Senior High School in Lampung Province. The experimental class received a learning using dynamic visualization and control class using static visualization media. Both classes are given pre-test and post-test with the same instruments. Data were tested with N-gain analysis, normality test, homogeneity test and mean difference test. The results showed that there was a significant increase of mean (N-Gain) learning outcomes (p <0.05) in both experimental and control classes. The averages of students’ learning outcomes who are using dynamic visualization media are significantly higher than the class that obtains learning by using static visualization media. It can be seen from the characteristics of visual representation; each visualization provides different understanding support for the students. Dynamic visual media is more suitable for explaining material related to movement or describing a process, whereas static visual media is appropriately used for non-moving physical phenomena and requires long-term observation.
1. Introduction
2
1234567890
International Conference on Science and Applied Science 2017 IOP Publishing IOP Conf. Series: Journal of Physics: Conf. Series 909 (2017) 012048 doi :10.1088/1742-6596/909/1/012048
classroom; However, such representational designs are not always beneficial to learners [3]. This depends on the nature of the phenomenon to be visualized. Science concepts are often abstract and difficult to understand for students. Visualizations have been shown to help students develop scientific conceptions [4, 5]
Dynamic fluid, impulse & momentum, and rotate motion are topics of physics learned in high school that is very important to be understood by students because the phenomenon is always experienced in everyday life. The ideal and true fluid phenomena, the principle of continuity, the principle of Bernoulli and its application, such as the flow of water in the pipe, the flow of water in the leaking tank, the flight of an airplane, the occurrence of the wind-fired roof, and the simulation of the difference in air pressure when a rider motorcycles passing on the highway overtake large cars are often encountered in daily life, but the fluid stream could not be seen directly so need visualization. Likewise in the material impulse and momentum, on the event of the collision where the force works in a short time and difficult to dismiss it, thus making students difficult to observe. To understand this, learners can not only imagine when the process of impulse and momentum occur. Therefore, the use of visual media will greatly assist students in understanding the concept. Rotational motion events, though easily observable in everyday life, but still difficult to imagine the centripetal style or complex relationship on the gear of bicycle. Everything requires visualization of images.
Vision is the construction of efficient symbolic descriptions from images of the world. An important aspect of vision is, therefore, the choice of representations for the different kinds of information in a visual scene [6]. Visualization objects can be pictures, three-dimensional models, schematic diagrams, geometrical illustrations, computer-generated displays, simulations, animations, videos and so on. Objects can be displayed in a variety of media formats, including paper, slides, computer screens, interactive whiteboards or videos, and may be accompanied by sound and other sensory data [7]. Visualization can be done using images that are static or dynamic. Static visualizations are still images such as photos, pictures, graphics, charts. Dynamic visualization of images that can live like silent movies, simulations, animations, that illustrate the process coherently so that messages can be delivered.
This study aims to examine the role of visual representation in physics learning (Dynamic Fluid, Impulse & Momentum, and Rotate Motion) and to compare the learning outcomes that are taught by dynamic visual and static visual media
2. Method
2.1. Research Design
The study was conducted using quasi-experiment with design Pretest-Posttest Control Group Design. Quasi-experiment is a research design involving an experimental approach but where random assignment to treatment and comparison groups has not been used.
2.2. Participants
The population in this research consists of grade XI IPA senior high school students in odd semester academic year 2016/2017 in Lampung Province. The sampling technique used in this research is purposive sampling technique. Sampling is done by selecting three equivalent Senior High School in Lampung Province, and then two equivalent classes from each school are taken as the sample.
2.3. Procedure
1234567890
International Conference on Science and Applied Science 2017 IOP Publishing IOP Conf. Series: Journal of Physics: Conf. Series 909 (2017) 012048 doi :10.1088/1742-6596/909/1/012048
done after the learning finished. The test type is an essay. Data were analyzed using calculating normalized gain <g> using formula
<g>=(Sposttest-Spretest)/(Smax-Spretest) [8]
Increased category of learning outcomes according to [8] as follows. <g> < 0.3 Low category
0.3 < <g> < 0.6 Medium category <g> > 0.6 High category
In each pair of data group, the test of normal distribution, homogeneity test, and average difference test of N-gain were done.
3. Results and Discussion
The data of pre-test, post-test, and the test of N-Gain in different class which learning using dynamic visual media and using static visual media is shown in Table 1. Normal distribution test on N-gain of all data groups obtained that data distribution is not normal, so that the different test of N-gain uses a statistical test of non-parametric Mann-Whitney U.
Table 1. Pre-test, post-test, N-Gain, and p of difference test
Matter
Using Media Visual Dynamic Using Media Visual Static
p
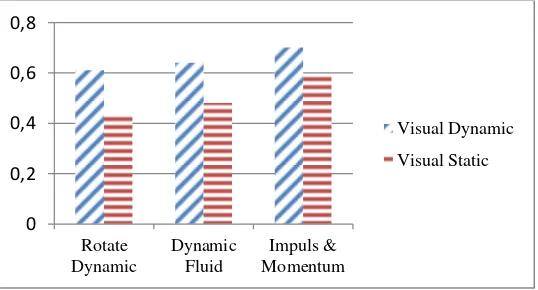
The result of data analysis showed that both classes using dynamic visual media and static visual media significantly increase in physic learning outcomes, but based on Mann-Whitney U test results, there was a significant difference of N-Gain (p <0.05) between the learning classes using dynamic visual media and using static visual media for all matter, Rotate Dynamic, Dynamic Fluid, and Impulse & Momentum. Learning outcomes using dynamic visual media is higher compared to classes that use static visual media (Figure 1). Learning outcomes using dynamic visual media obtain high category, while those using visual static media obtain medium category.
4
1234567890
International Conference on Science and Applied Science 2017 IOP Publishing IOP Conf. Series: Journal of Physics: Conf. Series 909 (2017) 012048 doi :10.1088/1742-6596/909/1/012048
The average difference of the learning outcomes in the two group classes is related to the learning process of the two group classes. The teaching methods, which are applied to both groups, are same, what makes it different is in the use of media. The experimental classes use dynamic visuals as a learning media, while the control classes use static visual media. Dynamic visual media as well as static visual media displays the same visualization phenomena, what distinguishes it is only the one moves to describe the actual phenomenon, while the other is a still image. The results showed that the results of physics learning assisted by dynamic visual media are better than using static visual media. This finding is in line with the findings [9], which is the same instructional design methods are effective across different media. The learning results of the classroom that use dynamic visual media are higher because it has the advantages such as it is more realistic in describing a physics event and it can describe the process.
The dynamic visualization of the circular motion in this study is using two-wheeled motion animation linked by chain, centre, and tangent (Figure 2). In this visualization, the rotation of each wheel and the number of turns on each wheel can be observed. In investigating the relationship between period and frequency by using dynamic visuals, it can be seen the time required to spin and the number of rounds that occurred. The use of video and circular motion animation of the gear system of bicycle wheel can show the number of rotations of each wheel, the direction of wheel rotation and the influence of the difference of the radius. The video and animation allow the students to determine the angular velocity, as well as the magnitude and the direction of the linear velocity of the wheels and to predict the effect of radius on the number of wheel rotation (Figure 3). The students who received learning by using dynamic visual media which is 63% can answer the questions about the magnitude and the direction of linear velocity and angular velocity on two tangent wheels, while in the static visual class only 38% can answer correctly.
Figure 2. Wheel system connected by chain (a), Centre (b), and Tangent (c)
Figure 3. An example of a student's answer to the dynamic visual class of the wheel system
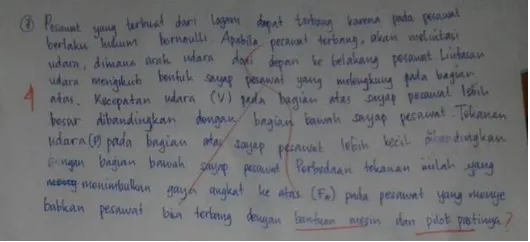
An example of dynamic visualization in learning dynamic fluid matter is the fluid flow on the aircraft wing (Figure 4). By dynamic visualization, it can be described that the streamline flow of the fluid is above and below the wing of the aircraft. Therefore, it can be clearly seen that the fluid that moves above the wing of the plane is faster than the one move under the wings, so that students
1234567890
International Conference on Science and Applied Science 2017 IOP Publishing IOP Conf. Series: Journal of Physics: Conf. Series 909 (2017) 012048 doi :10.1088/1742-6596/909/1/012048
understand better why the air pressure under the wing is higher compared to the pressure above the wing (Figure 5).
Figure 4. Wings form when take-off (a), fluid flow (b), and air pressure difference (c)
Figure 5. An example of student’ answer in the dynamic visual class related to a plane can fly
An example of dynamic visualization in impulse and momentum learning is a video depicting a small car with high speed crashing into a heavy box car but moving at the low speed (Figure 6). This video is followed up by discussing the damage level of the car if the car's speed is lower and the car hit is lighter. Thus the students in dynamic visual media class can explain the greater damage effect of a colliding vehicle based on the principle of momentum (Figure 7). The students in the dynamic visual class obtained an average score of 73.4 for this problem, whereas in the static visual class obtained an average score of 68.5.
Dynamic visual media is appropriately used to describe material related to movement. This is supported by the results of the study [10] in principle, an animation is created to convey concepts of change and considered effective in expressing processes. Animated graphics seemed superior to static ones, scrutiny of the actual stimuli revealed that the animated graphics conveyed more information, especially about the micro steps between larger steps [12]. Dynamic visualizations can use animated pictures to provide an explicit depiction of abstract concepts and processes [13].
6
1234567890
International Conference on Science and Applied Science 2017 IOP Publishing IOP Conf. Series: Journal of Physics: Conf. Series 909 (2017) 012048 doi :10.1088/1742-6596/909/1/012048
The use of dynamic visual in learning can improve the students’ learning outcomes. This is in line with the statement [14] “…with the animation video as a source of learning will facilitate students in the learning process, especially in realizing the concept of material which is abstract.” It is also in accordance with the research conducted by [15] that the use of animation media as dynamic visual media can improve the learning outcomes. The learning outcomes which are using dynamic visuals are higher than static visuals also supported by [16] that the students who learn by using dynamic visuals have higher cognitive learning outcomes than the students who learn by using static visuals.
Dynamic visual as a media in learning activities gives the opportunity to the students to observe events/phenomena which looked more realistic because of the motion of the picture. By using dynamic visuals, the students can analyze, prove and conclude by themselves about an event related to the material. In addition, by dynamic visuals, the delivery of information about the subject matter to the students is easier, and the movement of the images provides clear information.
Static visuals are less able to display a dynamic event picture, achieving a coherent understanding is difficult for students using curriculum featuring static pictures in the textbook as these pictures do not convey the dynamic interactions [4]. However, dynamic visual media also has a disadvantage which is it cannot be observed longer because the images are moving and changing rapidly. The experience in this study shows that learning to analyze the direction of centripetal acceleration is more appropriate to use static visual. Visual static is easier to use to indicate the direction of centripetal acceleration that always goes to the same point that is the center of the circle. Thus, the students are more easily understand where the direction of centripetal acceleration of objects at a certain point. The achievement of these indicators, influencing the learning outcomes to reach the indicator calculates the magnitude of centripetal acceleration. The explanation of the direction of centripetal acceleration is an explanation of a concept that is static, so it is better to be explained using static visuals.
A review of research on the design of multimedia explanations conducted in lab at Santa Barbara shows (a) a multimedia effect-in which students learn more from words and based on their own words in both book-based and computer-based environments, (b) a coherence effect-in which students learn more deeply when extraneous material is excluded rather than included in both book-based and computer-based environments, (c) a spatial contiguity effect-in which students learn more deeply when printed words Are in the book-based and computer-based environments, and (d) a personalization effect-in which students learn more deeply when words are presented in conversational rather than formal style-both in computer- Based environments containing spoken words and those using printed words [9].
Differences in scores are obtained larger in classes with dynamic visual than static visuals, because of the advantages of dynamic visual, according to the existing theories, describes a process in a coherent manner, encourage and increase motivation, develop imagination, improve memory, facilitate in understanding the concepts, and give the more realistic picture. If the static visual, the advantages are having a variety of types can be real visual (photography), charts, animation, graphics and so forth. However, static visuals only show the visuals without showing the process coherently so that it gives less understanding of the concept to the students. This causes the use of static visuals gets a lower score compared to the use of dynamic visuals.
4. Conclusion
1234567890
International Conference on Science and Applied Science 2017 IOP Publishing IOP Conf. Series: Journal of Physics: Conf. Series 909 (2017) 012048 doi :10.1088/1742-6596/909/1/012048
5. Acknowledgment
Thanks delivered to Dr. Abdurrahman, M.Si, Drs. Eko Suyanto, M.Pd., Drs. Feriansyah Sesunan, M.Pd. Ismu Wahyudi, S.Pd., M.Pfis. who have provided input on this research.
References
[1] Larkin J, McDermott J, Simon D P, and Simon H A 1980 Expert and novice performance in solving physics problems Science208(4450) 1335-1342
[2] Lohse G L, Biolsi K, Walker N, and Rueter H H 1994 A classification of visual representations
Communications of the ACM37(12) 36-50
[3] Cook M P 2006 Visual representations in science education: The influence of prior knowledge and cognitive load theory on instructional design principles Science education 90(6) 1073-1091
[4] Chiu J L and Linn M C 2014 Supporting Knowledge Integration In Chemistry With A Visualization-Enhanced Inquiry Unit Journal Of Science Education And Technology 23 (1)
37-58
[5] Whitworth B A and Chiu J L 2013 Pre-Service Teachers Use of Visualizations in the Science Classroom A Case Study Virginia Journal of Science Education5 (1) 16-32
[6] Marr D, Lal S, and Barlow H B 1980 Visual Information Processing: The Structure and Creation of Visual Representations [and Discussion]. Philosophical Transactions of the Royal Society of London Biological Sciences290(1038) 199-218
[7] Vavra K L, Vera J W, Karen L, Linda M P, Stephen P N, and John M 2011 Visualization in Science Education ASEJ41 (1) 22-30
[8] Hake R 1998 Interactive-Engagement Versus Traditional Methods: A Six-Thousand-Student Survey of Mechanics Test Data for Introductory Physics Courses. American Journal of Physics 66(1) 64-74
[9] Mayer R E 2003 The promise of multimedia learning: using the same instructional design methods across different media. Learning and instruction13(2) pp 125-139
[10] Manalu K 2013 Gambar Diam Versus Animasi: Visualisasi Dalam Pembelajaran Biologi Jurnal Al-Irsyad3 46-51
[11] Lin C 2009 Learning Action Verbs With Animation The Jalt Call Journal5 (3) 23-40
[12] Morrison J B, Tversky B, and Betrancourt M 2000 March. Animation: Does it facilitate learning
In AAAI spring symposium on smart graphics pp 53-59
[13]
Ryoo K & Linn M C 2014 Designing Guidance For Interpreting Dynamic Visualizations: Generating Versus Reading Explanations Journal of Research in Science Teaching51(2)147-174
[14] Ismawati D A, Danang T 2016 Pengembangan Media Video Animasi Untuk Meningkatkan Hasil Belajar Siswa Dalam Pelajaran Matematika Sub Pokok Bahasan Hubungan Antar Sudut Kelas VII SMP Negeri 1 Krembung Sidoarjo Jurnal Mahasiswa Teknologi Pendidikan10 (1)
[15] Sari, N W dan Samawi A 2014 Pengaruh Penggunaan Media Animasi Terhadap Hasil Belajar IPA Siswa Slow Learner. Jurnal Penelitian dan Pengembangan Pendidikan Luar Biasa1(2)
140-144