CLASSIFICATION TREES: ALTERNATIVE
SOLUTION TO CLASSIFICATION METHODS
OF LINEAR DISCRIMINANT ANALYSIS
Prana Ugiana Gio, Elly Rosmaini Siregar, and Faigiziduhu Buulolo
Abstract.Linear discriminant analysis (LDA) is a part of classification methods
that has been widely used in various applied fields. Linear discriminant analysis can be used to predict an object fit into one of the categories in the dependent variable based on information from the independent variables. However, there are some assumptions in the use of linear discriminant analysis which, if not met can decrease the performance of linear discriminant analysis methods. Classification trees is a nonparametric classification methods that can be used as an alternative methods of linear discriminant analysis. This paper is intended as an introductory article that gives brief overview about the classification trees which these materials might be found on a variety of reading materials in deeper discussion. Two data sets are given as illustration to show their performance in classification.
1. INTRODUCTION
Linear discriminant analysis (LDA) is one of statistical technique that can be used to predict an object enter into one of group of dependent variable. In the use of LDA, independent variables are metrics, while dependent variable is nonmetric (nominal or ordinal). LDA can be used to predict whether a person will get diabetes or no, based on the rate of sugar consumption and
Received 17-02-2016, Accepted 25-03-2016.
2010 Mathematics Subject Classification: 62H30
Key words and Phrases: Classification, Data mining, Discriminant analysis.
the rate of activity in a day, whether a person will get heart attack or no, based on blood pressure, weight, and the rate of cholesterol, whether a person will be attracted to a certain product or no, based on price and size of product, etc [1].
There are several assumptions in the use of LDA, namely multivariate normality and equality covariance matrices, so that LDA is a parametric technique. The use of LDA will generate a discriminant function, which is a linear function [2]. The discriminant function will produce discriminant Z scores by substituting the value of independent variables for each object to discriminant function. The average of discriminant Z scores for each group is called centroid. If there are k group of dependent variable, so there are k centroid in the discriminant function. These centroids can be compared each other to know how far the difference among these groups. A position of object which is close with a particular centroid group will be predicted enter into this group [3].
Let {x1, x2, , xL} where xi ∈ Rn be a set of binary labeled training
vectors, with n1 samples in class 1 denoted C1 and n2 samples in class 2
denotedC2. The class separability function in a directionw∈Rn is defined
as follows [4, 5].
Where SB and SW are the between-class and within-class scatter matrices
respectively, as follows [4, 5].
SB= (m1−m2)(m1−m2)TSW =
The sample mean of the respective classes, mi is defined as:
mi=
1
ni
X
x∈Cix
The Fisher linear discriminant is given by the vector w ∈ Rn that maximizes the class separability function J(w). It can be observed that expression (1) is a particular case of the generalized Rayleigh quotient, and thus, and assuming that SW is a non-singular matrix, it is possible to find
an analytical expression for wwhich maximizeJ(w) as follows [4, 5].
w=S−1
W (m1−m2)
Differ with LDA which is a parametric classification methods, classifi-cation trees is a nonparametric classificlassifi-cation methods that can be used as an alternative LDA. Classification trees is one of the popular classification technique that can be used to predict an object enter into one of group of de-pendent variable. The flexibility and understandability are the advantages of using classification tree. The use of classification tree will produce a tree that can be used to predict an object enter into one of group of dependent variable, based on information of independent variables [6].
This paper intend to compare accuracy of prediction between LDA and classification tree in two various of data using R software. A good clas-sification prediction procedure should result in few misclasclas-sification.
2. CLASSIFICATION WITH LDA AND CLASSIFICATION TREES
2.1 Classification Using Data 1
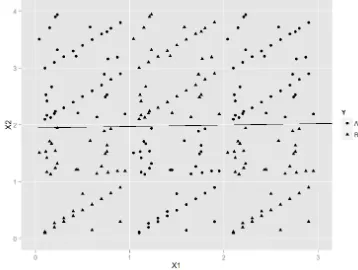
In data 1 consist three variables, namely Y, X1, and X2. The variable Y is dependent (nonmetric) variable, while X1 and X2 are independent (metric) variables. Figure 1 show distribution of spread for data 1. In general the triangle points (B group) are positioned above, whereas the circle points (A group) are positioned below. First, LDA will be used for data 1. The use of LDA will generate a discriminant function, which is a linear function. This function can be used to classify each object. The following code is R code to perform LDA.
library(MASS) #Load package ’MASS’ fit.LDA = lda( Y ˜X1 + X2, data)
fit.LDA
#Plot line of discriminant function
ggplot(data, aes(X1, X2)) + geom point(aes(shape = Y)) + geom abline(intercept =-0.536419, slope =0.913205698 ) + scale y continuous(limits=c(0, 2.3)) + scale x continuous(limits=c(0.95,
2.5)) + geom text(data = NULL, x = 1.7, y = 2, label = ”Linear classification line is made based on”, colour=”black”) + geom text(data =
NULL, x = 1.7, y = 1.9, label = ”coefficients of linear discriminants”, colour=”black”)
table(data[,1],class.LDA.C) #Perform classification
Figure 1: Distribution of Spread for Data 1
Figure 2: Linear Classification Line Based on LDA
Figure 3: Classification Based on LDA
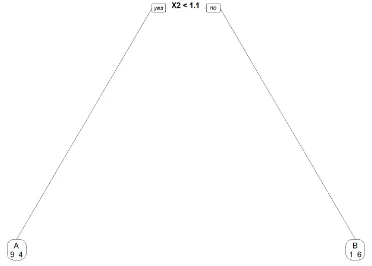
classification tree. The following code is R code to perform classification tree.
#Perform classification trees library(rpart)
tree ¡- rpart(Y ˜X1 + X2, data) library(rpart.plot)
prp(tree, faclen = 0, cex = 0.8, extra = 1) #Prediction
treePrediction ¡- predict(tree, data, type = ”class”) treePrediction
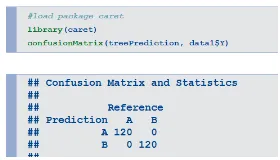
#load package caret library(caret)
confusionMatrix(treePrediction, data$Y)
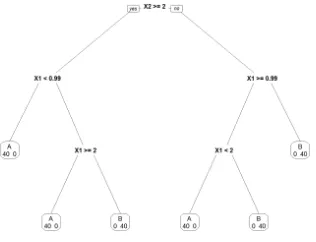
Figure 4: Tree Decision Based on Classification Tree
Figure 5: Classification Based on Classification Tree
2.2 Classification Using Data 2
Figure 6: Distribution of Spread for Data 2
Figure 7: Linear Classification Line Based on LDA
The obviously summary for classification can be seen in Figure 8. Based on Figure 8, there are 80 misclassifications, 40 objects from A group, and 40 object from B group.
Figure 8: Classification Based on LDA
Figure 9: Tree Decision Based on Classification Tree
3. CONCLUSION
For the pattern of the spread of data 2, LDA is less accurate in pre-diction of classification. This is because LDA will generate a discriminant function which is a linear classification line. This linear classification line only can divide into two classification areas. The areas which is above the line will predict an object enter into A group. In this area, there are 40 mis-classifications. Furthermore, the area which is below the line will predict an object enter into B group. In this area, there are 40 misclassifications. Meanwhile, the use of classification tree for data 2 give the excellent result in prediction of classification, namely there is no misclassification. So, when the data spread approach like data 2, classification tree can be alternative to LDA.
REFERENCES
1. Kantardzic, M. 2011. Data Mining, Concepts, Models, Methods, and Al-gorithms, 2nd Edition, John Wiley & Sons, Inc.
Figure 10: Classification Based on Classification Tree
3. Hair, J. F., Black, W. C., Babin, B. J., and Anderson, R. E. 2010. Mul-tivariate Data Analysis, 7th Edition, Pearson Prentice Hall.
4. Alexandre, E., Manuel, R., Lucas, C., and Roberto, G. P. 2006. Applica-tion of Fisher Linear Discriminant Analysis to Speech/Music Classifica-tion, in AES 120th ConvenClassifica-tion, Paris, France.
5. Li, M., and Baozong, Y. 2004. 2D-LDA: A Statistical Linear Discriminant Analysis for Image Matrix, Pattern Recognition 26 (2005), 527:532.
6. Gorunescu, F. 2011. Data Mining, Concepts, Models, and Techniques, Springer.
Prana Ugiana Gio: Magister Student, Department of Mathematics, Faculty of
Mathematics and Natural Sciences University Sumatera Utara, Indonesia.
E-mail: [email protected]
Elly Rosmaini Siregar: Department of Mathematics, Faculty of Mathematics and
Natural Sciences University Sumatera Utara.
E-mail: [email protected]
Faigiziduhu Buulolo: Department of Mathematics, Faculty of Mathematics and
Natural Sciences University Sumatera Utara.