DOI 10.1007/s10640-009-9308-2
Charges in the Industrial Water Sector: Comparison
Between Ireland and Spain
Concepción Rey Mejías· Helena Lenihan ·
Bernadette O’Regan
Accepted: 6 July 2009 / Published online: 23 July 2009 © Springer Science+Business Media B.V. 2009
Abstract The European Treaty supports the application of the polluter pays principle in
all environmental policies including the Water Framework Directive. This paper assesses the efficiency of water-charging systems in two European regions. The regions examined are the South west region of Ireland and the Navarre region in Spain which were selected because they are similar in terms of economic indicators but different in terms of water pricing struc-tures. The paper describes the development and application of a simple model to analyse data on water-charging systems from these two regions. We present the results of a detailed scenario-based investigation illustrating the differences between experience, composition and basis, impact and constraints on the application of water charges for both regions. The key findings are that existing water charges do not provide incentives for users to use water efficiently and thereby do not contribute effectively to the environmental objectives of the Water Framework Directive.
Keywords Externalities·Industrial charges·Water charges·Water Framework Directive·
Water pricing policy
C. Rey Mejías (
B
)Maritime and Coastal Affairs Unit, Directorate for Fisheries and Maritime Affairs, TRAGSATEC (TRAGSA Group), C/ Julián Camarillo 6 b, 28037 Madrid, Spain e-mail: [email protected]
H. Lenihan
Department of Economics, Kemmy Business School, University of Limerick, Limerick, Ireland e-mail: [email protected]
B. O’Regan
Centre for Environmental Research, Department of Chemical and Environmental Sciences, University of Limerick, Limerick, Ireland
Abbreviations
EEA European Environment Agency
WFD Water Framework Directive
1 Introduction
Water is essential for human life, as well as being strategic for the economic development of regions. Management of quantity and quality of water is essential to protect and improve aquatic ecosystems. Nevertheless water resources are used excessively. In 2002, 18% of Europe’s population lived in countries that are water stressed (European Environment Agency
(EEA)2003). Although wastewater treatment in all parts of Europe has improved
signifi-cantly over the last two decades, the percentage of the population connected to waste water treatment is still quite low (EEA 2003). Pesticide and metal contamination of drinking water
supplies has been identified as a problem in many European countries (EEA 2003). Large
areas of coastline are affected by saltwater intrusion, ecosystems of rivers are endangered and the infrastructure required for water supply and treatment impacts areas away from the
watercourses (EEA 2003). In some countries, loss of water by leakage from water
distri-bution is in excess of 40% of the supply (EEA 2003). Incentives for more efficient water
consumption are consequently needed.
The European Treaty establishes the application of the polluter pays principle in all envi-ronmental policies across Member States (Art. 174. 2). According to the Treaty, under the Directive 2000/60/CE establishing a framework for Community action in the field of water policy (the Water Framework Directive), all Member States are committed to ensuring that their water-pricing policies provide effective incentives for water consumers to use water resources efficiently, and is so doing to contribute to the environmental objectives of the Directive. The Water Framework Directive (WFD) also aims to ensure an adequate contri-bution by the different water consumers to the recuperation of the costs of water services (taking account of the polluter pays principle (Art. 9 WFD)). Water pricing is an appropriate economic instrument to help solve this problem, and this can take the form of tariffs, charges and taxes (Ekins 1999).
Public intervention is necessary due to the existence of external costs (scarcity costs, economic and environmental externalities) associated with water use.
Europe has a common environmental objective of achieving good water status, but the ad hoc application of water tariffs and charges, with many water services subsidised by gov-ernments, gives no incentive to rational use and makes improvement difficult and costly, especially now in the current climate of fiscal rectitude.
The WFD therefore requires the application of full cost recovery and the polluter pays principle and, recognising that water stress, assimilative capacity and damage costs are spe-cific to water catchments, it requires that these charging principles should be applied at the river basin district level.
usage1(it does not investigate other consumers such as agriculture or households). Industrial water charges have important fiscal and financial roles (i.e. as receipts for the central budget or for supporting water related investments). Despite the fact that the model developed in this paper is applied within the Spanish and Irish contexts (this analysis is insightful as it demonstrates the case of two extreme situations), this approach could also be extended to other member States, thus implying that the model used is highly transferable.
The current paper aims to highlight the use of fiscal tools with regard to water-pricing pol-icies. Water charges are considered as instruments to stimulate consumption and responsible use of water, and therefore to reduce the environmental impact of industrial water usage.2 However, sometimes such a ‘pricing’ approach is met by public opposition. In an attempt to offset this problem, welfare compensation policies are sometimes applied (e.g. welfare compensation policy to the less well-off in the case of Belgium).
The paper is structured as follows: Sect.2presents a summary of the theory of public goods and externalities associated with water consumption and consequent environmental impacts. Section3provides the profile of two regions selected for analysis in this paper. These regions are similar in terms of economic indicators, but different in terms of water pricing structures for industrial consumers; their water charging spectrum and the relative availability of water. Section4reports on and discusses the results of a detailed scenario-based investigation illus-trating the differences between experience, composition and basis, impact and constraints on the application of water charges for the two regions under investigation. Conclusions are presented in Sect.5.
2 Externalities: The Case of Water Usage and Environmental Costs
Water consumption has some characteristics in common with both private and public goods. This is one of the main reasons why (coupled with water being essential for human life), current water pricing policies do not incorporate all the costs associated with water usage. As a result, the industrial water sector does not have complete information with regard to water value; this often results in wasteful consumption and consequently water becoming a scarce resource. It is essential to accurately estimate the value of water, accounting for all factors, regardless of whether or not they are included in the market price. The overriding outcome is that markets often fail to protect water due to the presence of externalities.
Water is considered anon-market resource,in instances where it comes directly from
nature (under the supposition that a firm’s water abstraction does not reduce the ability of other firms to abstract water) or goes directly back to water courses (potential polluters cannot
be costlessly excluded from their actions). Water can also be viewed as amarket resource
in instances where water comes from water suppliers or goes to sewerage treatment plants. Finally, there is a value or cost of water provision or consumption which can be measured in monetary terms.
Water consumption may generate either positive or negative effects. Water abstraction or disposal into watercourses must be at the expense of some other users’ allocation. What dis-tinguishes these situations from pure public goods is that competition exists between water consumers which gives rise to externalities (Oakland 1987).
1 Industrial water usage in this paper refers solely to the manufacturing industry.
2 As an alternative, a system of tradable permits could also be considered. Our focus however is in water
Scott and Lawlor(1994) note that easy water accessibility can attract industrial activity to a region. They proceed to argue that, allowing discharges with an inadequate pricing sys-tem will make a region ever more attractive to other industries which produce high volumes of wastewater. Water pollution however, forces downstream users to treat water and there-fore suffer extra costs to maintain water quality standards. Economic theories demonstrate that under-pricing reduces efforts to rationalise water consumption, as well as discouraging technological development in this field (Azqueta 1993). The externalities associated with water consumption intensify problems associated with scarceness, deterioration of water quality and risk of losing aquatic ecosystems. The market alone cannot deal with externali-ties due to the fact that in the face of such externaliexternali-ties there is a divergence between private and social costs.
Economic theories demonstrate how the behaviour of individuals can be targeted through
the use of price as an effective means of signalling (Bös 1985;Rosen 2001). Taxing the
polluter, providing some kind of financial motivation to invest in appropriate technology, pollution permits and an allocation of property rights are possible methods of intervention. By incorporating the environmental and social costs of services into the price of water, the aim is to provide as much relevant information as possible for decision-makers.
The main challenge with regard to incorporating water costs in a pricing system is the difficulty of quantifying externalities due mainly to a lack of information. The use of envi-ronmental economic tools in the valuation of natural resources is becoming more prevalent
in the evaluations being conducted by policy makers (Azqueta 2002). The main aim of such
an intervention is to make the market operate more efficiently, and to mirror in so far as is possible the counterfactual scenario (i.e. the situation in the absence of externalities) (Turner et al. 1994). Furthermore, the public sector must consider this in the design of policies, taking into account not only the limitations of these valuations, but also recognising their potential.
2.1 The Water Framework Directive
The WFD established a framework for EU community action in the area of water policy. The Directive explains the main aims of the hydrological strategy for the Community. Further-more, it determines that water-pricing policies must provide adequate incentives for users to utilise water resources efficiently and thereby contribute to the environmental objectives of this Directive by 2010. In order to achieve this, each Member State should ensure the establishment of a programme of measures, including both economic and fiscal instruments, in order to guarantee cost-covering charges. Each country may choose the use of economic or fiscal instruments as a supplementary measure in order to achieve the objectives of the WFD.
3 The Case of Two European Regions
This section evaluates the situation (in 2006) regarding water charges in two European regions. The analysis which follows is insightful given that although both regions share common economic characteristics, each possesses its own particular taxation regime.
0% 5% 10% 15% 20% 25% 30% 35%
Food Industries Textiles, clothing, footwear and leather Paper, paper products, printing and publishing Chemical, rubber and plastic products Glass, pottery and cement Metals, metal products, machinery and engineering Transport, Storage and communications Wood and wood porducts Electricity, gas and water supply
Navarre South West region
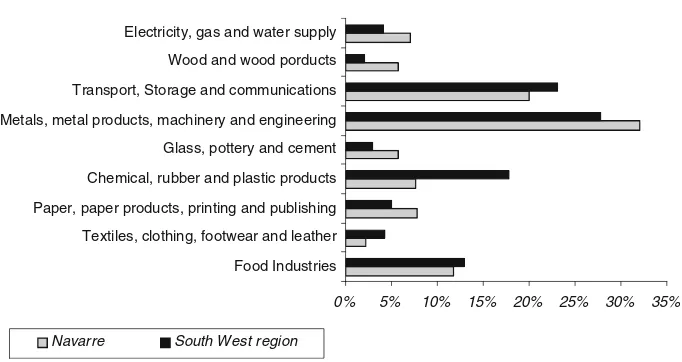
Fig. 1 Employment in manufacturing industries in the South West region of Ireland and Navarre in Spain in 2002
However, there is a lack of transparency with regard to how local authorities set water charges to industry and it is currently not possible to determine if the water charges are fully cost-reflective. To calculate accurate cost-reflective charges and thereby arrive at a situation where local authorities can determine whether or not water cleaning technology may be more effi-ciently located at individual industrial premises, it will be necessary to introduce greater consistency with regard to how the charges for water and waste water services are calculated by local authorities.
Under the current circumstances, in both Ireland and Spain, there are no clear incentives to locate cleaning technologies at individual industrial premises. This would most effectively happen if both governments implemented the Mogden system of water charging for indus-trial effluent. Such a formula seeks to link charges for discharging indusindus-trial effluent to the public sewer with the costs imposed on the industrial sector; this means that water consumers should pay according to the volume and strength of the effluent they discharge. This is used by most water authorities in the UK, and some sectors in Northern Ireland. However, due to the complexity of such a system, despite the fact that it is in line with the EU polluter pays principle, this system is not yet used for all industrial sectors in Ireland or Spain.
Water prices for industrial consumers in Ireland (South West region) and Spain (Navarre) are the focus of discussion in the sections that follow.
3.1 The South West Region of Ireland
The South West region of Ireland comprises an area of 12,161 sq. km. It encompasses Cork City, County Cork and County Kerry. This region has a population of 580,356 inhabitants (Census 2002) that live across a range of diverse areas, ranging from urban settings to small rural towns. There is an average of 48 inhabitants per sq. km. The South West region recorded a Gross Domestic Product ofe38,557 per person in 2002 (Eurostat 2005). The total number
of persons in employment was 236,295 (Eurostat 2005); 8.9% were employed in the
3.2 Navarre (Spain)
Navarre comprises an area of 10,391 sq. km. The community is governed as an autonomous
region, with its own parliament (Parlamento de Navarra) and government (Gobierno de
Navarra). The area encompasses 272 municipalities, with a population of 569,628 inhabit-ants and almost 55 inhabitinhabit-ants per sq. km (Census 2002). In 2002, Navarre recorded a Gross
Domestic Product ofe21,083 per person (Eurostat 2005). There were 244,612 persons in
employment in Navarre (Eurostat 2005): 6.5% in agriculture, 36.7% in the industrial sector
and 56.8% in services (INE 2005). The employment in manufacturing industries by 2002
(INE 2005) is outlined in Fig.1.
The industrial sector can react to separate signals on water pricing depending on the available options to access this resource. There is a difference between the price of water as anon-marketed resource(industrial water consumers set their own price by assuming the costs of direct abstraction and discharge) and the price of water asa market resource (indus-trial water consumers take the price which is established by water suppliers and sewerage treatment plants). The preference of industrial consumers depends on different factors such as having a connection to a public water supply or sewerage system, the quality of water required, or the levies charged on water abstraction and wastewater disposal. For this reason, the scenarios analysed in this paper take account not only of water prices from the public water supply and sewerage systems, but also from direct abstraction and discharge to water bodies (river, stream, lake, estuary and groundwater).
3.3 Water as a Non-Marketed Resource
Direct abstraction and discharge charges for industrial water consumers are utilized as proxies to compare the cost of self-supplied water between these two regions.3
3.3.1 Water Abstraction
A situation can arise whereby the amount of water accessible is limited, and free abstraction by some consumers could reduce the availability of water for others (i.e. power production typically abstracts a significant amount of water which affects recreational uses and prof-itable activities). Water abstraction may take place if it is authorised because unregulated abstraction could cause severe externalities to other consumers. Direct abstractions appear to be more advantageous than public supplies for the majority of industrial consumers.
Ireland
Abstraction charges for industrial water consumption are currently in place in Spain but not in Ireland. In the South West region of Ireland the industrial water abstraction in 2002 was close to 112 cubic hectometres (EPA 2004); however, the resultant revenue was in fact zero. Under the Irish Government’s new water service pricing policy, all local authorities are required to recover capital and operational costs in respect of the provision of water and wastewater services to the industrial sector.
3 The data about costs of direct abstraction varies broadly from one industry to another and statistics are not
Spain
The Spanish Water Act has determined national abstraction charges to discourage
over-exploitation of water resources (canon de utilización de los bienes del dominio público
hidráulico), this charge is applied in Navarre. The charge due is calculated in various ways depending on the situation. For example, if public lands are occupied by industrial premises then the value of the water charge depends on the market value of the territory occupied. The charge due for water usage is calculated with reference to the private benefit obtained and is based on information declared by users in advance (i.e. navigation, mining, etc). In the case of using water as an input in the production process the charge depends on the value of this input or the utility obtained from it (i.e. power production). This situation aims to provide an incentive for the rational consumption of water resources while establishing rights to access water. The revenues obtained from these charges are utilized for the financing of river basin management. Nevertheless, it is observed that the revenues obtained are so low that it is not possible to create any real incentives. In Navarre the industrial water abstraction in 2002 was close to 233 cubic hectometres (INE 2005); however, the revenue obtained due to these water abstractions was almoste310,417 (INE 2005). The design of these charges does not appear to respond to environmental criteria.
3.3.2 Wastewater Disposal
Wastewater disposal implies a private use of water as a waste receptor when authorisation is required. Disposal controls are imposed on direct discharges, either those that do not go through the public sewer, or those that come from the public sewerage system following treatment. The most common form of discharge control is related to permit procedures: in order to discharge directly into water bodies, industrial users usually need authorization.
Ireland
In the case of industry, charges are imposed in Ireland in a licensing process (trade effluent licences). Wastewater discharges to water bodies can only take place if they are licensed (Local Government Water Pollution Acts 1977–1990). It is the legal responsibility of the discharger to apply for a licence and a prescribed fee must be paid (this fee does not vary according to the amount of effluent that each industry produces). In the case of a discharge to watercourses, a notice must first be published in the newspapers as part of a public consul-tation process. The City and County Councils are the licensing authorities, and charges for non-compliance/illegal discharges can be pursued via the courts in the form of fines and/or liability for repaying the Local Authority for damages caused.
Spain
The Spanish Water Act has determined a specific national levy on wastewater disposal (canon de control de vertidos) for authorized discharges. The revenues obtained are aimed at the study, control, protection and improvement of waters. These charges are levied by the River Basin Agencies. They are calculated on the basis of a volume of discharge multiplied by a fixed coefficient, and then modified by different factors as follows:
1. A source factor is applied (depending on whether it is urban wastewater or industrial
2. A pollution load defined by industry type is then applied (defined as Class 1, 2 or 3).
3. The technology used by the industry is identified and a relevant factor applied (i.e.
whether best available techniques and pollution abatement measures are used).
4. A geographical zone factor is applied depending on the environmental characteristics
of the receptor waters (defined as Zone I, II or III).
Although the design of this charge attempts to link potential pollution capacity with incentive criteria, it does not consider the real cost of public water supply and treatment.
3.4 Price of Water as a Market Resource
The pricing system can follow many different forms. The simplest way to implement water pricing is that of a uniform price per unit of quantity. An indirect system can be applied when the quantity is unknown, for example, charges could be estimated with proxies such as surfaces of premises, property value, category of industry, number of water points, final use of the water (i.e. industrial, domestic, agricultural).
Water tariffs usually engage in some form of price discrimination. However, uncertainty and administration costs prevent such firms from engaging in first degree (perfect) price discrimination for example, whereby industrial consumers are charged different prices based on their willingness to pay (i.e. for each moment in time, the price of the resource varies for each consumer on a unit by unit basis). However, some standardised forms of price dis-crimination can be found everywhere in water pricing. The most common are two-part tariffs (including a fixed element, which generally varies according to some characteristic of the user, and a variable element, which is usually based on average cost-pricing) and block tariffs (decreasing and increasing block tariffs).
3.4.1 Water Supply from Public Services
Water prices presented here remunerate the resource, treatment, and supply costs of water service suppliers to industrial consumers.
Ireland
In Ireland, most water supply services are provided by local authorities, with some public drinking water supply networks being run by small rural communities. The estimated water supplied for industry in the South West region of Ireland by these public supply networks
was 12.4 cubic hectometres in 2002 (EPA 2004), the approximate cost of supplying water
wase25,270,662 in 2002 (EPA 2004); finally, the revenue obtained directly from charges
to industry wase13,813,088 in 2002 (EPA 2004). In some cases, particularly in rural areas, these services are provided by local community initiatives, assisted by government grants. The funding for maintaining and improving the water supply infrastructure (pipes, filtration and disinfections systems) comes jointly from the State and EU structural funds.
Under the Irish Government’s new water service pricing policy, all local authorities are required to recover not only operational costs but also capital contributions in respect of the provision of water and wastewater services to the industrial sector. This has resulted in a change in pricing policy, which came into effect in 2005, and a metering system for non-domestic use is currently under implementation. Revenue obtained through the supply of water will be reinvested in the cost of the service (i.e. the cost of producing and supplying clean water). Consumers of water for industrial purposes will be metered and charged on the basis of each cubic metre used plus a fixed rate to cover administrative costs.
In the case of the South West region of Ireland for example, currently Cork County Coun-cil does not charge separately for the meter and related work. The cost of the meter, pipes, installation work and labour are incorporated into the overall budget and customer bills. Although beyond the focus of the current paper, this is clearly an issue that merits further investigation. The estimated cost recovery from charges in the South West region of Ireland was close to 54% in 2002.4
Spain
In Spain, water is generally supplied on a commercial basis by water supply companies, although some of these are under municipal ownership. Various municipalities are also grouped into public entities called “Mancomunidades de Aguas”. By law, prices charged for water supply services are initially set by the relevant administration in charge, and are then presented to the Price Commission of the regional government for approval. The esti-mated water supplied for industry in Navarre by these public supply networks was close to
5.3 cubic hectometres in 2002 (INE 2005), the approximate cost of supplying water was
e14,181,117 in 2002 (INE 2005); finally, the revenue obtained from charges to industry was e2,760,094 in 2002 (INE 2005).
There is a significant difference in tariffs charged by water supply companies, which are characterised by their dispersion, and often depend on their own circumstances. Although this is not an environmental burden, it informs final users about service costs and gives cor-rect signals to stimulate rational water use. The main target of these charges is cost covering. While they are not related to the full economic cost of water provision they provide an obsta-cle to obtain a financial balance. A obsta-clear correlation tends to exist between the real costs of water supply and tariff design. The estimated cost recovery from industrial charges in
Navarre was close to 20% in 2002.5
3.4.2 Sewerage Services
The pricing of wastewater services is generally based on accounting principles, which aim at covering some fraction of the costs of providing these services (e.g. the application of the Mogden system). Connections to sewerage networks are generally available in areas where pipelines are already in place. Sewerage services are not always charged separately from
4 Calculated as follows:
Cost to supplying water to industry in 2002 (EPA 2004):e25,270,662 Revenue obtained directly from industry in 2002 (EPA 2004):e13,813,088 Estimated recovery (revenue/costs):e13,813,088/e25,270,662 = 0.54 (54%).
5 Calculated as follows:
Cost to supplying water to industry in 2002 (INE 2005):e14,181,117 Revenue obtained directly from industry in 2002 (INE 2005):e2,760,094
water supply services. Even where sewerage services are separately identified on the utility bill, they are sometimes simply calculated as a percentage of the water supply charges.
Ireland
In Ireland, the costs incurred by local authorities in treating a discharge to a sewer may be also charged to the discharger. There were 69 sewage treatment plants in Ireland in 2002 (EPA 2004). Charges for sewerage services have traditionally been low and most sewerage rates are currently based on uniform structures (for some users, the charges are charged on either an annual, monthly or quarterly basis, depending on their size). Nevertheless, local authorities usually ask industrial users for capital contributions to new investments in waste-water capacities, in order to improve the financial self-sufficiency of the service. It should be noted that upfront charges for the capital costs of utilities can also be incentives to encourage more efficient behaviour and the question of balance between capital charges and current charges arises.
The implementation of European Directives has caused considerable investment to pro-ceed in accordance with more stringent standards. Revenue raised through the collection/treat-ment of wastewater is reinvested in the cost of the service (i.e. the cost of collecting/treating wastewater). A metering system for industrial users is currently under implementation. How-ever, the volume of wastewater is assumed to be equal to the quantity of clean water supplied to the premises. These charges do not vary according to the pollution potential (load) of the wastewater, thus, this system does not consider consumers′efforts to reduce their environ-mental impacts or the risks caused by their activities. Consequently, this assumption would suggest that the only way to reduce the cost of discharges is by decreasing water consumption, which does not always result in less pollution (the concentration of polluting agents could be greater and have more negative environmental impacts).
Spain
The Spanish Water Act establishes wastewater services as a regional responsibility. The regional government of Navarre has created a public company (Nilsa) to develop these
activ-ities. There were 56 sewage treatment plants in the Navarre region in 2002 (INE 2005).
Navarre levies a tax, and the revenue from this tax is spent on wastewater treatment but not in the form of a specific service to the individual consumer. As effluents are relatively difficult to measure, the taxes are levied on consumption (used as an indication/proxy of the pollution potential of the wastewater). For the industrial sector, a corrector index is usually applied based on specific characteristics of potential polluter intensity: concentration of suspension solids, chemical oxygen demand, biochemical oxygen demand and nitrites in effluents.
4 Analysis of Data
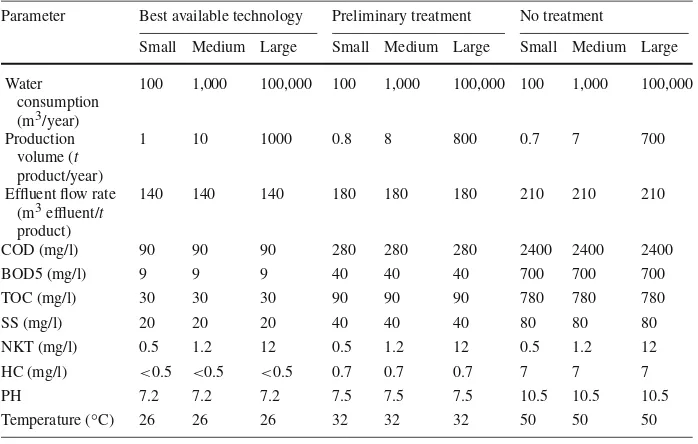
Table 1 Parameters of a hypothetical industrial water consumer
Parameter Best available technology Preliminary treatment No treatment
Small Medium Large Small Medium Large Small Medium Large Water
consumption (m3/year)
100 1,000 100,000 100 1,000 100,000 100 1,000 100,000
Production volume (t
product/year)
1 10 1000 0.8 8 800 0.7 7 700
Effluent flow rate (m3effluent/t
product)
140 140 140 180 180 180 210 210 210
COD (mg/l) 90 90 90 280 280 280 2400 2400 2400
BOD5 (mg/l) 9 9 9 40 40 40 700 700 700
TOC (mg/l) 30 30 30 90 90 90 780 780 780
SS (mg/l) 20 20 20 40 40 40 80 80 80
NKT (mg/l) 0.5 1.2 12 0.5 1.2 12 0.5 1.2 12
HC (mg/l) <0.5 <0.5 <0.5 0.7 0.7 0.7 7 7 7
PH 7.2 7.2 7.2 7.5 7.5 7.5 10.5 10.5 10.5
Temperature (◦C) 26 26 26 32 32 32 50 50 50
Source: Adapted from European Parliament (2001, p. 77, Table 14)
current paper to develop a simple model for comparing industrial water prices. An example is analysed for illustrating the existing water charges in both these regions. Table1shows the indicative example which consists of a hypothetical industrial water consumer (cotton fabric-finishing factory) with different water consumption requirements (small, medium and large) and different technological levels of production and effluent treatment (best available technology, preliminary treatment and no treatment), which could be implemented in diverse locations within each of these regions (capital city, industrial area and a rural area).
This analysis is based on the methodology provided in a study commissioned by the
OECD about industrial water prices in OECD countries (OECD 1999). This analysis is also
complemented with data provided in a study commissioned by the European Parliament about the application of wastewater levied charges for regulating discharges of effluents in the EU 15 member States in a cotton fabric-finishing factory (European Parliament 2001).
This analysis that follows has three aims: the first one is to identify relevant data from locations with extreme water availability conditions (Ireland and Spain), the second is to assess the impacts of environmental charges using different technological levels of produc-tion (i.e. best available technologies, preliminary treatment or no treatment), the third aim is to develop a model to calculate and clearly present the water charges in each region including information on population density and relative industrialisation levels (by taking informa-tion from the capital city, an industrial area, and a rural area). It allows differences between charging systems implemented in the South West region of Ireland and Navarre in Spain (with regard to the different company sizes and water abstraction and treatment technologies and geographic factors) to be taken into account.
should use public sewers or treat wastewater themselves, and discharge back directly into the water system. For this analysis fees, taxes and charges levied on the South West region of Ireland and Navarre in Spain during 2006, are considered.
The average price (per unit of consumption) implied by each bill for each representative customer and charging structure is estimated. The results are presented in the format of four distinct scenarios:
Scenario 1: Direct water abstraction and direct discharge of waste water Scenario 2: Direct water abstraction and connection to sewerage services
Scenario 3: Connection to water supply services and direct discharges to watercourses Scenario 4: Connection to water supply services and sewerage services.
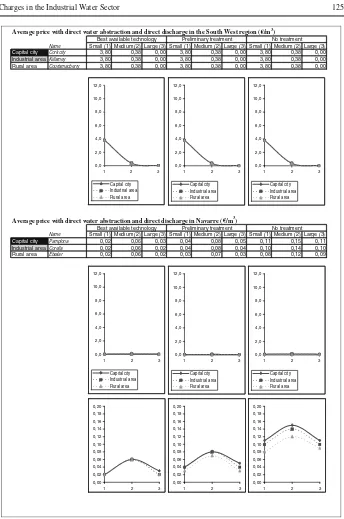
Scenario 1: Direct water abstraction and wastewater discharge
The South West region of Ireland does not currently (2006) charge for direct water abstrac-tion, and wastewater discharges are subject to license. The fee applied for trade effluent
dis-charges wase380 in 2006, and it did not differentiate between the amount of wastewater
discharged into watercourses or different technological standards used by the company. Figure2shows the average price in euros per cubic metre estimated for this hypothetical cotton fabric-finishing factory in the South West region of Ireland under Scenario 1. The charge depends on the size of the company; the average charge tends to be smaller when the dimension of the factory is larger due to economies of scale. There is no incentive to have clean technological levels of production and/or effluent treatment. Finally, the charge does not depend on the location of the factory, in fact, the price is the same in the Capital city, the Industrial area and the Rural area, hence the apparently single line in the graph in Fig.2for the South West region of Ireland.
In Navarre, the charge due for water abstraction is calculated with reference to the private benefit obtained for the company and is based on information declared by users in advance; this will increase with the size of the company. It is levied as 4% of the turnover declared for the company. With respect to wastewater disposal a specific charge as described above (Sect.3.4.2) is applied (canon de control de vertidos). For this example, the volume of dis-charge is multiplied by a variable dis-charge ofe0.03 per cubic metre in 2006, but this coefficient is also modified by:
1. A source factor (this is 1 for industrial water usage),
2. A pollution load factor is (for a cotton fabric-finishing factory this is 1.09),
3. A factor dependent on the technology used by the industry (this could vary from 0.5 if
the best available technologies are being used, to 2.5 if there is no wastewater treatment prior to discharge),
4. A geographical zone factor (i.e. when the receptor waters are in Zone I, this factor is
1.25, in Zone II it is 1.12 and in Zone III it is 1).
Figure2shows the average charge in euros per cubic metre estimated for this hypothetical
cotton fabric-finishing factory in Navarre under Scenario 1. It can be seen that there is a clear incentive to use the clean technologies of production and/or effluent treatment. The higher charges are incurred in the capital city, and the lowest charges are applied in rural areas. A medium size industry is penalized and has the highest charge per cubic metre.
Scenario 2: Direct water abstraction and sewerage services
Name Small (1) Medium (2) Large (3) Small (1) Medium (2) Large (3) Small (1) Medium (2) Large (3)
Capital city Cork city 3,80 0,38 0,00 3,80 0,38 0,00 3,80 0,38 0,00 Industrial areaKillarney 3,80 0,38 0,00 3,80 0,38 0,00 3,80 0,38 0,00 Rural area Courtsmacberry 3,80 0,38 0,00 3,80 0,38 0,00 3,80 0,38 0,00
Name Small (1) Medium (2) Large (3) Small (1) Medium (2) Large (3) Small (1) Medium (2) Large (3)
Capital city Pamplona 0,02 0,06 0,03 0,04 0,08 0,05 0,11 0,15 0,11 Industrial areaCorella 0,02 0,06 0,02 0,04 0,08 0,04 0,10 0,14 0,10 Rural area Etxalar 0,02 0,06 0,02 0,03 0,07 0,03 0,08 0,12 0,09
Best available technology Preliminary treatment No treatment
Averageprice with direct waterabstractionand directdischarge in the SouthWest region ( /m3)
Averageprice with direct waterabstractionand directdischarge in Navarre ( /m3)
Best available technology Preliminary treatment No treatment
0,0
per cubic metre. In some cases, particularly in rural areas, where volumetric systems are not
implemented a flat rate ofe240 is applied. In Kerry County Council, a volumetric scheme
is not applied, the charges incurred depend on the type and size of the industry and whether it is licensed, these charges vary betweene230 ande3,250.
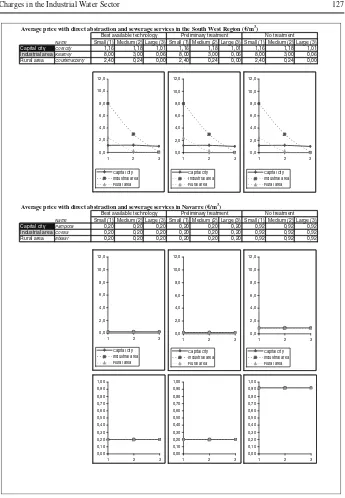
Figure3shows the average charge in euros per cubic metre estimated under Scenario 2.
This price varies with the size of the industry and, is smaller when the dimension of the factory is larger. There is no incentive to have clean technological levels of production and/or effluent treatment. Finally, the average charge depends on the location of the factory. Under Scenario 2 small and medium size factories incur highest charges in industrial areas, however, for a large company the cost per cubic metre reduces due to economies of scale regardless of its location.
In Navarre, the charge for water abstraction is calculated with reference to the private benefit obtained for the company as explained previously. Wastewater services are subject to a regional tax (canon de saneamiento), the volume of discharge is multiplied by a coefficient ofe0.38 per cubic metre in 2006, for this kind of industry this coefficient is also modified by a correction index that depends on the characteristics of the pollution potential of the wastewater. The formula used to calculate this index is:
CI=[0.55×[(COD+2×BOD/3]/312 ]+][(0.34×SS) /286] + [0.11×(NKT/52)]6
Figure3shows the average price in euros per cubic metre estimated for this hypothetical
cotton fabric-finishing factory in Navarre with the parameters provided in Table1. Under
Scenario 2 there is a limited incentive to use clean technological levels of production and/or effluent treatment. The average price does not vary with the dimensions of the factory or where this is located.
Scenario 3: Water supply services and direct wastewater discharges
In the South West region of Ireland water supply services are charged by the relevant division of each County Council for their respective areas, some of them are now moving towards different management systems, so from 2007 onwards, water services will be levied centrally through the Finance Department of Cork County Council. Cork County Council has appointed a contractor to install and read water meters for all industrial consumers in this County. There are two different charging systems in the South West region of Ireland: quarterly based on industrial usage which is metered and is also subject to a minimum charge or annually based on a fixed annually charge. Wastewater discharges should be licensed, the fee due for trade effluent discharges does not differentiate between the amounts of water discharged into watercourses or different technological standards used by the company as explained previously (as stated earlier, Ireland does not apply the Mogden system).
Figure4shows the average charge in euros per cubic metre estimated for this hypothetical cotton fabric-finishing factory in the South West region of Ireland under Scenario 3. This charge depends on the size of the company; it is smaller when the dimension of the factory is larger. There is no incentive to employ clean technological levels of production and/or effluent treatment. Finally, higher charges are incurred in industrial areas, and the lowest rates are applied in rural areas.
In Navarre, water supply services are provided by Local Authorities. They use cost-covering charges in order to finance their operations; usually there is a fixed charge plus a volume-based charge. In order to guarantee everyone has access to water, these charges
are only applied once consumption surpasses a minimum amount (this varies from 6 m3
6CI: Correction Index; COD: tonnes of Chemical Oxygen Demand per annum; BOD: tonnes of Biological
Name Small (1) Medium (2) Large (3) Small (1) Medium (2) Large (3) Small (1) Medium (2) Large (3)
Capital city Cork city 1,16 1,18 1,01 1,16 1,18 1,01 1,16 1,18 1,01 Industrial areaKillarney 8,00 3,00 0,06 8,00 3,00 0,06 8,00 3,00 0,06 Rural area Courtsmacberry 2,40 0,24 0,00 2,40 0,24 0,00 2,40 0,24 0,00
Name Small (1) Medium (2) Large (3) Small (1) Medium (2) Large (3) Small (1) Medium (2) Large (3)
Capital city Pamplona 0,20 0,20 0,20 0,20 0,20 0,20 0,92 0,92 0,92 Industrial areaCorella 0,20 0,20 0,20 0,20 0,20 0,20 0,92 0,92 0,92 Rural area Etxalar 0,20 0,20 0,20 0,20 0,20 0,20 0,92 0,92 0,92
Averageprice with directabstractionand sewerage services in the SouthWestRegion ( /m3)
Averageprice with directabstractionand sewerage services in Navarre ( /m3)
Best available technology Preliminary treatment No treatment Best available technology Preliminary treatment No treatment
0,0
Fig. 3 Scenario 2—average price with direct abstraction and sewerage services in the South West region of Ireland and Navarre region of Spain (e/m3).Note: In order to demonstrate the differences in water charges more clearly the second set of graphs for the Navarre region are presented using a smaller scale
per month in “Mancomunidad de Aguas del Moncayo” to 51 m3 per quarter in “Vera de
Name Small (1) Medium (2) Large (3) Small (1) Medium (2) Large (3) Small (1) Medium (2) Large (3)
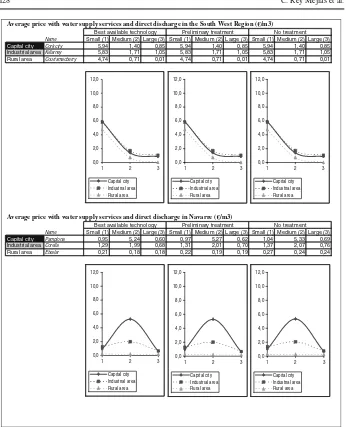
Capital city Cork city 5,94 1,40 0,85 5,94 1,40 0,85 5,94 1,40 0,85
Industrial areaKillarney 5,83 1,71 1,05 5,83 1,71 1,05 5,83 1,71 1,05
Rural area Courtsmacberry 4,74 0,71 0,01 4,74 0,71 0,01 4,74 0,71 0,01
Name Small (1) Medium (2) Large (3) Small (1) Medium (2) Large (3) Small (1) Medium (2) Large (3)
Capital city Pamplona 0,95 5,24 0,60 0,97 5,27 0,62 1,04 5,33 0,69
Industrial areaCorella 1,29 1,99 0,68 1,31 2,01 0,70 1,37 2,07 0,76
Rural area Etxalar 0,21 0,18 0,18 0,22 0,19 0,19 0,27 0,24 0,24
Averageprice with water supply servicesand directdischarge in the South WestRegion ( /m3)
Averageprice with water supply servicesand directdischarge in Navarre ( /m3)
Best available technology Preliminary treatment No treatment
Best available technology Preliminary treatment No treatment
0,0
Fig. 4 Scenario 3—Average price with water supply services and direct discharge in the South West region of Ireland and Navarre region of Spain (e/m3)
Figure4shows the average charge in euros per cubic metre estimated for this hypothetical cotton fabric-finishing factory in Navarre under Scenario 3. There is a limited incentive to use clean technological levels of production and/or effluent treatment. Higher charges are incurred in the capital city, and the lowest rates are applied in rural areas. A medium size industry is penalized and has the highest charges per cubic metre.
Scenario 4: Water supply and sewerage services
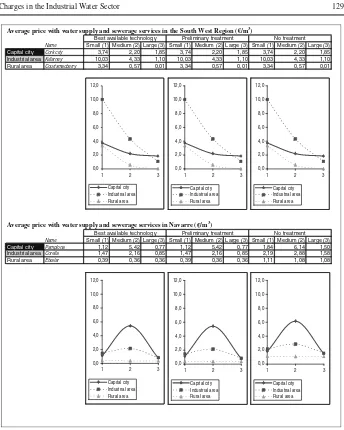
Name Small (1) Medium (2) Large (3) Small (1) Medium (2) Large (3) Small (1) Medium (2) Large (3)
Capital city Cork city 3,74 2,20 1,85 3,74 2,20 1,85 3,74 2,20 1,85
Industrial areaKillarney 10,03 4,33 1,10 10,03 4,33 1,10 10,03 4,33 1,10
Rural area Courtsmacberry 3,34 0,57 0,01 3,34 0,57 0,01 3,34 0,57 0,01
Name Small (1) Medium (2) Large (3) Small (1) Medium (2) Large (3) Small (1) Medium (2) Large (3)
Capital city Pamplona 1,12 5,42 0,77 1,12 5,42 0,77 1,84 6,14 1,50
Industrial areaCorella 1,47 2,16 0,85 1,47 2,16 0,85 2,19 2,88 1,58
Rural area Etxalar 0,39 0,36 0,36 0,39 0,36 0,36 1,11 1,08 1,08
Averageprice with water supply and sewerage services in the SouthWestRegion ( /m3)
Averageprice with water supply and sewerage services in Navarre ( /m3)
Best available technology Preliminary treatment No treatment
Best available technology Preliminary treatment No treatment
0,0
Fig. 5 Scenario 4—average price with water supply and sewerage services in the South West region of Ireland and Navarre region of Spain (e/m3)
Figure5shows the average charge in euros per cubic metre estimated for this hypothetical cotton fabric-finishing factory in the South West region of Ireland under Scenario 4. This charge depends on the size of the company; it is smaller when the dimension of the factory is larger. There is no incentive to use clean technological levels of production and/or effluent treatment. Finally, the higher charges are incurred in industrial areas, and the lowest rates are applied in rural areas.
In Navarre water supply services are levied by Local Authorities and connection to wastewater services are charged by a regional company, as previously outlined.
Figure5shows the average charge in euros per cubic metre estimated for this
to employ clean technological levels of production and/or effluent treatment. The higher charges are incurred in the Capital city, and the lowest charges are applied in rural areas. A medium size industry is penalized and has the highest charges per cubic metre.
There is a sharp contrast between Spain, where volumetric charging for water supply and sewerage services is generally utilized; and Ireland, where charges do not vary according to the amount of water used. While in Spain the water charging system can transmit the environmental cost of water supply to consumers as a well-linked incentive signal for water conservation, in Ireland this does not occur. Therefore, in the case of the latter there is no incentive for consumers to modify their behaviour to take account of the cost of water supply and sewerage services.
The calculated figures indicate a wide range of charges between the different sizes and technologies of industrial users as well as between the different locations in each region. At first glance, one might be inclined to arrive at the firm conclusion that Ireland charges more to small firms (some may attribute this to the fixed charge cost), however, we need to be cautious when arriving at such a conclusion given that admittedly, using the data pre-sented in this study from the South West region of Ireland one could conclude that small firms incur higher charges than larger firms however, this conclusion could not be drawn for all firms in Ireland. Likewise, employing the data presented in this study from the Navarre region of Spain one could conclude that medium sized firms always incur higher charges than small and larger firms, however, yet again, this conclusion could not be drawn for all firms in Spain. Clearly, further analysis is merited in this regard before any general (in this case country-wide) conclusions can be made in this regard.
The rationale for the Irish charging scheme is to finance provision and administrative costs and not to serve as a clear and obvious incentive to reduce environmental pollution. These charges do not differentiate at all between the different technological standards. The Spanish scheme tends to transmit incentive signals for water conservation although the charges are so low that it is difficult to see why users would actually modify their behaviour.
The charges in Navarre are generally rather modest while the charges in the South West region of Ireland are more substantial. It is clear that there are weaknesses with both charg-ing systems; in the first one the rate is not sufficiently high to produce incentives; in the latter, fiscal considerations had the upper hand in the design process, while efficiency and environmental considerations has been marginalised.
5 Conclusion
Improved management of water quality and supply is essential to protect aquatic ecosystems as well as being a means of supporting regional economic development. Economic theory demonstrates how the behaviour of individuals can be targeted through the use of price as an effective means of signalling. To ensure that desirable behaviour with respect to water use is achieved, it is necessary to accurately estimate the price of water, accounting for all factors, regardless of whether they are currently included in the market price.
The European Treaty establishes the application of the polluter pays principle in all environmental policies across Member States. Specifically the WFD calls for full-cost recov-ery for industry, households and agriculture. This aims to ensure that pricing provides ade-quate incentives for all consumers to use water resources efficiently.
of water usage. As European countries have a wide divergence in the configuration of their regional water charging systems it is difficult to evaluate them directly.
For the purpose of analysis in the current paper, Spain and Ireland have been studied as two locations with economic similarities on the one hand and extreme water availability conditions on the other. Each possesses its own particular taxation regime. It appears that existing water charges in the regions studied in these countries are not directly related to environmental incentives. In fact, under-pricing water undermines efforts to reduce water consumption and reuse water in industrial premises as well as discouraging technological developments.
The model developed in the current paper has been merely ‘tested’ in the case of regions in Ireland and Spain, the overriding belief however, is that the model developed here will have broad based application across other regions and countries. One of the interesting con-tributions of this paper is that the data and price tables illustrate a good way of presenting the charges and point to the manner in which each River Basin District might consider presenting its charging regime.
This study demonstrates that large industrial water consumers have a tendency to incur lower charges than smaller industrial consumers. Water charges in urban areas also tend to be higher than in rural areas. The water charges analysed here do not provide sufficient incentives for consumers to apply best available techniques and thereby fail to contribute to the environmental objectives of the WFD.
There are differences in the basis of the water charges, as well as the rates, and there are also differences in the types of consumers charged in each region. The latter would compli-cate any attempt for full-cost recovery. There are also conflicts between local, regional and national priorities and EU targets, this demonstrates that currently environmental efficiency is not being achieved.
The paper provides an example of how water-pricing to industry can be analysed. It demonstrates how the prices in the two selected regions did not reflect demands on the sys-tem or environment and how far away the regions were from full cost recovery. On a more general level, the analysis illustrates the amount of price reform that would be necessary to fulfil the pricing requirements of the WFD.
To conclude, existing water charges do not provide incentives for users to use water efficiently and thereby do not contribute effectively to the environmental objectives of the WFD.
Acknowledgments The authors are grateful to Stephen Kinsella, and anonymous referees for comments and suggestions. The usual disclaimers apply.
References
Azqueta D (1993) The Coase theorem and environmental economics: a survey of some unsettled issues. Revista Española de Economía 10:59–71
Azqueta D (2002) Introducción a la economía ambiental, 1st edn. McGraw-Hill, Madrid
Bös D (1985) Public sector pricing. In: Auerbach AJ, Feldstein M (eds) Handbook of public economics, vol 1. Elsevier science, New York p 129
Census (2002) Volume 1—population classified by area. Central Statistics Office, Ireland.http://www.cso.ie/
census/Census2002Results.htm. Cited 17 Dec 2008
CSO (2005) Employment in manufacturing industries 2002.http://www.cso.ie. Cited 17 Dec 2008 EEA (2003) Europe’s water: an indicator-based assessment, Topic Report No. 1/2003. European Environment
Ekins P (1999) European environmental taxes and charges: recent experience, issues and trends. Ecol Econ 31:39–62
EPA (2004) A report for 2001–2003. Environmental Protection Agency, Ireland
European Parliament (2001) Effluent charging system in the EU member states. Environment series, ENNVI 104 EN. European Parliament, Luxembourg
Eurostat (2005) Europe in figures. Eurostat yearbook 2005-Chap. 1 Statisticians for Europe.http://ec.europa. eu/eurostat. Cited 17 Dec 2008
INE (2005) Instituto Nacional de Estadística.http://www.ine.es. Cited 17 Dec 2008
Kraemer RA, Banholzer KM (1999) Tradable permits in water resource management and water pollution con-trol, OECD Proceedings, implementing domestic tradable permits for environmental protection, OECD, Paris
Oakland WH (1987) Theory of public goods. In: Auerbach AJ, Feldstein M (eds) Handbook of public eco-nomics, vol 2. Elsevier science, New York p 485
OECD (1999) Industrial water pricing in OECD countries. ENV/EPOC/GEEI (98)10/FINAL, OECD, Paris Rosen H (2001) Public finance, 6th edn. McGraw Hill
Scott S, Lawlor J (1994) Waste water services: charging industry the capital cost. Policy Research Series, 22, Economic & Social Research Institute, Dublin
Tietenberg T (2000) The tradable permits approach to protecting the commons: what have we learned? Colby College, Maine.http://www.colby.edu/personal/t/thtieten. Cited 17 Dec 2008