Research Article
Beef Quality Identification Using Thresholding Method and
Decision Tree Classification Based on Android Smartphone
Kusworo Adi,
1Sri Pujiyanto,
2Oky Dwi Nurhayati,
3and Adi Pamungkas
11Department of Physics, Diponegoro University, Semarang, Indonesia 2Department of Biology, Diponegoro University, Semarang, Indonesia
3Department of Computer System, Diponegoro University, Semarang, Indonesia
Correspondence should be addressed to Kusworo Adi; [email protected]
Received 11 April 2017; Revised 24 August 2017; Accepted 5 September 2017; Published 17 October 2017
Academic Editor: Paolo Napoletano
Copyright © 2017 Kusworo Adi et al. This is an open access article distributed under the Creative Commons Attribution License, which permits unrestricted use, distribution, and reproduction in any medium, provided the original work is properly cited.
Beef is one of the animal food products that have high nutrition because it contains carbohydrates, proteins, fats, vitamins, and minerals. Therefore, the quality of beef should be maintained so that consumers get good beef quality. Determination of beef quality is commonly conducted visually by comparing the actual beef and reference pictures of each beef class. This process presents weaknesses, as it is subjective in nature and takes a considerable amount of time. Therefore, an automated system based on image processing that is capable of determining beef quality is required. This research aims to develop an image segmentation method by processing digital images. The system designed consists of image acquisition processes with varied distance, resolution, and angle. Image segmentation is done to separate the images of fat and meat using the Otsu thresholding method. Classification was carried out using the decision tree algorithm and the best accuracies were obtained at 90% for training and 84% for testing. Once developed, this system is then embedded into the android programming. Results show that the image processing technique is capable of proper marbling score identification.
1. Introduction
Beef is one of the many produce prone to contamination by microorganism. Water and nutritional contents make an ideal medium for the growth and proliferation of microorganism [1, 2]. Contaminated beef will easily degrade and has less storage duration. Beef class is valued by two factors: its price and its quality. The quality itself is measured by four characteristics: marbling, meat color, fat color, and meat density. Specifically, marbling is the dominant parameter that determines meat’s quality [3, 4]. Determination of beef qual-ity is commonly conducted visually by comparing the actual beef and reference pictures of each beef class. This process presents weaknesses as it is subjective in nature and takes a considerable amount of time. Therefore, an automated system based on image processing that is capable of determining beef quality is required. Some researches suggest that image processing can be applied to analyze beef color and texture that will in turn allow analysis results to be used as a reference parameter in the process of meat quality identification [3–6].
Furthermore, marbling grade evaluation has been conducted using the watershed algorithm and artificial neural network [7].
This research aims to develop an image segmentation using the Otsu thresholding method to separate the images of fat and meat. Researches on image processing using thresholding segmentation have been conducted before [8– 12]. The developed algorithm is proven capable of meat quality identification based on color and texture. This system is then embedded into the android programming to enable even faster and easier use.
2. Theory
Some researches on the application of image processing for beef quality identification have been conducted earlier [4–6]. One of those researches tried to determine the quality of beef using texture analysis with the gray level cooccurrence matrix (GLCM) method [3]. Beef quality is categorized into 12 grades based on the amount of fat it contains. A research by Shiranita
Figure 1: Beef quality levels based on marbling scores [3].
et al. shows that the GLCM method is effective in determining beef quality. Another research on the application of image texture to classify beef type yielded a correlation up to 0.8 [5]. The other research that designed the hardware and software for beef image segmentation using the vision threshold method can be used as the initial process for beef quality testing [6]. Those researches indicate that image processing based on meat texture can be applied to identify beef quality. Some other researches also prove that mobile image analysis methods based on android programming are also applicable [13–15]. Among these android related researches is image recognition using android smartphones [13], basic digital image processing using android [14], and application of power consumption meter based on image processing using android smartphones [15]. Results of those three researches show that image processing can be embedded into android-based mobile devices.
Beef quality is categorized into 12 grades [3] as depicted in Figure 1. This is the result of image texture analysis using the gray level cooccurrence matrix (GLCM) method and meat type recognition process using the multi-support vector machine (MSVM) method.
2.1. Image Segmentation and Feature Extraction. The image processing starts from image segmentation consisting of two stages. The first is separating the meat and the background. This process begins with thresholding the blue canal of the RGB (Red, Green, and Blue) image using the Otsu thresholding method to obtain a binary image. Afterwards, the binary image is used as masking for object cropping. Once the object is separated from the background, the second stage of segmentation, that is, meat and fat separation, proceeds. This process itself starts by converting the RGB color space into the grayscale color. Then, the process of thresholding to separate meat and fat can be done. Otsu’s method is also one of the oldest methods of image segmentation that is treated
on statistical method according to the probabilistic imple-mentation [16]. Otsu’s method is one of the best automatic thresholding methods [17]. Basic principle of Otsu’s method is to divide image into two classes that form object and background. Automatic threshold is obtained by finding the maximum variance between two classes [9, 10]. If the[1, 𝐿] is the grayscale in the image and𝑃𝑖is the probability of each level, the number of pixels with gray level𝑖is symbolized by 𝑓𝑖; thus the probability of gray level𝑖in the image of equations is given [16, 18]:
𝑃𝑖= 𝑓𝑁.𝑖 (1)
If𝜇𝑇is the automatic thresholding that divides the class into two classes𝐶1 = [1, . . . , 𝑡]and𝐶2 = [𝑡 + 1, . . . , 𝐿][17, 19], therefore the probability distribution of the degree of gray for the two classes is
𝐶1→ [ 𝑃∑𝑡1
If𝜇𝑇is an overall average of the image, therefore by adding up all the parts it became
whereas
Total probability will always be the same with one, so
𝛽1+ 𝛽2= 1. (6)
Therefore Otsu will define variant between two classes𝐶1and 𝐶2by the equation
𝜎2= 𝛽1(𝜇1− 𝜇𝑇)2+ 𝛽2(𝜇2− 𝜇𝑇)2. (7) Optimal value threshold𝑇is the maximum value between variant classes𝜎2that is shown by the following equation:
𝑇 =max{𝜎2(𝑡) , 1 ≤ 𝑡 ≤ 𝐿} . (8)
Once segmentation is done, features extraction is carried out based on two parameters of meat area and fat area. Meat area is the number of pixels it is made of, whereas fat area is the number of pixels making up the fat area. Both parameters were used as inputs for the classification algorithm that determines the marbling score.
Otsu’s method is one of the global methods looking for thresholds that minimize class variance from original image histogram, that is, background and foreground. The purpose of the Otsu thresholding method is to divide the gray level image histogram into two different regions automatically without requiring the user’s help to enter the threshold value. The approach taken by Otsu’s method is to conduct a discriminant analysis of determining a variable that can distinguish between two or more groups that arise naturally. Discriminant analysis maximizes these variables in order to split the foreground and background objects. Since the beef image samples have a large variance between background and object, the Otsu thresholding method is appropriate for a meat quality identification system compared to traditional segmentation.
2.2. Classification. The classification algorithm used in this research is decision tree algorithm using the C4.5 model. Classification is started by forming a root node followed by entropy value calculation for all data trained in the node. Parameters with maximum gain information were used as breaking nodes that make branches. Next, if each node has not yielded one class label, then entropy value calculation is repeated. However, when each node has yielded one class label, then each of these nodes will be used as the leave nodes containing decisions [20–22]. Based on research [21] the decision tree based C4.5 algorithm achieved the highest classification accuracy compared with Support Vector Machines (SVM) and Multilayer Perceptron (MLP) model. Therefore in this research we used the C4.5 model for the classification of beef quality.
Image
Figure 2: Research diagram block.
3. Method
The system designed in this research includes processes of image acquisition, image segmentation, features extraction, marbling score classification, and system embedding into the android programming. The diagram block for this system design is given in Figure 2.
Algorithm 1. The following is an automatic threshold using Otsu’s method and classification using decision tree as fol-lows:
(1) Start (2) Load Image
(3) Calculate the probability of each level of intensity (4) Set the initial values𝛽𝑖and𝜇𝑖
(5) Calculate the optimal threshold valueTwith different values1 ≤ 𝑡 ≤ 𝐿
(6) Update the value of𝛽𝑖and𝜇𝑖 (7) Calculate the value of𝜎2(𝑡)
(8) Desired threshold is the maximum value of𝜎2(𝑡) (9) Calculate meat area (𝐴𝑚) and fat area (𝐴𝑓) (10) Input node parameters𝐴𝑚and𝐴𝑓
(11) Calculate entropy for all parameters in the node (12) Choose parameters with maximum gain value (13) Use those parameter as breaking node that make
braches
(14) Each node only give one class label, if true to step (13) else step (9)
(15) Node become leaves containing marbling score deci-sions
(16) End
4. Result and Discussion
The image processing stages involved in this research con-sist of image acquisition, image segmentation, and system embedding into the android programming.
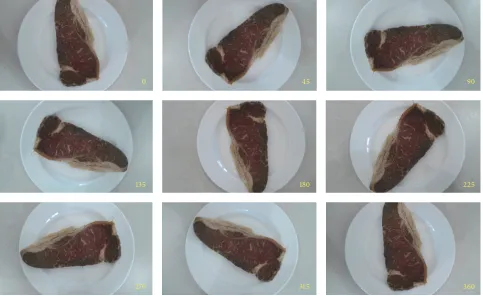
4.1. Image Acquisition. Results of beef image acquisition along with the marbling scores are given in Figure 3. The marbling scores (MB) in this research are 4, 5, 6, 7, and 9.
Image acquisition is conducted vertically by varying the camera distance, resolution, and angle. The varied distances are 20 cm and 30 cm. In addition, the varied resolutions are 3.2 MP, 4 MP, and 5 MP. Samples of beef image resulting from distance and resolution variations are given in Table 1.
Figure 3: Samples of acquired beef images.
Table 1: Samples of beef image from varied camera distance and resolution.
Resolution
3.2 MP 4 MP 5 MP
Distance
20 cm
30 cm
0 45 90
135 180 225
270 315 360
(a) RGB image (b) Blue canal
(c) Binary image (d) Segmentation result
Figure 5: The first stage of beef segmentation.
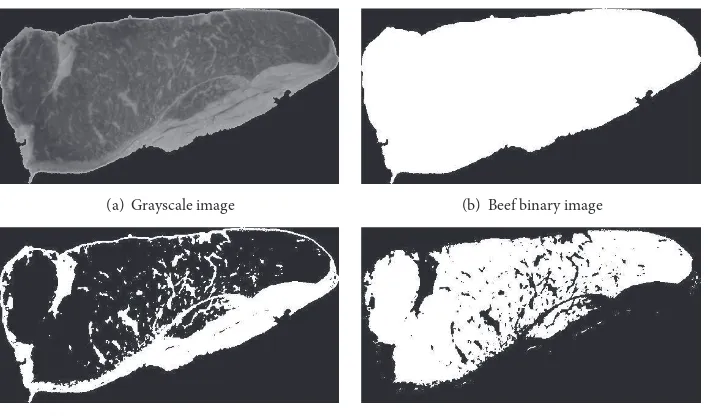
(a) Grayscale image (b) Beef binary image
(c) Fat binary image (d) Meat binary image
Figure 6: The second stage of beef segmentation.
Each image from every varied combination is taken twice. Hence, as many as 540 images were obtained.
4.2. Image Segmentation. The process of image segmentation to separate meat and fat consists of two stages. First, separat-ing the meat from the background. This process begins with extracting the blue canal of the RGB image. This extracted blue canal then undergoes the Otsu thresholding method to yield a binary image. Then, this binary image is used as a mask in the process of meat cropping, as shown in Figure 5.
Once the meat is separated from the background. The next step of image segmentation that separates the meat and
fat begins. This process itself starts by converting the RGB color space into the grayscale color. Then, the process of thresholding to separate meat and fat ensues. The threshold-ing values set are 76 for fat and 30 for meat. This second stage of image segmentation is given in Figure 6.
Those results show that all acquired images can be properly segmented using the Otsu thresholding method.
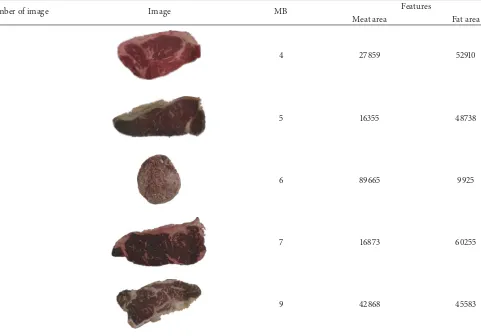
Table 2: Samples of features extraction.
Number of image Image MB Features
Meat area Fat area
4 27859 52910
1
5 16355 48738
2
6 89665 9925
3
7 16873 60255
4
9 42868 45583
5
which it is made of (Figure 6(c)). The samples of features extraction results are shown in Table 2.
Both categories of extracted features are then used as inputs in the process of beef quality classification.
4.4. Classification. In this research, marbling score classifi-cation is carried out using the decision tree algorithm. The decision tree algorithm for identification of beef quality is shown in Figure 7.
The confusion matrix that resulted from that decision tree in the training process is given in Table 3.
It can be seen in Table 3 that there are nine pieces of beef data that are wrongly identified. Hence, the resulting accuracy is
Accuracy= the number of correctly identified data total data
× 100%
= 8190 × 100%= 90%.
(9)
The confusion matrix that resulted from the decision tree is given in Table 4. This matrix is from the testing process.
Fat area
Fat area
MB 6
Meat area Meat area
MB 5 MB 7 MB 9 MB 4
<42939.5 ≥42939.5
<21856 ≥21856
<86785.5 ≥86785.5<78627 ≥78627
Figure 7: Decision tree for beef image with 4 MP resolutions.
Table 3: Confusion matrix from decision tree in the training process.
Table 4: Confusion matrix from decision tree in the testing process.
Predicted class
Table 5: Overall results from both training and testing processes.
Distance variation Resolution variation
No variation
20 cm 30 cm 3,2 MP 4 MP 5 MP
Number of image Training 135 135 90 90 90 270
Testing 135 135 90 90 90 270
Accuracy (%) Training 82 86 83 90 90 37,7
Testing 80 81 81 84 78 35,18
Results from both system training and testing using decision tree algorithm are given in Table 5.
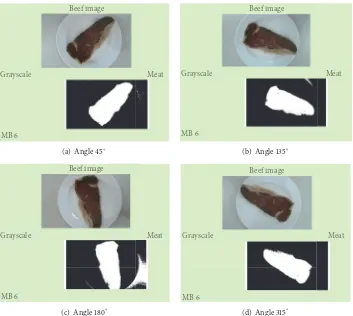
Distance and resolution variations need to be done to determine the best distance and minimum resolution required by the system to properly acquire the beef image. Variation of distance will give an impact on the image detail obtained by smartphone camera, so that the right distance will get a good image. Results from both system training and testing show that image acquisition at 30 cm gives better accuracy compared to acquisition from a 20 cm distance. Other than that, image acquisition using a 4 MP resolution camera yields better results compared to using both 3.2 MP and 5 MP resolution cameras. While the variation of angle for beef acquisition using smartphone camera has no significant effect, the process of testing data with various angle will be recognized as beef with the same quality. So it can be concluded that the acquisition image with variation of angle does not affect the beef quality identification process; it can be seen in Figure 8. So the acquisition image can be taken from various angles with the perpendicular position between the beef and the camera smartphone.
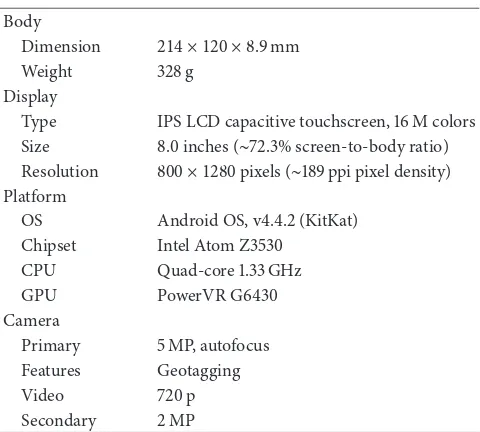
4.5. Android Smartphone Implementation. This research uses both hardware and software. The hardware utilized is a tablet with specifications given in Table 6.
Meanwhile, the software used is android studio and openCV. The process of system embedding into the android programming is shown in Figure 9.
Table 6: Hardware specification.
Body
Dimension 214 × 120 × 8.9mm
Weight 328 g
Display
Type IPS LCD capacitive touchscreen, 16 M colors Size 8.0 inches (∼72.3% screen-to-body ratio) Resolution 800 × 1280pixels (∼189 ppi pixel density) Platform
OS Android OS, v4.4.2 (KitKat)
Chipset Intel Atom Z3530
CPU Quad-core 1.33 GHz
GPU PowerVR G6430
Camera
Primary 5 MP, autofocus
Features Geotagging
Video 720 p
Secondary 2 MP
Beef image
Meat Grayscale
MB 6
(a) Angle 45∘
Beef image
Meat Grayscale
MB 6
(b) Angle 135∘
Beef image
Meat Grayscale
MB 6
(c) Angle 180∘
Beef image
Meat Grayscale
MB 6
(d) Angle 315∘
Figure 8: Example of testing result for variation of angle with marbling score (MB) 6.
Figure 9: System embedding into android.
this method can be further used for future research such as in beef quality identification based on video processing systems.
5. Conclusion
Results show that the system developed in this research is capable of acquiring and segmenting beef images and
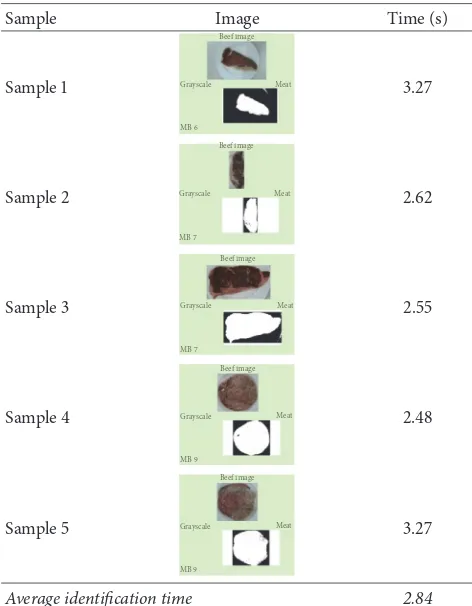
Table 7: Result of testing identification time.
Sample Image Time (s)
Sample 1
Average identification time 2.84
process was 2.84 s. This system is then embedded into the android programming as to allow further research on beef quality identification based on video processing systems.
Conflicts of Interest
The authors declare that they have no conflicts of interest.
Acknowledgments
This research was funded by a program from the Indonesian Directorate General of Higher Education in 2016.
References
[1] J. Li, J. Tan, F. A. Martz, and H. Heymann, “Image texture features as indicators of beef tenderness,”Meat Science, vol. 53, no. 1, pp. 17–22, 1999.
[2] F. Ruiz De Huidobro, E. Miguel, B. Bl´azquez, and E. Onega, “A comparison between two methods (Warner-Bratzler and texture profile analysis) for testing either raw meat or cooked meat,”Meat Science, vol. 69, no. 3, pp. 527–536, 2005.
[3] K. Shiranita, T. Miyajima, and R. Takiyama, “Determination of meat quality by texture analysis,”Pattern Recognition Letters, vol. 19, no. 14, pp. 1319–1324, 1998.
[4] K. Shiranita, K. Hayashi, A. Otsubo, T. Miyajima, and R. Takiyama, “Grading meat quality by image processing,”Pattern Recognition, vol. 33, no. 1, pp. 97–104, 2000.
[5] O. Basset, B. Buquet, S. Abouelkaram, P. Delachartre, and J. Culioli, “Application of texture image analysis for the classifica-tion of bovine meat,”Food Chemistry, vol. 69, no. 4, pp. 437–445, 2000.
[6] K. Chen and C. Qin, “Segmentation of beef marbling based on vision threshold,”Computers and Electronics in Agriculture, vol. 62, no. 2, pp. 223–230, 2008.
[7] X. Meng, Y. Sun, Y. Ni, and Y. Ren, “Evaluation of beef marbling grade based on advanced watershed algorithm and neural network,”Advance Journal of Food Science and Technology, vol. 6, no. 2, pp. 206–211, 2014.
[8] K. Adi, S. Pujiyanto, O. D. Nurhayati, and A. Pamungkas, “Beef quality identification using color analysis and k-nearest neighbor classification,” inProceedings of the 4th International Conference on Instrumentation, Communications, Information Technology and Biomedical Engineering, ICICI-BME 2015, pp. 180–184, idn, November 2015.
[9] K. Adi, R. Gernowo, A. Sugiharto, K. S. Firdausi, A. Pamungkas, and A. B. Putranto, “Tuberculosis (TB) Identification in The Ziehl-Neelsen Sputum Sample in NTSC Channel and Support Vector Machine (SVM) Classification,”International Journal of Innovative Research in Science, Engineering and Technology, vol. 2, no. 9, pp. 5030–5035, 2013.
[10] K. Adi, R. Gernowo, A. Sugiharto, A. Pamungkas, A. B. Putranto, and N. Mirnasari, “Autothresholding Segmentation For Tuberculosis Bacteria Identification In The Ziehl-Neelsen Sputum Sample,” inProceedings of the 7th International Confer-ence on Information & Communication Technology and Systems, Bali, Indonesia, 2013.
[11] K. Adi, S. Pujiyanto, R. Gernowo, A. Pamungkas, and A. B. Putranto, “Identification of plasmodium falciparum phase in red blood cells using artificial neural networks,”International Journal of Applied Engineering Research, vol. 9, no. 22, pp. 13917– 13924, 2014.
[12] A. Pamungkas, K. Adi, and R. Gernowo, “Identification of plasmodium falciparum development phase in malaria infected red blood cells using adaptive color segmentation and decision tree based classification,”International Journal of Applied Engi-neering Research, vol. 10, no. 2, pp. 4043–4056, 2015.
[13] I. Billiauws and K. Bonjean,Image Recognition on an Android Mobile Phone (Msc. thesis), Elektronica-Ict, 2009.
[14] R. S. Jagtap and J. A. Sadalage, “Image Processing as Android Application,” International Journal of Science and Research Technology, vol. 1, no. 2, pp. 12–15, 2013.
[15] K. M. Saipullah, A. Anuar, N. A. Ismail, and Y. Soo, “Measuring power consumption for image processing on Android smart-phone,”American Journal of Applied Sciences, vol. 9, no. 12, pp. 2052–2057, 2012.
[16] N. Otsu, “A threshold selection method from gray-level his-togram,”IEEE Transactions on System Man Cybernetics, vol. 9, no. 1, pp. 62–66, 1979.
[17] D.-Y. Huang, T.-W. Lin, and W.-C. Hu, “Automatic multilevel thresholding based on two-stage Otsu’s method with cluster determination by valley estimation,” International Journal of Innovative Computing, Information and Control, vol. 7, no. 10, pp. 5631–5644, 2011.
[18] F. Jassim and F. H. AAltaani, “Hybridization of otsu method and median filter for color image segmentation,”International Journal of Soft Computing and Engineering (IJSCE), vol. 3, no. 2, 2013.
images,” inProceedings of the MPGI National Multi Conference 2012 (MPGINMC-2012, Advancement in Electronics Telecommu-nication Engineering), 2012.
[20] H. Chauhan and A. Chauhan, “Implementation of decision tree algorithm c4.5,”International Journal of Scientific and Research Publications, vol. 3, no. 10, 2013.
[21] F. S. Alaa and A. Amneh, “A Professional Comparison of C4.5, MLP, SVM for Network Intrusion Detection based Feature Analysis,”ICGST Journal of Computer Networks and Internet Research, vol. 6, no. 3, pp. 192–205, November 2015.
Submit your manuscripts at
https://www.hindawi.com
Hindawi Publishing Corporation
http://www.hindawi.com Volume 2014
Anatomy
Research International
Peptides
Hindawi Publishing Corporation
http://www.hindawi.com Volume 2014
Hindawi Publishing Corporation http://www.hindawi.com
International Journal of
Volume 201
=RRORJ\
Hindawi Publishing Corporation
http://www.hindawi.com Volume 2014
Molecular Biology International
Genomics
International Journal of
Hindawi Publishing Corporation
http://www.hindawi.com Volume 2014
The Scientific
World Journal
Hindawi Publishing Corporationhttp://www.hindawi.com Volume 2014
Hindawi Publishing Corporation
http://www.hindawi.com Volume 2014
Bioinformatics
Advances inMarine Biology
Journal ofHindawi Publishing Corporation
http://www.hindawi.com Volume 2014
Hindawi Publishing Corporation
http://www.hindawi.com Volume 2014
Signal Transduction
Journal ofHindawi Publishing Corporation
http://www.hindawi.com Volume 2014
BioMed
Research International
Evolutionary Biology International Journal of
Hindawi Publishing Corporation
http://www.hindawi.com Volume 2014
Hindawi Publishing Corporation
http://www.hindawi.com Volume 2014
Biochemistry Research International
Archaea
Hindawi Publishing Corporation
http://www.hindawi.com Volume 2014
Hindawi Publishing Corporation
http://www.hindawi.com Volume 2014
Genetics
Research International
Hindawi Publishing Corporation
http://www.hindawi.com Volume 2014
Advances in
Virology
Stem Cells
International
Hindawi Publishing Corporation
http://www.hindawi.com Volume 2014
Hindawi Publishing Corporation
http://www.hindawi.com Volume 2014
Enzyme
Research
Hindawi Publishing Corporation
http://www.hindawi.com Volume 2014
![Figure 1: Beef quality levels based on marbling scores [3].](https://thumb-ap.123doks.com/thumbv2/123dok/3821696.1834546/2.600.61.543.74.291/figure-beef-quality-levels-based-marbling-scores.webp)