57
Lampiran 1 Contoh Data Ilustrasi Kasus 1
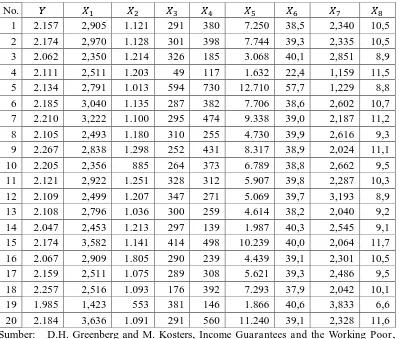
Tabel 3.1 Data rata-rata jam kerja dan faktor-faktor yang mempengaruhinya
No.
1 2.157 2,905 1.121 291 380 7.250 38,5 2,340 10,5 2 2.174 2,970 1.128 301 398 7.744 39,3 2,335 10,5 3 2.062 2,350 1.214 326 185 3.068 40,1 2,851 8,9 4 2.111 2,511 1.203 49 117 1.632 22,4 1,159 11,5 5 2.134 2,791 1.013 594 730 12.710 57,7 1,229 8,8 6 2.185 3,040 1.135 287 382 7.706 38,6 2,602 10,7 7 2.210 3,222 1.100 295 474 9.338 39,0 2,187 11,2 8 2.105 2,493 1.180 310 255 4.730 39,9 2,616 9,3 9 2.267 2,838 1.298 252 431 8.317 38,9 2,024 11,1 10 2.205 2,356 885 264 373 6.789 38,8 2,662 9,5 11 2.121 2,922 1.251 328 312 5.907 39,8 2,287 10,3 12 2.109 2,499 1.207 347 271 5.069 39,7 3,193 8,9 13 2.108 2,796 1.036 300 259 4.614 38,2 2,040 9,2 14 2.047 2,453 1.213 297 139 1.987 40,3 2,545 9,1 15 2.174 3,582 1.141 414 498 10.239 40,0 2,064 11,7 16 2.067 2,909 1.805 290 239 4.439 39,1 2,301 10,5 17 2.159 2,511 1.075 289 308 5.621 39,3 2,486 9,5 18 2.257 2,516 1.093 176 392 7.293 37,9 2,042 10,1 19 1.985 1,423 553 381 146 1.866 40,6 3,833 6,6 20 2.184 3,636 1.091 291 560 11.240 39,1 2,328 11,6 Sumber: D.H. Greenberg and M. Kosters, Income Guarantees and the Working Poor,
The Rand Corporation, R-579-OEO, December 1970
