SINKHOLE SUSCEPTIBILITY HAZARD ZONES USING GIS AND ANALYTICAL
HIERARCHICAL PROCESS (AHP): A CASE STUDY OF KUALA LUMPUR AND
AMPANG JAYA
Mohd Asri Hakim Mohd Rosdi, Ainon Nisa Othman, Muhamad Arief Muhd Zubir Zulkiflee Abdul Latif & Zaharah Mohd Yusoff
Centre of Studies for Surveying Science and Geomatics, Faculty of Architecture, Planning and Surveying, Universiti Teknologi MARA, 40450 Shah Alam, Selangor Darul Ehsan, MALAYSIA.
KEY WORDS: Geographical Information System, Analytical Hierarchical Process, Sinkhole Susceptibility Hazard Zones
ABSTRACT:
Sinkhole is not classified as new phenomenon in this country, especially surround Klang Valley. Since 1968, the increasing numbers of sinkhole incident have been reported in Kuala Lumpur and the vicinity areas. As the results, it poses a serious threat for human lives, assets and structure especially in the capital city of Malaysia. Therefore, a Sinkhole Hazard Model (SHM) was generated with integration of GIS framework by applying Analytical Hierarchical Process (AHP) technique in order to produced sinkhole susceptibility hazard map for the particular area. Five consecutive parameters for main criteria each categorized by five sub classes were selected for this research which is Lithology (LT), Groundwater Level Decline (WLD), Soil Type (ST), Land Use (LU) and Proximity to Groundwater Wells (PG). A set of relative weights were assigned to each inducing factor and computed through pairwise comparison matrix derived from expert judgment. Lithology and Groundwater Level Decline has been identified gives the highest impact to the sinkhole development. A sinkhole susceptibility hazard zones was classified into five prone areas namely very low, low, moderate, high and very high hazard. The results obtained were validated with thirty three (33) previous sinkhole inventory data. This evaluation shows that the model indicates 64% and 21% of the sinkhole events fall within high and very high hazard zones respectively. Based on this outcome, it clearly represents that AHP approach is useful to predict natural disaster such as sinkhole hazard.
1. INTRODUCTION
Sinkhole or land subsidence is not a new phenomenon in Malaysia, especially surround Klang Valley. According to (Meng, 2005), sinkhole can be defined as on the ground surface depression due to the dissolving of the limestone near the surface or the collapse of an underground cave. Basically, Kuala Lumpur has two different geological formations, namely Kenny Hill Formation which consists of sedimentary rocks and Kuala Lumpur Limestone Formation with its famous highly erratic karstic constituents (Meng, 2005). Over 158 years of rapid development and rampant land use planning has led to specific changes in topography and geomorphology such as appearance of sinkholes. It can be disastrous and terrifying because of the condition is very unstable (Waltham, 2009). In urban areas such as Kuala Lumpur and Ampang city, the combination of industrial or development activities accelerated the process of sinkhole development. Overburden on the surface of earth for instance ex mining retention ponds, buildings, heavy traffic and changes in groundwater table induce to sinkhole process (Abidin, et al., 2002). Kuala Lumpur and Ampang city is located dominantly on the Kuala Lumpur Limestone Formation. Rapid development of these areas has had some impacts that are destructive to the environment. The cases can be originates from various places that having limestone bedrock formation, unpredictable and sudden. Often we heard recently in the newspaper or media about sinkhole tragedies and its effect to the human and infrastructure. Based on previous study, sinkhole only occurs in limestone bedrock areas (Abidin, et al., 2002). A sinkhole occurrence is seen as a result of high rainfall distribution and changing of groundwater levels in limestone areas. A stable and firm land surface is crucial for any urban
development process in order to ensure public safety. This can increase country economic activity and stay competitive with others. In other word, any construction works must appropriately deal with the condition of karstic bedrock limestone. If not, many uncertainties and difficulties can be occurred in the future. Along with the globalization of technology, GIS become a wide information source especially in decision making for natural hazards. Since GIS had been implemented in many countries for natural hazard prediction, Malaysia is still not optimally used this technology to identify the conditions that may trigger sinkhole hazards. Thus, GIS were utilized to evaluate the potential sinkhole hazard areas using Analytical Hierarchy Process (AHP) technique. The AHP technique is developed by Saaty is based on three principles namely: decomposition, comparative judgment and synthesis of priorities (Malczewski, 1999). The use of GIS allows the combination of data from various sources gives the higher accuracy and time efficient (Kouri, et al., 2013). Inaccurate prediction will cause the human ignorance, then, more sinkhole to occur. An integration of GIS and AHP technique are needed to produce accurate models in order to produce potential sinkhole hazard maps.
2. METHODOLOGY
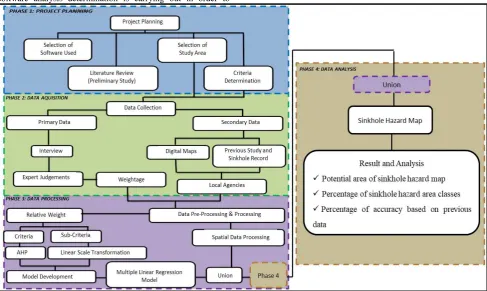
DBKL and MPAJ’s area. Next, in the second phase all data were classified by primary and secondary data sources. In the third phase, data processing which involves weightage and software analysis determination is carrying out in order to
achieve the research objectives. Next, the sinkhole hazard model is generated and used to map the susceptible location for sinkhole hazards as the last process in this research.
Figure 1. Research Methodology
2.1 Research Area
The area covers a whole part of DBKL and MPAJ administrative territories. The total area under DBKL is approximately 279,327 hectares, while the area for MPAJ is 14,350 hectares. This area was selected based on the geological setting, frequent issues occurred, the availability of previous sinkhole incident data and the availability of data. Basically, Kuala Lumpur lies on the extensive limestone bedrock which overlain by alluvial layer (Kong & Komoo, 1990). The formation of limestone covers the majority area of Kuala Lumpur and Ampang vicinity. The soil type mainly consists of urbanized land and forest. Figure 2 depicts the boundary and sinkhole location of the study area
2.2 Data Collection
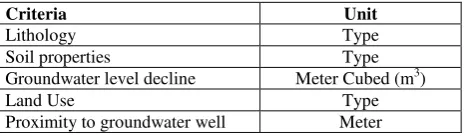
The data used for this research are generally based on criteria determination process. A series of research papers and discussion with geological experts from various agencies supports the reliability of information. Five parameters were identified for sinkhole development in Malaysia namely bedrock lithology, soil type, water table decline, proximity to groundwater and land use (Table 1). The main source of primary data is by interviews with experts and some literature reviews from previous study. Geologist from local geotechnical engineering agencies was identified to acquire his judgment for relative weightage and some recommendations. Expert opinion is crucial because AHP technique is considered as heuristic method which is used expert judging concept that reduces the search activity in solving problem process.
Digital lithology and soil map acquired from Mineral and Geoscience Department considered as the main source. The topography of the area is analyzed using digital topographic map obtained from Department of Survey and Mapping Malaysia (JUPEM) and being extracted for the land use information. Groundwater level also was obtained from Mineral and Geoscience Department that includes groundwater well locations as well. For data validation, the sinkhole inventory data compiled by Mineral and Geoscience Department also being collected.
Figure 2. Location of the research area
SELANGOR
KUALA LUMPUR
AMPANG
Sinkholes
KUALA LUMPUR
The International Archives of the Photogrammetry, Remote Sensing and Spatial Information Sciences, Volume XLII-4/W5, 2017 GGT 2017, 4 October 2017, Kuala Lumpur, Malaysia
This contribution has been peer-reviewed.
Criteria Unit
Lithology Type
Soil properties Type
Groundwater level decline Meter Cubed (m3)
Land Use Type
Proximity to groundwater well Meter
Table 1. Sinkhole criteria used and unit
2.3 Multi-criteria Decision Making Techniques (MCDM)
In the globalization era, solving problem becomes a difficult process when it required good decision to be made. It involves many procedures and parameters need to be concern in order to make a wise decision. Decision analysis is a set of systematic procedures for analyzing complex decision problems (Malczewski, 1999). A frequently applied approach is to decompose the problem into smaller, understandable parts that express relevant concerns (Alkema & Boerboom, 2012). The interpretation of an indicator as to whether its the researchers to achieve their objectives goal. Ranking method, rating method, pairwise comparison method and AHP method are the suitable method that can be used to the researchers to study the disaster of sinkhole formation.
Integration of GIS and MCDM has been applied by different researchers in identifying sinkholes hazard area. The approach used is depending on the main goal of the study followed with the suitability of the region. There are several methods typically used locally and internationally are defined as heuristic, statistic and deterministic (Othman, et al., 2012).
Research by (Kouri, et al., 2013) used statistical method associated with GIS and remote sensing data to produce sinkholes hazard map in Kinta Valley, Perak. Eight causative parameters were used namely lithology, structure (lineament), soil cover, slope, land use mining, urban area features, ponds and rivers. Every parameter was calculated based on sinkhole location and a spatial database. Other paper by (Taheri, et al., 2015) using analytical hierarchy process (AHP) to determine sinkhole susceptibility map in Hamadan province, Iran. It combine with GIS environment considering eight causal factors namely distance to faults, water level decline, groundwater exploitation, penetration of deep wells into karst bedrock, distance to deep wells, groundwater alkalinity, bedrock lithology and alluvium thickness.
Therefore, the method illustrated in this research is the first contribution which explores the practicality of the AHP technique to determine potential sinkhole hazard area under DBKL and MPAJ administration. Based on literature reviews, the weightage of criteria is determined by AHP through normalized pairwise comparison matrix and linear scale transformation is used to calculate weight for sub-criteria. Thus, the result can be modelled by multiple linear regressions to map the sinkhole hazard zonation in the mention area.
2.4 Data Pre – Processing and Processing
All spatial and attribute data were processed throughout map digitizing, editing and conversion by using ArcGIS 10.1 software. The list of attributes weight of criteria and sub criteria are entered in the spatial data to classify the values. AHP and linear scale transformation techniques are used in this research to determine value of relative weight for criteria and sub criteria. The value of each criteria and sub criteria are derived from interviews and discussions with geologist expertise. The result of the weight is used to generate multiple linear regression models in order to produce sinkhole susceptibility hazard maps.
In this research, model development has been preliminary assessed considering relative weights assigned to five selected controlling factors (criteria) and to different classes of each one (sub criteria). A set of criteria have been weighted performing pairwise comparison matrices can be referred on Table 2. An important step of the AHP is to preference matrix and n is the number of parameters. For the calculation of the consistency ratio (CR), the consistency index is compared with a random consistency index (RI):
CR =
The RI values have been tabulated by Saaty (1980). Consistency ratios higher than 0.1 suggest untrustworthy judgments, indicating that the comparisons and scores should be revised.
The development of model is mainly based on the final weight of criteria and subcriteria of the parameters. The expert judgment is represented in the series of mathematical models. In this research scope, multiple linear regression models are used to generate series of map of potential sinkholes hazard area. This model is named as Sinkhole Hazard Model (SHM) and consists of five (5) criteria which represented as follows: criterion, sc_wld is standardized score for water level decline sub criterion and sc_pg is standardized score for proximity to groundwater sub criterion.
The potential sinkholes hazard zone has been initially evaluated considering the relative weights applied to five selected controlling parameters (criteria) and to different classification (sub-criteria). The pairwise comparison matrices in Table 2 are constructed to determine relative importance of each parameter for sinkhole development with respect to another one.
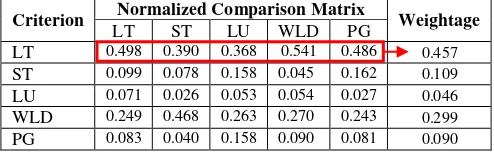
Table 2. Pairwise comparison matrix of criteria
In Table 2, the relative scales factors have been entered by expert represent each variable involved. The variable comparisons are done in matrices form in order to enhance the weight computation process of potential sinkhole hazard. Prior to weightage calculation, every scale factor on each criterion must be converted into fraction in order to obtain the total column value for every cell. Then, the total scale factor is computed vertically by using this formula:
∑ = C1 + C2 + C3 + ⋯+ C8 eigenvector normalization process. The process is accomplished by averaging each normalized matrix by the sum of elements in the row. The same way goes to the other relative weight for criteria. Based on Table 3, the result of normalization weight, it can be determined that lithology has largest weight value 0.457, while landuse produces a smallest weight value 0.046.
Criterion Normalized Comparison Matrix Weightage
LT ST LU WLD PG
Table 3. Relative weightage value of each main criterion
The weightage of sub-criteria is derived by using linear scale transformation. Linear scale transformation is the most frequently used GIS based method from transforming input (subcriteria scores) data into subcriteria maps. The scale for the score is not fixed but depends on the nth value of the subcriteria in one parameters. Then, the weight is obtain from normalize the scores by dividing it with the total scores. The range score starts from 0 for the minimum value.
Generally, the total normalize weight must be 1. For example, soil type has five classes namely alluvium, steepland, sandy clay, clay loam and sand (mined land). The relative score for these five classes is 0, 1, 2, 3 and 4. Then, the standardized score must be computed by dividing the each relative score with the sum of all scores in the consecutive columns.
3. RESULTS AND ANALYSIS
3.1 Sinkhole Susceptibility Hazard Zonation Map
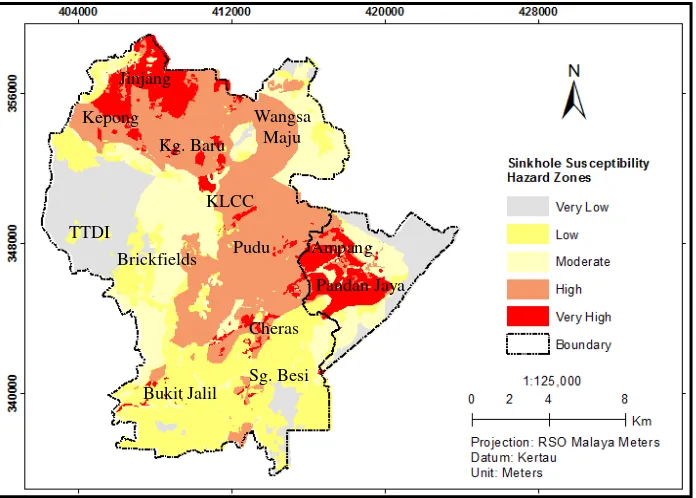
The sinkhole susceptibility hazard zonation maps generated from the SHM model is shown in Figure 4. The resulting maps data have been classified into five prone levels as: very low, low, moderate, high and very high risk. The result from this model have shown that the very low (Class 1), low Limestone Formation bedrock geology consisting limestone/marble and acid intrusive (undifferentiated) lithology (Taheri, et al., 2015). In this study area, most of sinkhole hazard occurred at the high value of water level decline which is -22 to -70 cubic meter of approximate yield. Furthermore, the alluvium type of soil can be considered as unsafe in some area. Besides, most of susceptible zones are covered by mining and urbanized land use. The sprawl of commercial and residential building in this location was erected on the ex – mined land which comprise of sands and clay properties. Meanwhile, for Ampang area, the relatively high and very high hazard falls at the center and western of the district. It covers the major part of Ampang city bounded by Kuala Lumpur territory. Most of the factors triggered are same with Kuala Lumpur as stated earlier. High dense urban areas plus surrounded by mined land vicinity can be classified identical with Kuala Lumpur.
3.2 Validation and Accuracy Assessment
In order to determine the accuracy of the sinkhole hazard map, this study was evaluated by overlying the previous sinkhole inventory data provided by The Malaysian Mineral and Geoscience Department. The totals of thirty three (33) location of previous sinkhole in Kuala Lumpur and Ampang have found located in the appropriate potential hazard classes. To validate the Sinkhole Hazard Model (SHM), the important classes that should be included are high and very high potential locations. Twenty (20) location of the tabulate data fall within high hazard areas and five locations are located in very high susceptible areas.
Table 4. Accuracy percentage of the model
Hazard The International Archives of the Photogrammetry, Remote Sensing and Spatial Information Sciences, Volume XLII-4/W5, 2017
GGT 2017, 4 October 2017, Kuala Lumpur, Malaysia
This contribution has been peer-reviewed.
Main Weight X
Sub criteria Weight = Weighted Map
Sinkhole Susceptibility Mapping
Lithology
Proximity to
Ground Water
Soil Type
Land Use
Water Level
Decline
Granite
Kenny Hill
Schist
Hawthorndern
KL Limestone
M
a
in Cr
it
er
ia
Sandy Clay
Clay Loam
Steepland
Alluvium
Sand (Mined)
Cleared Land
Urban
Mined
Grass
Forest
(-70) - (-46)
(-45) - (-31)
(-30) - (-21)
(-20) - (-12)
(-11) - (-1)
1000
5000
10000
15000
20000
Su
b Cr
it
er
ia
SSM
Multiple Linear Regressions
Model
Figure 3. Flow diagram form a basis for constructing sinkhole susceptibility map
GIS
Archives of the Photogrammetry, Remote Sensing
and Spatial Information Sciences, Volume XLII-4/W5,
2017
GGT
2017, 4 October 2017, Kuala Lumpur, Malaysia
This contribution
has been peer-reviewed.
https://doi.org/10.5194/isprs-archives-XLII-4-W5-145-2017
| © Authors 2017. CC BY 4.0 License.
The hazard map shows in Figure 4 represents the potential sinkhole areas generated by model while Figure 5 represents the actual places of sinkhole cases and the potential sinkhole areas generated by model. From the result, it shows that
accuracy of the model is 76% refer to the high and very high class while the remaining 24% fall within low and moderate class. Table 4 depicts the percentage of sinkhole based on actual previous data that had existed before.
Figure 4. Sinkhole susceptibility hazard zones map
Figure 5. Sinkhole susceptibility map of the study area and location of the previous sinkhole
4. CONCLUSION AND DISCUSSION
Sinkhole hazard has increased dramatically since 1968 in Kuala Lumpur and Ampang areas. Rapid development of these areas has had some impacts that are destructive to the environment. Sinkhole can be classified as dangerous natural
hazard that hard to predict when and where it will occur. However, sinkhole can be systematically managed even though cannot be completely prevented. The severity of impacts from sinkhole hazard can be minimized if the hazard zones can be predicted and mapped before any development activity takes place. Thus, accurate model need to be develop KLCC
Bukit Jalil Jinjang
Brickfields
Sg. Besi Pudu
Kepong Wangsa
Maju
Cheras
Ampang Pandan Jaya TTDI
Kg. Baru
The International Archives of the Photogrammetry, Remote Sensing and Spatial Information Sciences, Volume XLII-4/W5, 2017 GGT 2017, 4 October 2017, Kuala Lumpur, Malaysia
This contribution has been peer-reviewed.
in order to produce reliable hazard maps. The model presented in this work has been constructed by integration of GIS and AHP approach. Results from this research can be used by the local authority to manage properly, systematically and plan development within their areas.
As the limitations of the study in order to improve this paper for the others researcher in the future, it suggests to use the others suitable techniques to detect the sinkhole phenomenon rather than AHP technique. Further study might be explore at the other different approach in multi-criteria decision making analysis such as Ranking, Rating, Fuzzy AHP or Weight of Evidence (WoE) method. Some suggestions could be also made for further study regarding of the triggering effect of the sinkhole incident. High resolution satellite images also might be used to obtain the latest land use and land cover classification of the areas for better time series. In addition, some limitations in this study of the model are partially correlated to the difficulty of acquiring data on some geological circumstances.
Another recommended technique that useful in predicted sinkhole hazard is the computation of the magnitude and frequency relationship. From the inventory data, the size and diameter of the sinkhole is recorded for estimation the possible sinkhole to occur in a year. This information is very crucial for local authority for planning and managing natural hazard in Malaysia.
ACKNOWLEDGEMENT
Special thanks to Kementerian Pengajian Tinggi Malaysia (KPT) for the monetary fund under the research grant (FRGS/1/2016/WAB05/UITM/02/7), Dewan Bandaraya Kuala Lumpur (DBKL) and Department of Mineral and Geoscience for the data and expert opinion.
REFERENCES
Abidin, R. Z., Jamalludin, D., & Arshad, M. F. (2002). Sinkhole Physical Properties And Its Failure Risk
Assessment. Shah Alam, Selangor: Institute of Research,
Development And Commercialisation UiTM.
Eisernberger, I. (1964). Genesis of Bimodal Distribution.
Technometrics, 357-363.
Harries, K. (1999). Mapping Crime: Principle and Practice. Washington DC: U.S. Department of Justice Office of Justice Programs.
Kong, T. B., & Komoo, I. (1990). Urban Geology: Case Study of Kuala Lumpur, Malaysia. Engineering Geology, 71-94.
Kouri, O. A., Fugara, A. A., Rawashdeh, S. A., Sadoun , B., & Pradhan, B. (2013). Geospatial Modeling for Sinkhole Hazard Map Based on GIS & RS Data. Journal of
Geographic Information System, 584-592.
Malczewski, J. (1999). GIS and Multicriteria Decision
Analysis. New york: John Wiley & Sons.
Meng, T. S. (2005). Karstic Features of Kuala Lumpur Limestone. Geological Society of Malaysia, Bulletin 46, 447-453.
Saaty, T. L. (1980). The analytic hierarchy process. New York: McGraw-Hill.
Taheri, K., Gutierrez, F., Mohseni, H., Raeisi, E., & Taheri, M. (2015). Sinkhole susceptibility mapping using the analytical hierrarchy process(AHP) and magnitude -frequency realtiobships: A case study in Hamadan province Iran. Geomorphology, 64-79.