DETERMINATION OF Zn COMPOSITION OF
α
-BRASS USING
DIFFRACTION METHOD: A COMPARISON WITH VEGARD’S LAW
Tri Hardi PP
Center for Technology of Nuclear Industry Materials. BATAN Puspiptek, Serpong, Tangerang 15314, Indonesia
P
2
P
Center for Industrial Technology Process, BPPT, Jln. M.H. Thamrin, Jakarta, Indonesia e-mail: 7TUU[email protected]U7TU
ABSTRACT
For a single phase binary alloy such as α brass, it is also possible to determine the alloy composition by measuring the lattice parameter of the crystal structure. This technique makes use of Vegard’s law, which states that the lattice parameter of a single phase binary alloys varies linearly with the addition of the solute element. By the use of the neutron diffraction and x-ray diffraction methods, lattice parameters of α-brass were calculated. Neutron diffraction data was obtained by using DN2 neutron diffractometer, and the lattice parameter ao=3.6782± 0.0006Å is obtained with a reliability factor of Rwp =19.33%, and the measured density is 4.8197 gr/cm3. From X-ray diffraction, the lattice parameter ao=3.6782 ± 0.0005 Å with Rwp= 27.78% is obtained. Diffraction data was analyzed using the MAUD application package software. From the lattice parameters and by the use of Vegard’s law the % weight of Zn composition obtained from neutron and x-ray diffraction turns out to be the same and is equal to 32.35%. Chemical composition measurement shows that the % weight of Zn composition for Al weight > 0.03% is 30.18515 %. Maximum deviation of the Zn % weight calculated from lattice parameter values and the chemical composition measurement is less than 10%.
Keywords : α-brass, neutron diffraction, Vegard’s law, MAUD
INTRODUCTION
138
Some applications of Vegard law was used for a single phase binary alloy such as α brass. Values of lattice parameter versus composition for the Cu/Zn system were found and are reported in the literature [2]. The Vegard’s Law is also applied in the investigation of split interstitial defect of N-N split in GaAs1-xNx alloys[3], band gap bowing parameter of zinc
blende InxGa1-x N [4].
By using the neutron diffraction- and x-ray diffraction method lattice parameters of α -brass with fcc crystal structure, space group Fm3m were calculated. Applications of a density-functional theory of nonuniform fluid mixtures to the fluid-solid transition of simple binary mixtures of hard spheres demonstrates the importance of relative atomic sizes in determining the lattice constants and suggests that for sufficiently small disparities in atomic size, Vegard's law may also hold along the fluid-solid coexistence curve[5].
The aim of this paper is to determine % weight Zn using diffraction method with Vegard’s law as a tool to convert from lattice parameter to % weight Zn. The result is then compared with the result obtained from chemical composition measurement.
Determination of Composition by Vegard’s Law
Vegard's law is an approximate empirical rule which holds that at constant temperature a linear relation exists between the crystal lattice constant of an alloy and the concentrations of the constituent elements. It is applied for determination of composition of binary and ternary compounds. For binary compounds, consider two elements A and B and its alloy AxB1-x, where x is alloy composition or alloy mole fraction, Assume that A has
lattice constant aA and B has lattice constant aB, then the lattice constant of the alloy is given by :
This equation is called Vegard’s law. For ternary compound, assuming that the lattice constants of the ternary compounds can be expressed as a linear combination of the lattice constants of the two forming binary compounds, and the physical properties of the ternary compounds are usually investigated based on Vegard’s law.
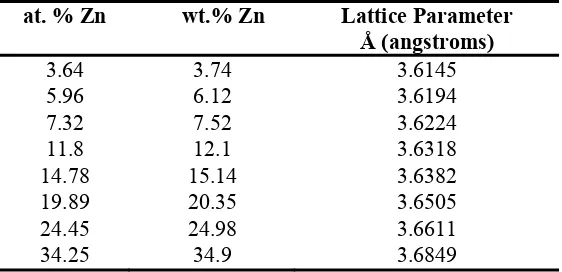
For a single phase binary alloy such as α brass, it is also possible to determine the alloy composition from the lattice parameter. Values of lattice parameter versus composition for the Cu/Zn system were found in the literature and are reported in Table 1. Vegard’s Law is strictly applicable to composition by atomic percent, however since the atomic weights of Cu and Zn are close, the difference between atomic and weight percent is negligible. Weight percent is reported in this study for comparison to conventional composition reporting style in the literature.[2]
Table 1: Brass lattice parameters and composition
139 The values in Table 1 have been plotted and a linear fit line applied as seen in Figure 1. In this figure, the lattice parameter has been converted to the d-spacing for the (111) plane of the α brass standards
2 2 2
l k h
a dhkl
(2)
where a is the lattice parameter, h, k, and l are the Miller indices of the plane and dhkl is the d
-spacing for the plane.
Figure 1: (up) Relation between weight% Zn and lattice parameter converted from d111 spacing, and
(bottom) The copper-zinc phase diagram
140
the literature which act as standard values for the Vegard’s Law analysis. In this study the (111) peak was chosen because it is the most intense peak in the diffraction patterns. The equation fitted to the data of Figure 1(a) can then be used to solve for the Zn composition of the sample as:
wt. % alpha = 443.1 d(111) - 1597 (3)
where wt.% alpha is the Zn composition (wt.%) of the sample, and d111 is the d-spacing (in
angstroms) of the (111) index measured by XRD and neutron diffraction. The error in the w_alpha values is of the order of 4 wt. % due to the extreme sensitivity of the composition to the lattice parameter measurement. It is important to clarify that compositional analysis by Vegard’s law is only pertinent to the α-brass. Figure 1(b) shows the phase diagram of Cu-Zn. EXPERIMENTAL METHOD
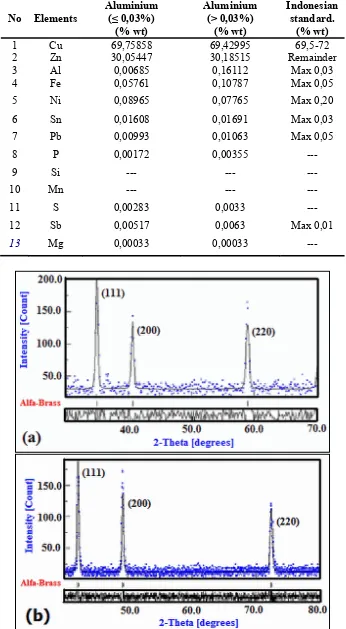
Utilization of both the neutron diffraction and x-ray diffraction methods, lattice parameter of
α-brass with fcc crystal structure with space group Fm3m were calculated. Neutron diffraction data of α-brass was obtained by using Texture-Diffractometer (DN2) at neutron wavelength of 1.2793Å obtained from bent Si(311) monochromator. The Bragg peaks of diffraction pattern were fitted using a Materials Analysis Using Diffraction (MAUD) software package, giving the indices of (h k l) plane, peak location, error, and full-width at half-maximum (FWHM) and Rwp of the diffraction pattern. Once the diffraction patterns have been indexed, it is a simple task to solve for the α brass phase. The α brass (111) peak was chosen for the measurement of zinc composition because it has the highest intensity of the three α brass peaks present in the data. Then from d-spacing of the (111) plane and by using the vegard’s law chart shown in Figure 1, the zinc composition can be determined.
RESULTS AND DISCUSSION
a. Chemical composition
Based on the chemical composition of the two Brass samples, the main constituent elements of brass such as Cu, Zn, Ni and Fe are already in compliance with the industrial standard specifications. However aluminium has two kind of weight composition, the first is 0,00685% and the second is 0,16112% which are indexed as being under and above the standard composition of 0.03%, respectively. As shown in Table 2. Aluminium is known as a precursor for the β phase formation in brass alloys having BCC crystal structure. Addition of 1% aluminium is equivalent to an addition of 6% zinc. So that aluminium with a 0.16112% weight composition differs by only 0.13112% from the standard composition of 0.03%. In this case, only an additional 0,007867% of zinc is needed to raise the weight composition from 30,18515% to 30,19302%, and it is still far removed from the 33.6% maximum range of
α-brass. It is still in the α-phase.
b. Neutron and X-ray diffraction.
141 Table 2: Chemical composition of -brass.
No Elements
Aluminium (≤ 0,03%)
(% wt)
Aluminium (> 0,03%)
(% wt)
Indonesian standard.
(% wt)
1 Cu 69,75858 69,42995 69,5-72
2 Zn 30,05447 30,18515 Remainder
3 Al 0,00685 0,16112 Max 0,03
4 Fe 0,05761 0,10787 Max 0,05
5 Ni 0,08965 0,07765 Max 0,20
6 Sn 0,01608 0,01691 Max 0,03
7 Pb 0,00993 0,01063 Max 0,05
8 P 0,00172 0,00355 ---
9 Si --- --- ---
10 Mn --- --- ---
11 S 0,00283 0,0033 ---
12 Sb 0,00517 0,0063 Max 0,01
13 Mg 0,00033 0,00033 ---
142
CONCLUSION
In conclusion, the authors have shown that Vegard’s law can be used to determine the % weight of Zn. Comparison between the neutron diffraction and x-ray diffraction methods and the chemical composition measurement, has shown that by using the lattice parameter values and by the use of Vegard’s law, the %weight of Zn composition obtained from both the neutron and x-ray diffraction are the same, and is equal to 32.35%,. Chemical composition measurement shows that %weight of Zn composition for Al>0.03% weight is 30.18515%. Even though the % weight of Zn calculated from the diffraction method data is larger than the value obtained from the chemical composition measurement, it is still in the range of -brass with a deviation of less than 10%
REFERENCES
[1] K. T. Jacob, Shubhra Raj, L. Rannesh, Vegard’s law: a fundamental relation or an approximation ? Department of Materials Engineering, Indian Institute of Science Bangalore, India, (2007)
[2] W. B. Pearson, Handbook of Lattice Spacing and Structures of Metals , Pergamon, New York, Vol. I, (1964), 620.
[3] Pierre Carrier, Su-Huai Wei, S. B. Zhang, and Sarah Kurtz, Physical Review B, 71, (2005), 165212
[4] Yen-Kuang Kuo, Bo-Ting Liou, Sheng-Horng Yen, Han-Yi Chu, Optics Communications 237, (2004) 363–369
[5] Denton, A. R.; Ashcroft, N. W.,. Physical Review A, 43, Issue 6, March 15, (1991)., pp.3161-3164