Jurnal Sains Materi Indonesia
Indonesian Journal of Materials Science ISSN : 1411-1098
INTRODUCTION
Quantitative phase analysis can be used to measure not only the type of compounds but also the amount of compounds present in a solid or powder system. Diffraction analysis has advantages over ordinary chemical analysis in that the diffraction method will reveal the presence of compounds whereas chemical analysis can only provide elemental information. Quantitative phase analysis can be used for plasma spray
process development and quality control testing of coatings. Quantitative analysis can be used to determine trace silica in ceramics and minerals, and provide quality control of both of austenite content in heat-treated steel components, and martensite content in mechanically-treated as it reported previously [1]. The method is applied to study of a series of cold-rolled 304 stainless steel plates. The fraction of martensite on the surface Akreditasi LIPI Nomor : 452/D/2010 Tanggal 6 Mei 2010
QUANTITATIVE PHASE ANALYSIS OF THE ZrNbMoGe
ALLOYS USING NEUTRON DIFFRACTION TECHNIQUES
Parikin, A. Fajar, A. Insani, A. H. Ismoyo and B. Bandriyana
Center for Nuclear Industry MaterialsTechnology (PTBIN)-BATANKawasan Puspiptek Serpong 15314, Tangerang e-mail: [email protected]
ABSTRACT
QUANTITATIVE PHASE ANALYSIS OF THE ZrNbMoGe ALLOYS USING NEUTRON
DIFFRACTION TECHNIQUES.Quantitative analysis by neutron diffraction technique can be utilized to
measure not only the type of compounds but also the amount of compounds present in a solid or powder system. The technique has been proven for a composition analysis due to offering some advantages particularly for elements with very similar atomic numbers, and for their high penetrating power. A quantitative phase analysis experiment by using neutron diffraction has recently been carried out to determine the amount present of phases in ZrNbMoGe system. The data analysis was obtained by Rietveld refinement method. The result shows that the profiles have a very good fitting (Rwp = 12.62 %, 15.45 % and 16.39 %) with the number of reliable factor among 1.0 and 2.0. The phases of Zr, ZrMo2, Zr3Ge and ZrGe are identified in the specimens. The ZG1 specimen contains of 94.19 %wt of Zr phase, 2.05 %wt of ZrMo2phase, 3.15 %wt of Zr3Ge and 0.59 %wt of ZrGe phase. Whereas the ZG2 specimen comprises of: 84.45 %wt of Zr phase, 4.16 %wt of ZrMo2phase, 10.18 %wt of Zr3Ge and 1.20 %wt of ZrGe phase. The volume fraction of the minor phases on specimens shows an increase as addition in Ge content.
Keywords: ZrNbMoGe alloys, Rietveld method, Neutron diffraction
ABSTRAK
ANALISIS KUANTITATIF FASA PADUAN ZrNbMoGe MENGGUNAKAN TEKNIK DIFRAKSI
NEUTRON. Analisis kuantitatif dengan teknik difraksi dapat digunakan untuk mengukur tidak hanya tipe
senyawa tapi juga sejumlah senyawa yang ada dalam sebuah sistem padatan atau serbuk. Teknik ini telah teruji untuk analisis komposisi bahan karena menawarkan beberapa keuntungan tertentu; khususnya pada unsur-unsur dengan nomor atom berdekatan, dan neutron memiliki daya tembus yang tinggi. Percobaan analisis kuantitatif fasa menggunakan teknik difraksi neutron baru-baru ini telah diterapkan untuk menentukan sejumlah fasa yang ada dalam sistem ZrNbMoGe. Analisis data diperoleh dengan menggunakan metode penghalusan Rietveld. Hasil memperlihatkan bahwa profil penghalusan memiliki parameter fitting yang sangat bagus (Rwp= 12,62 %, 15,45 % dan 16,39 %) dengan nilai faktor kepercayaan berkisar antara 1,0 dan 2,0. Fasa-fasa Zr, ZrMo2, Zr3Ge dan ZrGe teridentifikasi dalam spesimen. Spesimen ZG1 mengandung: 94,19 %berat fasa Zr; 2,05 %berat fasa ZrMo2 phase; 3,15 %berat fasa Zr3Ge dan 0,59 %berat fasa ZrGe. Sementara spesimen ZG2mengandung 84,45 %berat fasa Zr; 4,16 %berat fasa ZrMo2; 10,18 %berat fasa Zr3Ge dan 1,20 %berat fasa ZrGe. Fraksi volume fasa minor dalam spesimen memperlihatkan peningkatan saat kandungan unsur Ge bertambah.
shows an increase as addition in percentage reduction of cold rolling.
The Rietveld method is capable of handling powder diffraction data obtained from X-ray or Neutron diffractometer [2]. In the Rietveld method the least square refinements are carried out until the best fit is obtained between the entire observed (powder) diffraction pattern taken as a whole and the entire calculated pattern based on the simultaneously refined models. Diffraction optic effects [3], instrumental factors, background and other specimen characteristics (e.g. lattice parameters) as may be desired and the peak shape of patterns can be modelled. A key feature is the feedback, during refinement, between improving knowledge of structure and improving allocation of observed intensity to partially overlapping individual Bragg reflections.
The aim of this study is to calculate the quantity of each phase containing in ZrNbMoGe alloys that had been synthesized with various Ge contents by using Rietveld refinement method.
EXPERIMENTAL METHODS
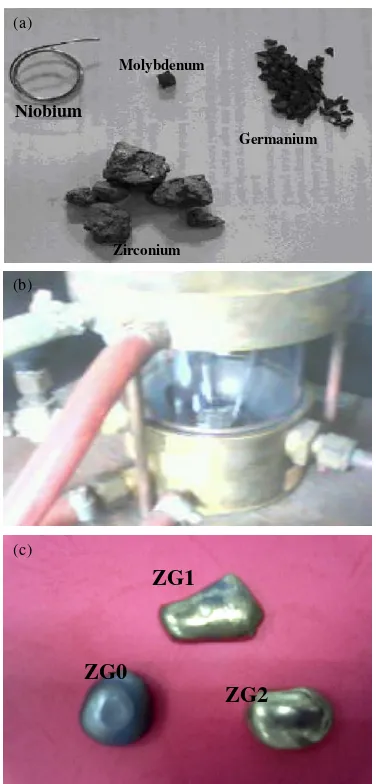
Synthesis of zirconium alloy was carried out by melting the elements of zirconium (Zr sponge), niobium (Nb wire), molybdenum (Mo flake) and germanium (Ge flake), using single arc melting furnace under the argon atmosphere with the temperature more than the melting point of zirconium (1850oC) [4]. The weight
percentage of the elements of the ingot being made was listed in Table 1. All of these elements were melted into the copper crucible which equipped with water coolant. By using tungsten electrode, with argon capacity of 5 liters/minute and electric current of 150 Ampere, the elements were burned and melted. After that, the ingots were directly cooled into atmospheric condition to obtain the ingots of zirconium alloy. Figure 1 illustrates the experimental steps of the fabrication (a) raw of materials, (b) single arc melting furnace and (c) the ZrNbMoGe ingot.
Table 1 shows the compositions of the samples, which have been synthesized in the experiment. Three samples were characterized by high resolution powder diffractometer (HRPD) in neutron scattering laboratory (BSN) PTBIN BATAN to obtain the profiles. The instrument has a wave length of 1.8195 Angstrom, which can penetrate deeply into the materials until equal less than 4 cm [5]. The neutron diffraction patterns were
obtained in the range of θ - 2θ geometry with a very
good result in peak to background ratio. Measurements were performed with step of 0.05 degree in the range of
2θ from 2.5 to 100 degree. In the previous work the X-ray
diffractograms were obtained as initial study to identify the phases in the samples [6].
RESULTS AND DISCUSSION
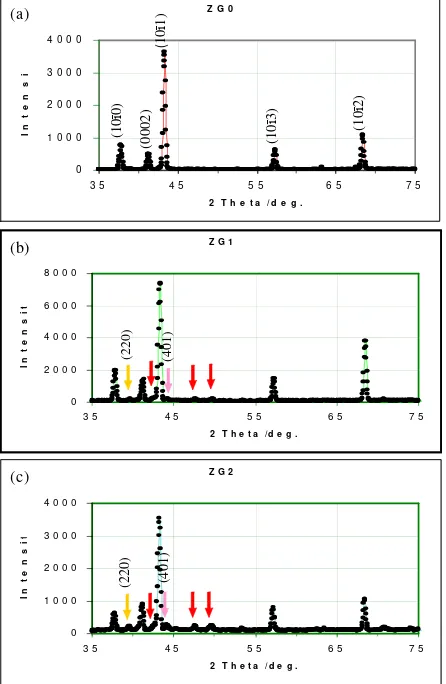
Figure 2 shows the neutron diffraction pattern of pure zirconium and its alloy (ZrNbMoGe), obtained by using Neutron Diffractometer (= 1.8195Å); (a) ZG0; Pure Zirconium, (b) ZG1; Zircalloy (1 %wt Ge) and (c) ZG2; Zircalloy (3 %wt Ge). The scanning was taken from the angle of 2= 35to 75, step width of 0.05and scan mode step counting. The pattern shows good enough in peak to background ratio and all peaks are seen clearly. Figure 2(a) shows that the first five peaks of hexagonal closed packed zirconium arise between the angle of 2= 35and 2= 75. Firstly, the peak of (10ī0) plane is
on the angle of 2= 37.92, then, second peak at the angle of 2= 41.41is (0002) plane and the highest peaks of zirconium appearing at the angle of 2= 43.42is
(10ī1) plane. Two peaks arise behind them are (10ī3) and
(10ī2) planes at the angle of 2= 57.39and 2= 68.50
respectively.
Figure 1.(a). Raw materials, (b). Single Arc Melting Furnace and ( c). Pure Zr and ZrNbMoGe ingot.
Zirconium
Table 1.Chemical compositions of the sample.
Composition of the Elements (%wt) Sample
Zr Nb Mo Ge
ZG0 100 - -
-ZG1 97,0 1,0 1,0 1,0
Jurnal Sains Materi Indonesia
Indonesian Journal of Materials Science ISSN : 1411-1098
Mean while, there are some peaks grown in between those principal peaks of pure zirconium in Figure 2(b) and 2(c), while the Ge element was added to the intermetallic system of ZrNbMoGe. The red arrows identify the peaks rising in two diffraction profiles bellow.
The peaks belong to ZrMo2, ZrGe and Zr3Ge phase. Previously we reported that these precipitate arose while the temperature regularly goes down to room temperature [6]. This can also be explained from the phase diagrams in literature [7]. The precipitation formed at 1535oC to 895oC is the Zr
3Ge phase and the Zr2Ge
phase (which is not stable) with an orthorombic structure. So, while the composition of 95 %wt Zr and 2 %wt Ge combined, the precipitation formation was dominated by the Zr3Ge phase when other precipitates have not been yet formed. Meanwhile, the presence of 2 %wt Mo in the alloy contributes to the formation of the ZrMo2 precipitates with a body centered cubic lattice symmetry. Table 2 shows the d-spacing calculations resulting from X-ray and neutron diffraction. Both of them are very closed to the reference values of the d-spacing listed in last column. The d-spacing were calculated by utilizing Bragg formula: = 2d sin. Because of different wavelength of scattered beams, the
position of reflection peaks (2θ) in the diffraction pattern will shift neither to higher nor lower of 2θ angle. In this case, the 2θ shifting occurs because of utility of
wavelength in X-ray (1.5405Å) and neutron (1.8195 Å)
which can move diffraction angle to higher 2θ when
wavelength is bigger.
The structure data analysis was performed using the Rietveld Analysis (RIETAN), a Rietveld structure refinement program developed by F. Izumi [8], which is capable of handling powder diffraction data obtained with X-ray or Neutron. In Figure 3, the patterns of the refinement for ZG0, ZG1 and ZG2 specimens are shown. In the profiles, there are several marks of line broadening. The vertical lines below both patterns (raw and model) are indication of zirconium, ZrGe, Zr3Ge phase positions, whereas the line above residual pattern is position of ZrMo2 phase respectively. It can clearly be seen in Figure 2, from (220) and (401) reflections that the minor
Figure 2.HRPD’s profiles of: (a). ZG0; Pure Zirconium, (b). ZG1; Zircalloy (1%wt Ge) and ( c). ZG2; Zircalloy (3%wt Ge).
Table 2. The comparison of d-spacing calculation on the ZrNbMoGe, obtained from X-ray and neutron diffraction.
X-ray (=1.5405Å) Neutron (=1.8195 Å)
39.63 0.3418 2.6834 ZrGe(002) 2.68
39.70 0.3397 2.6782 ZrMo(220)2 2.67
33.60 0.2891 2.6638 Zr(002)3Ge 39.98 0.3418 2.6610 Zr(002)3Ge 2.66
34.30 0.2979 2.6111 ZrGe(210) 40.65 0.3475 2.6181 ZrGe(210) 2.62
34.90 0.2999 2.5676 (0002)Zr 41.30 0.3528 2.5787 (0002)Zr 2.57
35.50 0.3049 2.5255 ZrGe(102) 42.49 0.3625 2.5097 ZrGe(102) 2.52
36.55 0.3137 2.4554 (10ī1) Zr 43.34 0.3694 2.4628 (10ī1) Zr 2.46
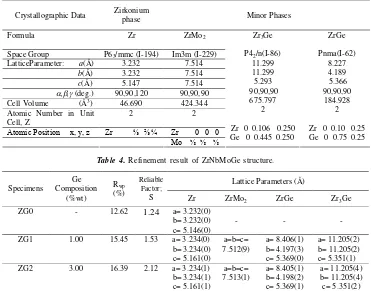
phase grows as an increase in the percent of Ge element. Since there was no evidence of minor phase in the diffraction patterns, the ZG0 specimen was assumed to be fully hexagonal crystal structure. The refinement was undertaken using a four-phase model consisting of the zirconium phase (hexagonal) with the space group P63/mmc (I-194), the ZrGe phase (orthorombic) with the space group Pnma (I-62), the Zr3Ge phase (tetragonal) with the space group P42/n (I-86) and the ZrMo2phase (cubic) using the body centred tetragonal with the space group Im3m (I-229). Initial lattice parameters are predicted in Table 3, which gives the initial refined crystal structure parameters for the specimens.
The peak shape profile of each phase was modelled separately using a pseudo-Voight function (a linear combination of a Gaussian and a Lorentzian function) [9]. The angular coverage of the experimental data was adequate to allow the structural parameters for each phase to be refined. These include lattice parameters, isotropic thermal parameters, zero point shifts, anisotropic (preferred orientation) parameters and profile parameters. The refinement of this four-phase model was satisfactory enough for each specimen, with theRwpranging from 12% to 16% (listed in Table 4). The lowerRwpcannot be obtained due to the insufficiently statistical data.
Table 5.Fraction of the Phases in ZrNbMoGe.
ZG0 (Rwp=12.62%) ZG1(Rwp=15.45%) ZG2(Rwp=16.39%)
Plane Counts(a.u.) Fractionof Phase
(%) Plane
ZrMo2(311) 2667 2.0548 ZrMo2(311) 5343 4.1656
ZrGe (002) 1293 ZrGe (002) 2553
ZrGe (211) 11 0.5997 ZrGe (211) 17 1.2026
Zr3Ge (401) 1202 Zr3Ge (401) 4235
Zr3Ge (202) 1036 3.1513 Zr3Ge (202) 3613 10.1846
Table 3.Initial parameters of the ZrNbMoGe structural refinement.
Crystallographic Data Zirkoniumphase Minor Phases
Formula Zr ZrMo2
Space Group P63/mmc (I-194) Im3m (I-229)
LatticeParameter: a(Å) 3.232 7.514
b(Å) 3.232 7.514
c(Å) 5.147 7.514
,,(deg.) 90,90,120 90,90,90
Cell Volume (Å3) 46.690 424.344
Atomic Number in Unit
Cell, Z 2 2
Table 4. Refinement result of ZrNbMoGe structure.
Lattice Parameters (Å)
ZG1 1.00 15.45 1.53 a= 3.234(0)
b= 3.234(0) c= 5.161(0)
a=b=c=
7.512(9) b= 4.197(3)a= 8.406(1)
c= 5.369(0)
a= 11.205(2) b= 11.205(2) c= 5.351(1)
ZG2 3.00 16.39 2.12 a= 3.234(1)
b= 3.234(1) c= 5.161(1)
a=b=c=
7.513(1) b= 4.198(2)a= 8.405(1)
c= 5.369(1)
Jurnal Sains Materi Indonesia
Indonesian Journal of Materials Science ISSN : 1411-1098
The refined lattice and profile parameters for both the minor phases vary little from specimen to specimen. In addition, reasonable thermal parameters were also obtained from the refinement, which have positive value. A complete set of refined structural parameters was read from data base in the RIETAN software [8]. The data profiles have been calculated by using Rietveld refinements programme successfully and running well. Figure 3 shows the refined structural patterns with the residual appearances that indicate the fitted profiles (model) with the experimental data for three of the specimens; ZG0, ZG1 and ZG2.
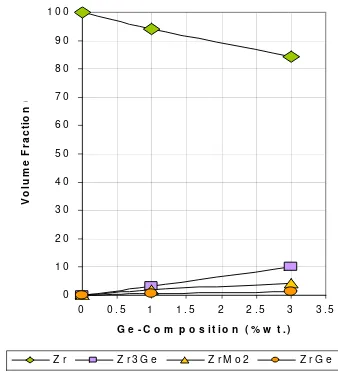
A summary of refined lattice parameters,Rwp, and reliable factors is given in Table 4. Meanwhile, Table 5 listed volume fraction of the phases. Figure 4 also illustrated the minor phase growth, predicted by Rietveld refinement analysis. The minor phase fraction can be calculated from scale factor of each phase, using a relation Wm=(SZV)m/
iSiZiVi, where S, Z, and V are the
scale factor, number of formula per unit cell and unit cell volume, respectively. Whereas subscribe m indicate minor phase and i for the phase content in the specimens. The fraction of minor phases on the specimens shows an increase as addition in Ge content. As the phase diagrams predicted above, the proof that Zr3Ge phase dominated in the precipitation formation is shown in the graph below. The phase rises of about 3% to of about 10% volume fraction while the Ge content increase from 1%wt to 3%wt in the alloys. Otherwise, the zirconium phase regularly decreases from about 94% to of about 84% volume fraction as rising of Ge composition from 1%wt to 3%wt in the alloys.
CONCLUSIONS
It can be concluded that the crystal structure of ZrNbMoGe alloy consists of structure of pure zirconium i.e. hexagonal closed pack (hcp) with lattice parameters ofa= 3.23Å,b= 3.23Å andc= 5.14Å, and the structure of ZrMo2i.e. body centered cubic (bcc) with lattice parameters of a = b = c=7,59Å, and the structure of ZrGe i.e. orthorhombic with lattice parameters ofa= 7.07Å,b= 3.90Å andc= 5.39Å, and the structure of Zr3Ge i.e. tetragonal (bct) with lattice parameters of a= b = 11.205Å and c = 5.351Å. There is no significantly different information between X-ray and neutron scattering in analyzing the crystal structure of the materials.
The volume fraction of the minor phases on specimens shows an increase as addition in Ge content. The ZG1 specimen contains of: 94.19%wt of Zr phase, 2.05%wt of ZrMo2phase, 3.15%wt of Zr3Ge and 0.59%wt of ZrGe phase. Whereas the ZG2 specimen comprises of: 84.45%wt of Zr phase, 4.16%wt of ZrMo2phase, 10.18%wt of Zr3Ge and 1.20%wt of ZrGe phase. The data were valid enough due to the obtainedRwpand reliable factors from the refinements of the profiles.
Figure 3.Rietveld refinement profiles of: (a). ZG0; Pure Zirconium, (b). ZG1; Zircalloy (1%wt Ge) and ( c). ZG2; Zircalloy (3%wt Ge).
Figure 4.Fraction of the phases in ZG0; Pure Zirconium, ZG1; Zircalloy (1 %wt Ge) and ZG2; Zircalloy (3 %wt Ge).
ACKNOWLEDGEMENTS
The outhors would like to express thanks to Ir. Iman Kuntoro,APU., Prof. Dr. Rer. Nat. Evvy Kartini, Dr. Sudaryanto, M.Eng., Drs. Gunawan, M.Si., Ir. Djoko Hadi Prayitno, M.Eng., Imam Wahyono, S.ST., Heri Mugihardjo, A.Md., for their kindness and helpful. Also, the special thanks to Dr. Azis Khan Jahja for his helpful discussions.
REFERENCES
[1]. PARIKIN, P. KILLEN and A. RAFTERRY,Atom Indonesia,35(1) (2009)
[2]. LARSON, A.C. and R.B.VON DREELE,General Structure Analysis System, LANSCE, MS-H805, Los Alamos National Laboratory, Los Alamos, NM 87545, University of California, (1994)
[3]. KAELBLE, EMMETT F.,Handbook of X-Rays for Diffraction, Emission, Absorption, and Microscopy, Mc.Graw-Hill Book Company, New York, (1967)
[4]. A. H. ISMOYO, PARIKIN and B. BANDRIYANA, Jurnal Sains Materi Indonesia, 10 (2) (2009) 199-202
[5]. W. PRASUAD, dkk.,Pengukuran Tegangan Sisa Di Sekitar Daerah Heat Affected Zone Pada Bahan Baja, (1995)
[6]. PARIKIN,A. H. ISMOYO and B. BANDRIYANA, Majalah Ilmiah Pengkajian Industri, DTIRBR-BPPT,5(3) (2011)
[7]. J. P. GROS and J.F. WADIER, J. of Nuclear Materials,172(1990) 85-95
[8]. F. IZUMI, A Rietveld Refinement Program RIETAN-94 for Angle-Dispersive X-Ray and Neutron POwder Diffraction, NIRIM, Japan, (1994) [9]. R. J. HILLand C. J. HOWARD,J. Appl. Crystallogr.,