62
63
64
Nomor urut
:
Nama
:
Usia
:
PETUNJUK PENGISIAN SKALA
1.
Bacakan masing-masing pernyataan dengan jelas dan mintalah anak
untuk menjawab dengan sejujurnya tanpa dipengaruhi oleh siapapun.
2.
Skala ini bukan tes, sehingga tidak ada jawaban benar atau salah.
Semua jawaban adalah baik apabila sesuai dengan keadaan anak.
3.
Mintalah anak untuk memilih salah satu jawaban dari dua (2) pilihan
jawaban yang tersedia dan berilah tanda silang ( X ) pada pilihan
yang sesuai dengan jawaban anak.
4.
Pilihan jawaban yang tersedia adalah :
Y
:
YA
, apabila pernyataan
sesuai
dengan kondisi anak.
T
:
TIDAK
, apabila pernyataan
tidak sesuai
dengan kondisi
anak.
5.
Apabila anak mengganti jawaban, berilah tanda sama dengan (=)
pada jawaban sebelumnya, kemudian beri tanda silang ( X ) pada
jawaban lain yang sesuai dengan jawaban anak.
6.
Kerahasiaan jawaban akan dijaga.
7.
Terima kasih atas perhatian dan kerjasama Anda.
65
NO.
PERNYATAAN
PILIHAN
Y
T
1.
Ibu senang mengajari saya membaca.
2.
Ibu mengejek ketika saya tidak bisa membaca.
3.
Saya sering membaca buku bersama ibu di rumah.
4.
Ketika saya bertanya tentang arti bacaan, ibu diam saja.
5.
Ibu menjelaskan arti dari apa yang saya baca.
6.
Ibu jarang membelikan buku bacaan.
7.
Saya diberi hadiah karena bisa membaca.
8.
Ibu memaksa saya belajar membaca, padahal saya sudah
capek.
9.
Ibu sering mengajari saya membaca
10.
Ibu membiarkan saya bermain, ketika saya belajar membaca.
11.
Ibu sering memberi saya hadiah yang dapat dibaca (ada
tulisannya).
12.
Ibu tidak mau membantu ketika saya kesulitan membaca.
13.
Saya bermain tebak-tebakan kata bersama ibu.
14.
Ibu menolak membaca buku cerita bersama saya.
15.
Pujian ibu berikan ketika saya mau belajar membaca.
16.
Ibu marah ketika saya tidak dapat membaca kata yang sudah
diajarkan.
17.
Ibu tampak gembira ketika saya mau diajak belajar membaca.
18.
Ibu membandingkan saya dengan teman yang bisa membaca.
19.
Ibu sering mengajak saya membaca tulisan-tulisan yang ada di
TV atau di jalan.
20.
Ibu sering menjawab “tidak tahu” ketika saya menanyakan arti
bacaan.
21.
Ketika saya salah membaca, ibu memperbaiki.
22.
Ketika saya bertanya tentang suatu bacaan, ibu tidak
menanggapi.
23.
Karena saya mau belajar membaca, ibu lebih menyayangi saya.
24.
Ibu tidak punya waktu untuk mengajari saya membaca.
TERIMA KASIH ATAS PERHATIAN DAN KERJASAMA
66
67
ular
68
mobil
69
kumis
70
buah nanas
71
dua ekor jerapah
72
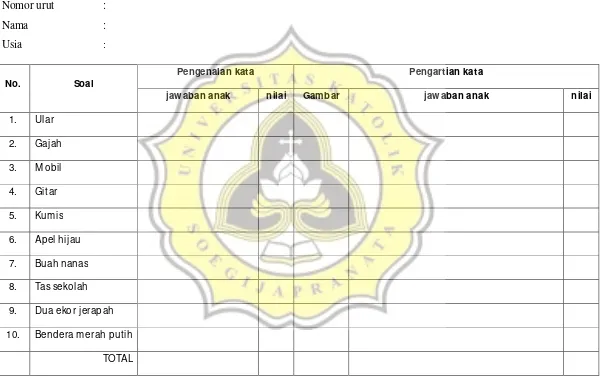
rater 1
Nomor urut
:
Nama
:
Usia
:No. Soal
Pengenalan kata Pengartian kata
jaw aban anak nilai Gambar jaw aban anak nilai
1. Ular 2. Gajah
3. M obil
4. Git ar 5. Kumis
6. Apel hijau
7. Buah nanas
8. Tas sekolah
9. Dua ekor jerapah
10. Bendera merah put ih
73
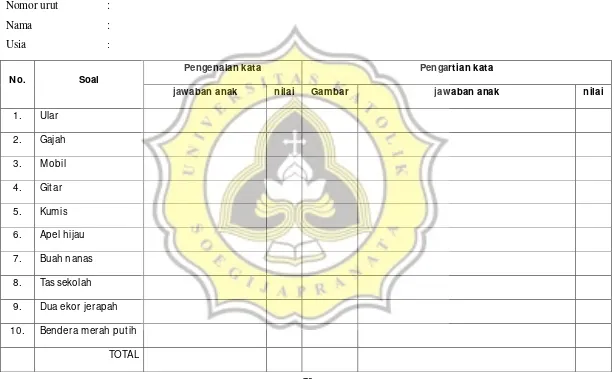
rater 2
Nomor urut
:
Nama
:
Usia
:No. Soal
Pengenalan kata Pengartian kata
jaw aban anak nilai Gambar jaw aban anak nilai
1. Ular
2. Gajah
3. M obil
4. Git ar
5. Kumis 6. Apel hijau
7. Buah nanas
8. Tas sekolah
9. Dua ekor jerapah
74
LAMPIRAN B
75
LAMPIRAN B-1
76
x1 x2 x3 x4 x5 x6 x7 x8 x9 x10 x11 x12 x13
1
2
2
2
2
2
1
2
2
2
1
1
2
1
2
2
2
1
2
2
2
2
2
2
1
1
2
2
3
2
1
2
2
2
2
2
2
2
1
1
2
2
4
2
2
2
2
2
2
2
2
2
1
1
2
2
5
2
1
1
1
1
2
2
2
2
1
1
1
1
6
2
1
2
2
2
2
2
1
2
2
1
2
1
7
2
2
2
2
2
2
2
2
2
1
1
2
1
8
2
2
2
2
2
2
2
1
2
1
1
2
2
9
2
2
2
2
2
2
2
2
2
1
2
2
2
10
2
1
2
2
2
2
2
2
2
1
1
2
2
11
2
2
2
2
2
2
2
1
2
1
2
2
2
12
2
2
1
2
2
2
2
2
2
1
2
2
2
13
2
2
2
2
2
2
2
2
2
1
2
1
2
14
2
2
2
1
2
2
2
2
2
1
1
2
2
15
2
2
2
2
2
1
2
2
2
1
1
2
1
16
2
1
2
2
2
2
1
2
2
1
1
2
2
17
2
1
2
1
1
2
2
1
2
2
1
2
2
18
2
2
2
1
2
2
2
1
2
1
2
2
2
19
2
2
1
2
2
2
2
2
1
1
2
2
1
20
2
2
2
2
1
2
1
1
2
2
2
1
2
21
2
1
2
2
2
2
2
2
2
2
2
2
2
22
1
1
1
1
2
1
1
2
1
2
2
2
1
23
2
1
2
1
1
2
1
1
2
2
1
1
1
24
2
1
2
1
1
1
2
1
2
2
2
2
2
25
2
2
2
2
2
1
1
2
2
1
1
2
1
26
2
1
2
1
1
2
2
2
2
1
1
2
2
27
2
1
2
2
2
2
1
2
2
1
2
2
2
28
1
2
1
1
2
2
2
1
1
2
1
2
2
29
2
1
2
2
2
2
2
2
2
1
1
2
2
30
1
1
1
2
1
2
1
2
2
1
1
2
1
77
x14 x15 x16 x17 x18 x19 x20 x21 x22 x23 x24
1 1 2 1 2 2 2 2 2 2 2 2 42
2 2 2 2 2 2 2 2 2 2 2 2 45
3 2 2 1 2 1 2 1 2 2 2 2 42
4 2 2 2 2 1 2 2 2 2 1 2 44
5 1 2 1 2 2 2 1 2 1 1 2 35
6 2 2 2 2 1 2 2 2 2 1 2 42
7 2 2 2 2 2 2 2 2 2 2 2 45
8 2 2 2 2 2 2 2 2 2 2 2 45
9 2 2 2 2 2 2 2 2 2 2 2 47
10 2 2 1 2 1 2 2 2 2 2 2 43
11 2 2 1 2 1 2 2 2 2 2 2 44
12 2 2 1 2 1 2 2 2 2 2 2 44
13 2 2 1 2 2 2 2 2 2 2 2 45
14 2 2 2 2 2 2 2 2 2 2 2 45
15 2 2 2 2 2 2 2 2 2 1 2 43
16 2 2 1 2 1 2 2 2 2 2 2 42
17 2 2 2 2 1 2 2 2 2 2 2 42
18 2 2 2 2 2 1 2 2 2 2 2 44
19 1 2 1 2 2 2 2 1 2 2 2 41
20 2 2 1 2 1 1 1 1 2 2 2 39
21 2 2 1 2 1 2 2 2 2 2 1 44
22 2 2 1 2 1 1 1 1 1 2 2 34
23 2 1 1 2 2 1 2 1 2 2 2 36
24 2 1 2 2 2 1 1 1 2 2 2 39
25 2 2 1 2 2 1 2 2 2 2 2 41
26 2 1 1 2 2 2 1 1 2 2 1 38
27 2 2 1 2 1 2 2 1 2 2 2 42
28 2 2 2 2 2 2 1 2 2 1 2 40
29 2 2 1 2 1 2 1 2 2 2 2 42
30 2 2 1 1 2 2 1 2 1 2 1 35
78
LAMPIRAN B-2
79
Subjek
skor Rater 1 skor Rater 2 aspek Tot al aspek Tot al pengenalan kata pengartian kata pengenalan kata pengartian kata
1 10 9 19 10 9 19
2 8 8 16 8 8 16
3 9 8 17 9 8 17
4 10 8 18 10 8 18
5 9 9 18 9 9 18
6 9 7 16 9 7 16
7 10 7 17 10 7 17
8 10 9 19 10 9 19
9 10 10 20 10 10 20
10 10 9 19 10 9 19
11 10 9 19 10 9 19
12 10 10 20 10 10 20
13 10 9 19 10 9 19
14 8 8 16 8 8 16
15 10 9 19 10 9 19
16 10 9 19 10 9 19
17 9 7 16 9 7 16
18 10 10 20 10 10 20
19 10 9 19 10 9 19
20 9 8 17 9 8 17
21 1 1 2 1 1 2
22 6 6 12 6 6 12
23 10 7 17 10 7 17
24 9 7 16 9 7 16
25 10 9 19 10 9 19
26 5 5 10 5 5 10
27 7 6 13 7 6 13
28 5 4 9 5 4 9
29 10 10 20 10 10 20
30 0 0 0 0 0 0
80
LAMPIRAN C
81
LAMPIRAN C-1
82
Reliability Dukungan Ibu
Putaran 1
Case Processing Summary
31 100,0 0 ,0 31 100,0 Valid Excludeda Total Cases N %
Listwise deletion based on all variables in the procedure. a.
Scale Statistics
41,74 11,065 3,326 24
Mean Variance Std. Deviation N of Items
Reliability Statistics
,671 24 Cronbach's
Alpha N of Items
Item-Total Statistics
39,84 10,073 ,472 ,645
40,19 9,428 ,444 ,636
39,97 10,032 ,316 ,653
40,03 9,766 ,377 ,646
39,97 9,366 ,584 ,625
39,90 10,557 ,151 ,669
39,97 9,699 ,448 ,640
40,06 11,129 -,092 ,696
39,84 10,473 ,258 ,661
40,48 12,458 -,507 ,731
40,39 11,045 -,067 ,694
39,87 10,383 ,258 ,660
40,06 9,729 ,374 ,646
39,84 10,673 ,153 ,668
39,84 10,340 ,328 ,656
40,32 9,826 ,314 ,652
39,77 10,647 ,328 ,661
40,16 11,406 -,175 ,707
39,94 10,062 ,330 ,652
40,03 9,166 ,603 ,620
39,97 9,699 ,448 ,640
39,84 9,740 ,658 ,632
39,94 11,062 -,060 ,688
39,84 10,606 ,188 ,665
x1 x2 x3 x4 x5 x6 x7 x8 x9 x10 x11 x12 x13 x14 x15 x16 x17 x18 x19 x20 x21 x22 x23 x24
Scale Mean if Item Deleted Scale Variance if Item Deleted Corrected Item-Total Correlation Cronbach's Alpha if Item
83
Reliability Dukungan Ibu
Putaran 2
Case Processing Summary
31 100,0 0 ,0 31 100,0 Valid Excludeda Total Cases N %
Listwise deletion based on all variables in the procedure. a.
Reliability Statistics
,807 14
Cronbach's
Alpha N of Items
Scale Statistics
24,65 9,370 3,061 14
Mean Variance Std. Deviation N of Items
Item-Total Statistics
22,74 8,465 ,466 ,795
23,10 7,824 ,456 ,794
22,87 8,449 ,299 ,806
22,94 8,129 ,391 ,799
22,87 7,783 ,593 ,782
22,87 7,983 ,502 ,789
22,97 8,366 ,283 ,809
22,74 8,598 ,387 ,799
23,23 8,181 ,327 ,806
22,68 8,959 ,352 ,804
22,84 8,273 ,405 ,797
22,94 7,662 ,585 ,782
22,87 7,916 ,532 ,787
22,74 8,198 ,629 ,785
x1 x2 x3 x4 x5 x7 x13 x15 x16 x17 x19 x20 x21 x22
Scale Mean if Item Deleted Scale Variance if Item Deleted Corrected Item-Total Correlation Cronbach's Alpha if Item
84
Reliability Dukungan Ibu
Putaran 3
Case Processing Summary
31 100,0 0 ,0 31 100,0 Valid Excludeda Total Cases N %
Listwise deletion based on all variables in the procedure. a.
Reliability Statistics
,811 12
Cronbach's
Alpha N of Items
Scale Statistics
21,19 7,561 2,750 12
Mean Variance Std. Deviation N of Items
Item-Total Statistics
19,29 6,880 ,375 ,804
19,65 6,037 ,510 ,793
19,48 6,391 ,410 ,803
19,42 6,052 ,636 ,780
19,42 6,318 ,497 ,794
19,29 6,746 ,464 ,798
19,77 6,514 ,311 ,815
19,23 7,247 ,291 ,810
19,39 6,512 ,433 ,800
19,48 5,991 ,601 ,783
19,42 6,185 ,566 ,787
19,29 6,680 ,509 ,795
x1 x2 x4 x5 x7 x15 x16 x17 x19 x20 x21 x22
Scale Mean if Item Deleted Scale Variance if Item Deleted Corrected Item-Total Correlation Cronbach's Alpha if Item
85
Reliability Dukungan Ibu
Putaran 4
Case Processing Summary
31 100,0 0 ,0 31 100,0 Valid Excludeda Total Cases N %
Listwise deletion based on all variables in the procedure. a.
Reliability Statistics
,810 11
Cronbach's
Alpha N of Items
Scale Statistics
19,23 7,247 2,692 11
Mean Variance Std. Deviation N of Items
Item-Total Statistics
17,32 6,626 ,343 ,806
17,68 5,759 ,508 ,792
17,52 6,058 ,430 ,800
17,45 5,789 ,625 ,780
17,45 6,056 ,483 ,794
17,32 6,426 ,480 ,797
17,81 6,228 ,307 ,816
17,42 6,185 ,451 ,797
17,52 5,725 ,593 ,782
17,45 5,856 ,589 ,783
17,32 6,426 ,480 ,797
x1 x2 x4 x5 x7 x15 x16 x19 x20 x21 x22
Scale Mean if Item Deleted Scale Variance if Item Deleted Corrected Item-Total Correlation Cronbach's Alpha if Item
86
LAMPIRAN C-2
Reliabilitas
87
Correlations
Correlations
1 1,000**
,000
31 31
1,000** 1
,000
31 31
Pearson Correlation Sig. (2-tailed) N
Pearson Correlation Sig. (2-tailed) N
RatterA
RatterB
RatterA RatterB
Correlation is significant at the 0.01 level (2-tailed).
88
LAMPIRAN D
89
LAMPIRAN D-1
90
NPar Tests
One-Sample Kolmogorov-Smirnov Test
31 31 19,23 32,32 2,692 9,894 ,209 ,293 ,151 ,219 -,209 -,293 1,161 1,634 ,135 ,010 N Mean Std. Deviation
Normal Parametersa,b
Absolute Positive Negative Most Extreme Differences Kolmogorov-Smirnov Z Asymp. Sig. (2-tailed)
X_TOT Y_TOT
Test distribution is Normal. a.
Calculated from data. b.
Explore
Case Processing Summary
31 100,0% 0 ,0% 31 100,0%
Y_TOT
N Percent N Percent N Percent
Valid Missing Total
Cases Descriptives 32,32 1,777 28,69 35,95 33,61 36,00 97,892 9,894 0 40 40 6 -2,137 ,421 4,467 ,821 Mean Lower Bound Upper Bound 95% Confidence
Interval for Mean
5% Trimmed Mean Median Variance Std. Deviation Minimum Maximum Range Interquartile Range Skewness Kurtosis Y_TOT
91
Y_TOT
Y_TOT
Stem-and-Leaf Plot
Frequency Stem & Leaf 4,00 Extremes (=<20) 1,00 2 . 4 1,00 2 . 6
9,00 3 . 222224444 11,00 3 . 66888888888 5,00 4 . 00000
Stem width: 10 Each leaf: 1 case(s)
NPar Tests
One-Sample Kolmogorov-Smirnov Test
27 27 19,52 35,56 2,622 4,163 ,199 ,240 ,172 ,143 -,199 -,240 1,036 1,247 ,233 ,089 N Mean Std. Deviation
Normal Parametersa,b
Absolute Positive Negative Most Extreme Differences Kolmogorov-Smirnov Z Asymp. Sig. (2-tailed)
X_TOT Y_TOT
Test distribution is Normal. a.
92
Graph Dukungan Ibu
Graph Kemampuan Membaca Permulaan
24 22 20 18 16 14 12 X_TOT 7 6 5 4 3 2 1 0 Frequ ency
Mean = 19.52 Std. Dev. = 2.622 N = 27
40 35 30 25 Y_TOT 10 8 6 4 2 0 F requ ency
93
LAMPIRAN D-2
94
Curve Fit
Model Description MOD_2 Y_TOT Linear Quadratic Cubic X_TOT Included Unspecified ,0001 Model Name 1 Dependent Variable 1 2 3 Equation Independent Variable ConstantVariable Whose Values Label Observations in Plots
Tolerance for Entering Terms in Equations
Case Processing Summary
27 0 0 0 Total Cases
Excluded Casesa
Forecasted Cases Newly Created Cases
N
Cases with a missing value in any variable are excluded from the analysis. a.
Variable Processing Summary
27 27
0 0
0 0
0 0
0 0
Number of Positive Values
Number of Zeros
Number of Negative Values
User-Missing System-Missing Number of Missing
95
Model Summary and Parameter Estimates
Dependent Variable: Y_TOT
,280 9,729 1 25 ,005 19,151 ,840
,326 5,808 2 24 ,009 -23,489 5,675 -,133
,326 5,808 2 24 ,009 -23,489 5,675 -,133 ,000
Equation Linear Quadratic Cubic
R Square F df1 df2 Sig.
Model Summary
Constant b1 b2 b3
Parameter Estimates
The independent variable is X_TOT.
40
35
30
25
20
22 20
18 16
14 12
X_TOT
Cubic Quadratic Linear Observed
96
LAMPIRAN E
97
Correlations
1 ,529**
,002
27 27
,529** 1
,002
27 27
Pearson Correlation Sig. (1-tailed) N
Pearson Correlation Sig. (1-tailed) N
X_TOT
Y_TOT
X_TOT Y_TOT
Correlation is significant at the 0.01 level (1-tailed).
98
Frequency Table
Kategori Aspek Pengenalan Kata
1 3.7 3.7 3.7 26 96.3 96.3 100.0 27 100.0 100.0
Sedang Baik Total Valid
Frequency Percent Valid Percent
Cumulative Percent
Kategori Aspek Pengartian Kata
2 7.4 7.4 7.4 25 92.6 92.6 100.0 27 100.0 100.0
Sedang Baik Total Valid
Frequency Percent Valid Percent
Cumulative Percent
Kategori Aspek Emosi
1 3.7 3.7 3.7 14 51.9 51.9 55.6 12 44.4 44.4 100.0 27 100.0 100.0
Kurang Sedang Baik Total Valid
Frequency Percent Valid Percent
Cumulative Percent
Kategori Aspek Penghargaan
1 3.7 3.7 3.7 4 14.8 14.8 18.5 22 81.5 81.5 100.0 27 100.0 100.0
Kurang Sedang Baik Total Valid
Frequency Percent Valid Percent
Cumulative Percent
Kategori Aspek Instrumental
1 3.7 3.7 3.7 6 22.2 22.2 25.9 20 74.1 74.1 100.0 27 100.0 100.0
Kurang Sedang Baik Total Valid
Frequency Percent Valid Percent
Cumulative Percent
Kategori Aspek Informatif
5 18.5 18.5 18.5
1 3.7 3.7 22.2
21 77.8 77.8 100.0
27 100.0 100.0
Kurang Sedang Baik Total Valid
Frequency Percent Valid Percent
99
Model Summary and Parameter Estimates
Dependent Variable: Total
Equation
Model Summary Parameter Estimates
R Square F df1 df2 Sig. Constant b1 b2 b3
Linear .326 12.119 1 25 .002 10.600 2.617
Quadratic .388 7.609 2 24 .003 -10.357 15.560 -1.940
Cubic .388 7.609 2 24 .003 -10.357 15.560 -1.940 .000
The independent variable is Emosi.
Aspek Emosi menyumbang 32,6% pada nilai total
Model Summary and Parameter Estimates
Dependent Variable: Total
Equation
Model Summary Parameter Estimates
R Square F df1 df2 Sig. Constant b1 b2 b3
Linear .708 60.709 1 25 .000 6.068 2.540
Quadratic .710 29.366 2 24 .000 9.227 1.196 .138
Cubic .710 29.366 2 24 .000 9.227 1.196 .138 .000
The independent variable is Penghargaan.
100
Model Summary and Parameter Estimates
Dependent Variable: Total
.666
49.960
1
25
.000
4.883
3.951
.667
24.028
2
24
.000
6.767
2.750
.183
.667
24.028
2
24
.000
6.767
2.750
.183
.000
Equation
Linear
Quadratic
Cubic
R Square
F
df1
df2
Sig.
Model Summary
Constant
b1
b2
b3
Parameter Estimates
The independent variable is Instrumental.
Aspek Inst rument al menyumbang 66,6% pada nilai t ot al
Model Summary and Parameter Estimates
Dependent Variable: Total
.804 102.519 1 25 .000 6.151 1.880
.804 49.210 2 24 .000 6.044 1.915 -.003
.804 49.238 2 24 .000 5.597 2.018 .000 -.001 Equation
Linear Quadratic Cubic
R Square F df1 df2 Sig. Model Summary
Constant b1 b2 b3 Parameter Estimates
The independent variable is Informatif.
101
Model Summary and Parameter Estimates
Dependent Variable: Total2
Equation
Model Summary Parameter Estimates
R Square F df1 df2 Sig. Constant b1 b2 b3
Linear .823 116.231 1 25 .000 .815 1.810
Quadratic .826 56.954 2 24 .000 7.000 .304 .089
Cubic .826 56.954 2 24 .000 7.000 .304 .089 .000
The independent variable is AsNal.
Aspek Pengenalan Kat a menyumbang 82,3% persen pada nilai t ot al
Model Summary and Parameter Estimates
Dependent Variable: Total2
Equation
Model Summary Parameter Estimates
R Square F df1 df2 Sig. Constant b1 b2 b3
Linear .870 167.251 1 25 .000 4.366 1.595
Quadratic .892 99.358 2 24 .000 -9.489 5.074 -.213
Cubic .892 99.358 2 24 .000 -9.489 5.074 -.213 .000
The independent variable is AsArti.
102
LAMPIRAN F
103
LAMPIRAN G